Week 4.1 - Genetic Algorithm
AIM:
Write a MATLAB code to optimise the stalagmite function and find the function's global maximum.
OBJECTIVE:
Explain the idea of a genetic algorithm in your own words, and also describe how to type "ga" in MATLAB.
Make sure that your code always produces the same results, even if it is run more than once.
Make graphs for all three studies and for F maximum vs. a number of iterations. The title and labels for the axes are required, and legends could be shown if needed.
Genetic algorithm:
The genetic algorithm is a way to solve optimization problems that are both limited and open-ended. It is based on natural selection, which is the process that drives biological evolution.
Each time through, a population of points is made. The best point in a group comes close to the best solution.
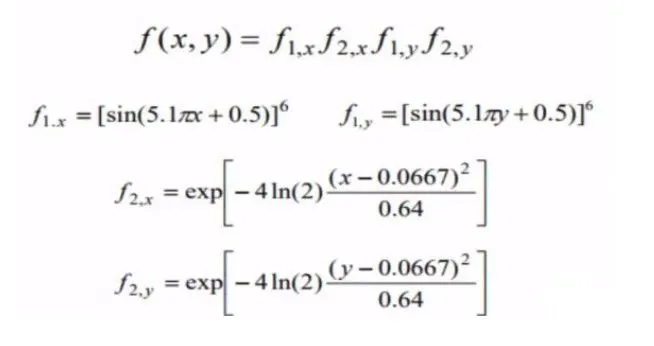
Stalagmite Function:
A stalagmite is a type of rock that looks like an upward-growing mound of mineral deposits that formed when water dripped onto the cave floor.
So, we're going to use the Genetic algorithm to make a graph that looks like a stalagmite.
Image:
Genetic Algorithm Program:
close all
clear all
clc


x=linspace(0,0.6,150);
y=linspace(0,0.6,150);


iterations= 150;
[xx,yy]= meshgrid(x,y);


for i=1:length(xx)
    for j=1:length(yy)
        input_vector(1)=xx(i,j);
        input_vector(2)=yy(i,j);
        f(i,j)=stalagmite(input_vector);
    end
end
tic
for i=1:iterations
    [input,f_opt(i)]=ga(@stalagmite,2);
    x_opt(i)=input(1);
    y_opt(i)=input(2);
end

iteration_1_time=toc

figure(1)
subplot(2,1,1)
hold on
surfc(xx,yy,-f)
shading interp
plot3(x_opt,y_opt,-f_opt,'marker','o','markersize',6,'markerfacecolor','r')
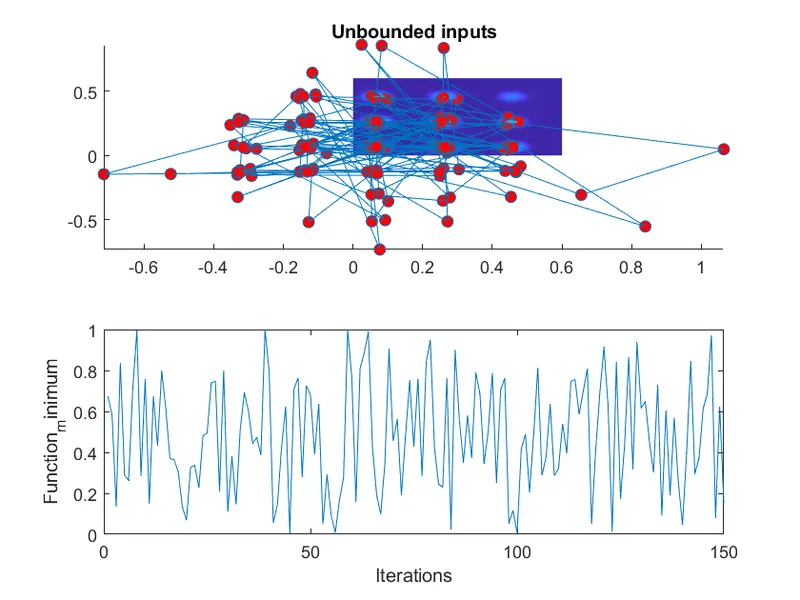
title('Unbounded inputs')
subplot(2,1,2)
plot(-f_opt)
xlabel('Iterations');
ylabel('Function_minimum');

tic
for i=1:iterations
    [input,f_opt(i)]=ga(@stalagmite,2,[],[],[],[],[0,0],[1,1]);
        x_opt(i)=input(1);
        y_opt(i)=input(2);
end

iteration_2_time=toc

figure(2)
subplot(2,1,1);
hold on
surfc(xx,yy,-f)
shading interp
plot3(x_opt,y_opt,-f_opt,'marker','o','markersize',6,'markerfacecolor','b')
title('Bounded inputs')
subplot(2,1,2)
plot(-f_opt)
xlabel('Iterations')
ylabel('Function_minimum')

options=optimoptions;
options=optimoptions(options,'populationsize',500);

tic
for i=1:iterations
    [input,f_opt(i)]=ga(@stalagmite,2,[],[],[],[],[0,0],[0.6,0.6],[],[],options);
        x_opt(i)=input(1);
        y_opt(i)=input(2);
end

figure(3)
subplot(2,1,1)
hold on
surfc(xx,yy,-f)
shading interp
plot3(x_opt,y_opt,-f_opt,'marker','o','markersize',5,'markerfacecolor','g')
title('Bounded inputs')
subplot(2,1,2)
plot(-f_opt)
xlabel('Iterations')
ylabel('Function_minimum')
Function of Stalagmite:
function [f]=stalagmite(input_vector)

x=input_vector(1);
y=input_vector(2);

f1=(sin(5.1*pi*x+0.5))^6;
f2=(sin(5.1*pi*y+0.5))^6;
f3=exp(-4*log(2)*(x-0.0667)^2/0.64);
f4=exp(-4*log(2)*(y-0.0667)^2/0.64);

f=(-f1*f2*f3*f4);
end
Errors occurred in my program: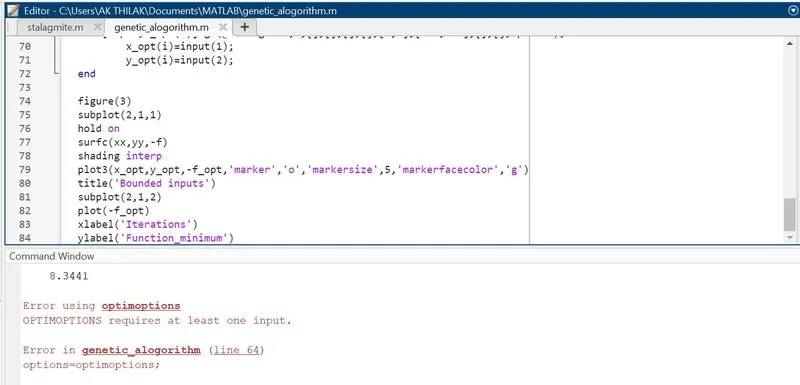
As I recognized the error, I replaced it with the correct 'ga' code.
Figure 1:
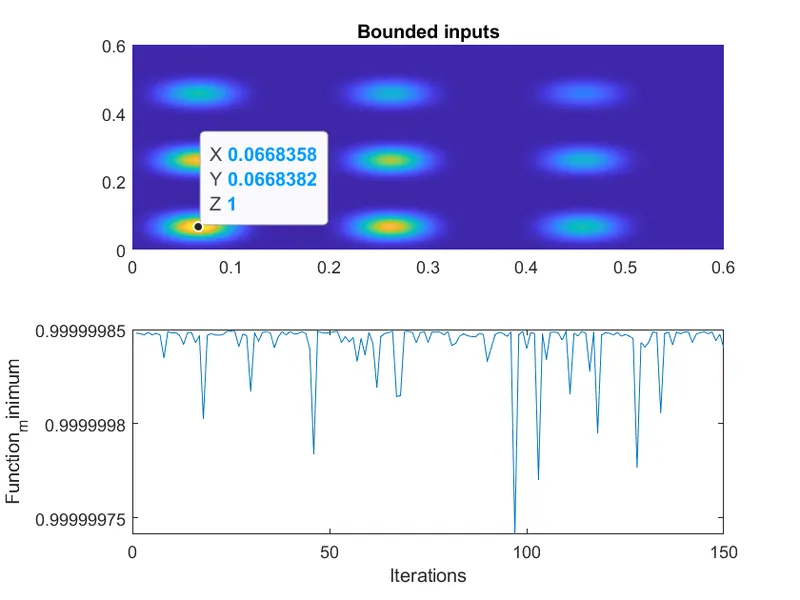
Figure 2:
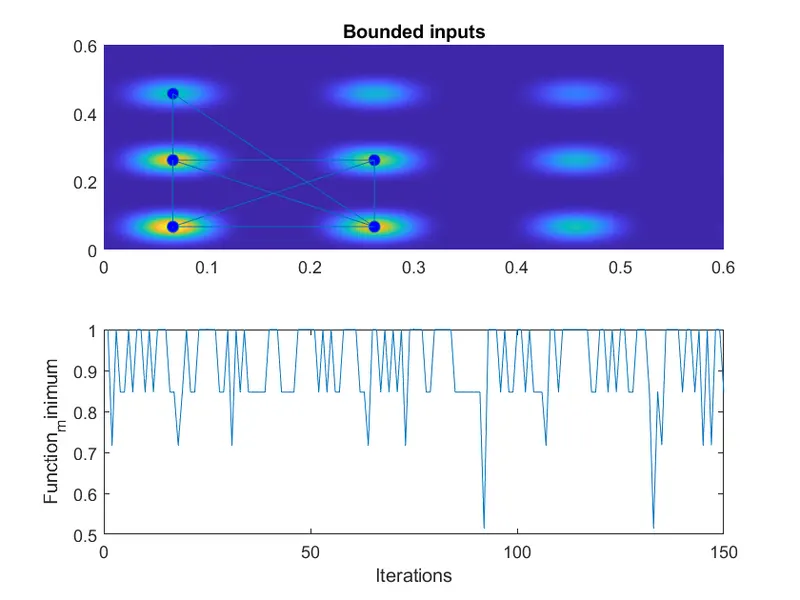
Figure 3: