Week 4.1 - Genetic Algorithm
Aim -
- Write a code in MATLAB to optimize the stalagmite function and find the global maxima of the function.
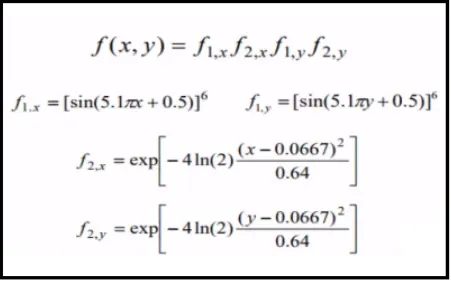
Governing equations used in the program -
The objective of this program -
- Write a code in MATLAB to optimize the stalagmite function and find the global maxima of the function.
- Clearly explain the concept of genetic algorithm in your own words and also explain the syntax for ga in MATLAB in your report.
- Make sure that your code gives the same output, even if it is made to run several times.
- Plot graphs for all 3 studies and for F maximum vs no. of iterations. Title and axes labels are a must, legends could be shown if necessary.
What is a genetic algorithm?
- A genetic algorithm is a search heuristic that is inspired by Charles Darwin’s theory of natural evolution. This algorithm reflects the process of natural selection where the fittest individuals are selected for reproduction in order to produce offspring for the next generation.
-
Five phases are considered in a genetic algorithm.
- Initial population
- Fitness function
- Selection
- Crossover
- Mutation
What is stalagmite function?
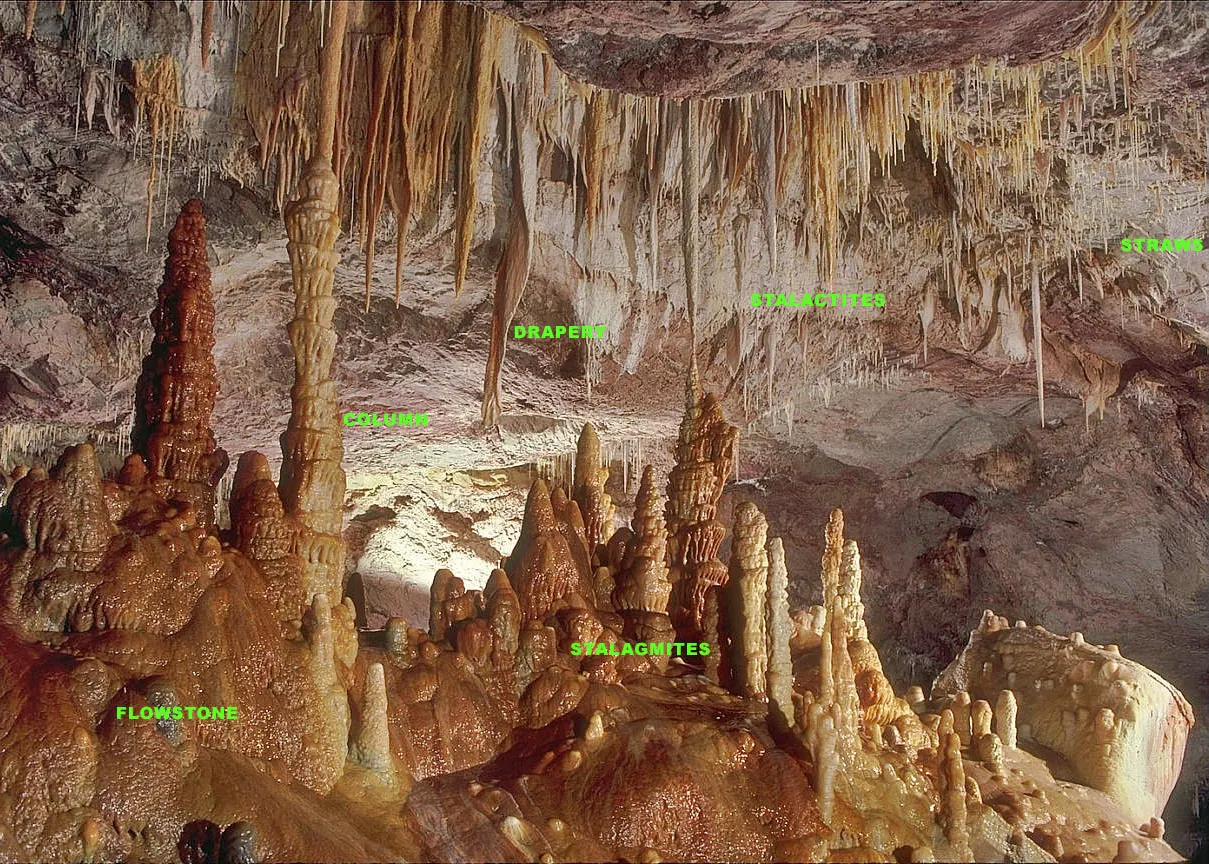
- As opposed to hanging from the ceiling, Stalagmite structures are formed from the cave floor that point upward. Stalagmite and Stalactite functions are mathematical functions that represent shapes similar to that of the stalagmite and stalactite functions.
What is optimization?
- Maximizing or minimizing some function relative to some set, often represents a range of choices available in a certain situation. The function allows comparison of the different choices for determining which might be “best.” Common applications: Minimal cost, maximal profit, minimal error, optimal design, optimal management, variational principles.
How genetic algorithm works?
- Genetic algorithm reflects the process of natural selection where the fittest individuals are selected for reproduction in order to produce offspring of the next generation. This concept is used to find the global minima to optimize the problem. Successive generations evolves through the processes that are mentioned below.
-
The genetic algorithm works in the following steps.
- The genetic algorithm begins by creating a random initial population
- It then creates a sequence of new populations, then at every step it uses the current generation to create next population. To create a new population the algorithm does the following steps.
- Rates each member of the population by computing its fitness. That is known as fitness score.
- Then it rates the raw fitness scores to convert them into operational values, which are known as expectation values.
- Then it selects the members and parents based on the expectations.
- Some members who have lower fitness in the current population, are passed on to the next population, which are chosen as elite members.
- It then produces new children from the parents by making random changes to a single parent i.e. mutation or by combining the vector entries of the parent pair i.e. crossover.
- The algorithm then stops when the one of the stopping criteria is met [2]
The GA stops when, after a predefined number of generations or if some stopping criterion has been met for example the fitness above the threshold or if the error rate is below any threshold. The fittest solution in the population is then returned as the global best solution.
GA syntax in Matlab: The GA syntaxes as described in are:
x = ga(fun,nvars)
x = ga(fun,nvars,A,b)
x = ga(fun,nvars,A,b,Aeq,beq)
x = ga(fun,nvars,A,b,Aeq,beq,lb,ub)
x = ga(fun,nvars,A,b,Aeq,beq,lb,ub,nonlcon)
x = ga(fun,nvars,A,b,Aeq,beq,lb,ub,nonlcon,options)
x = ga(fun,nvars,A,b,[],[],lb,ub,nonlcon,IntCon)
x = ga(fun,nvars,A,b,[],[],lb,ub,nonlcon,IntCon,options)
x = ga(problem)
[x,fval] = ga(___)
[x,fval,exitflag,output] = ga(___)
[x,fval,exitflag,output,population,scores] = ga(___)
Not all of the syntaxes were used in the project. Only “x = ga(fun,nvars)”, “x = ga(fun,nvars,A,b)” and “x = ga(fun,nvars,A,b,Aeq,beq,lb,ub,nonlcon,options)” were used to program the genetic algorithm using stalagmite function. The stalagmite function was coded using the following formulae:
Code in MATLAB to optimize the stalagmite function and find the global maxima of the function.
close all
clear all
clc


%input value
x = linspace(0,0.6,150);
y = linspace(0,0.6,150);
num_cases = 50;            % Number of itretion


% Forming x & y in 2D array
 [xx,yy] = meshgrid(x,y);

for i = 1:length(xx)
    for j = 1:length(yy)
        input_vector(1) = xx(i,j);
        input_vector(2) = yy(i,j);
        f(i,j) = stalagmite(input_vector);
    end
end
%--------------------------------------------------------------------------

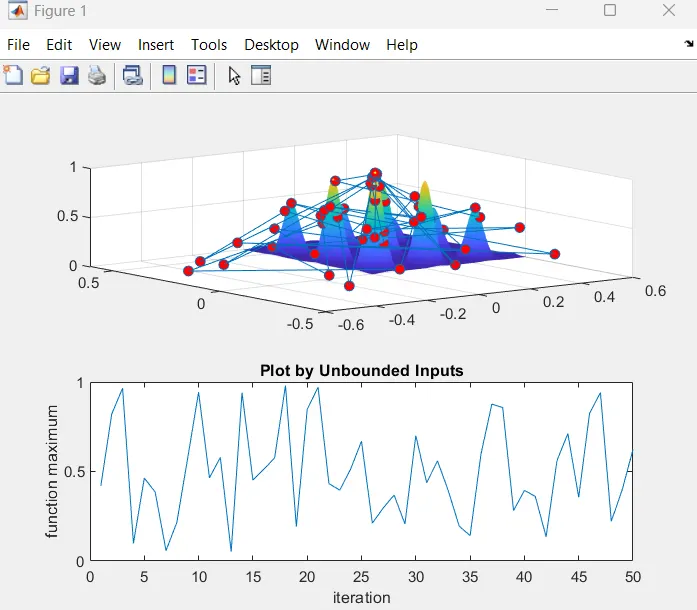
%Study 1- Study of Unbounded Inputs
tic
for i = 1:num_cases
    [inputs, fopt(i)]=ga(@stalagmite,2);
    xopt(i) = inputs(1);
    yopt(i) = inputs(2);
end
study_time1=toc
figure(1)
subplot(2,1,1)
surf(xx,yy,-f)
shading interp
hold on
plot3(xopt,yopt,-fopt,'marker','o','markerfacecolor','r')
subplot(2,1,2)
plot(-fopt)
xlabel('iteration')
ylabel('function maximum')
title('Plot by Unbounded Inputs')
%--------------------------------------------------------------------------

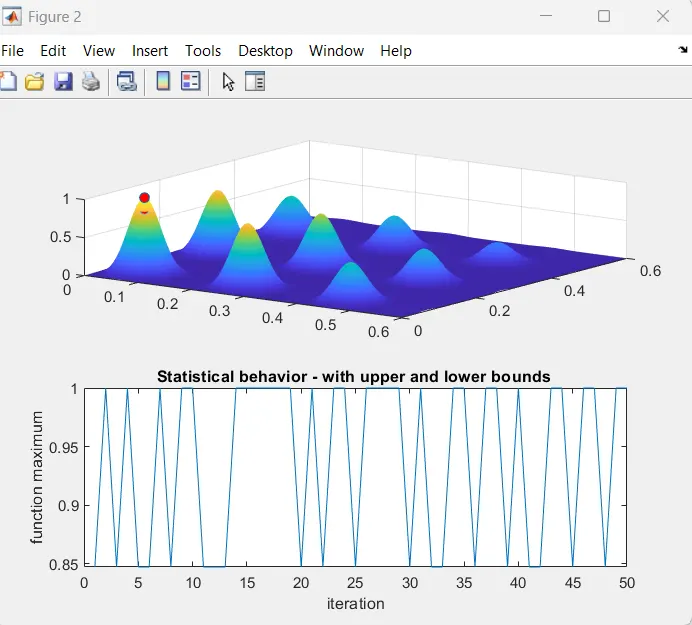
%Study 2 - Study of bounding the input values of x and y upper and lower limits
tic
for i = 1:num_cases
    [inputs,fopt(i)] = ga(@stalagmite,2,[],[],[],[],[0;0],[0.6;0.6]);
    xopt = inputs(1);
    yopt = inputs(2);
end
study_time2=toc
figure(2)
subplot(2,1,1)
surf(xx,yy,-f)
shading interp
hold on
plot3(xopt,yopt,-fopt,'marker','o','MarkerFaceColor','r')
subplot(2,1,2)
plot(-fopt)
xlabel('iteration')
ylabel('function maximum')
title('Statistical behavior - with upper and lower bounds ')
%--------------------------------------------------------------------------

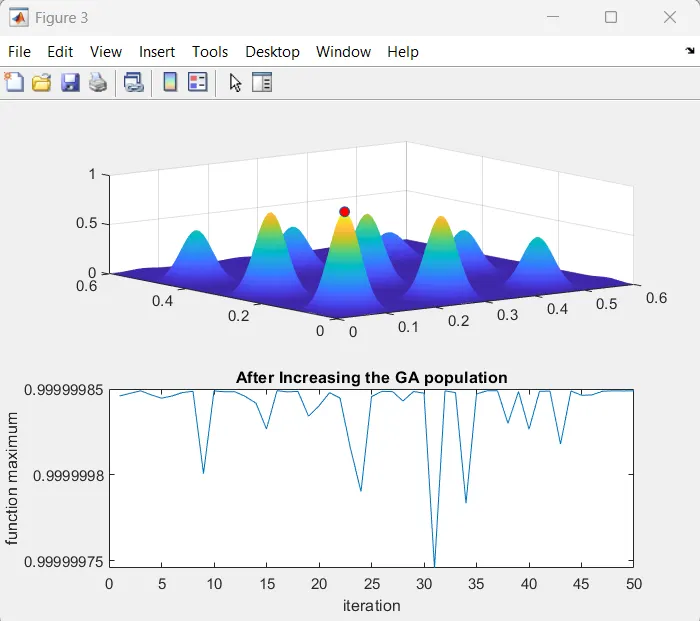
% Study 3 - Increasing the GA population to pick the number of optimization
options = optimoptions('ga','PopulationSize',400);


tic
for i = 1:num_cases
   [inputs,fopt(i)] = ga(@stalagmite,2,[],[],[],[],[0;0],[0.6;0.6],[],[],options);
   xopt = inputs(1);
   yopt = inputs(2);
end
study_time3 = toc;
% k = sprintf('%8.3 sec',study_time3);
% disp(k)
figure(3)
subplot(2,1,1)
surf(xx,yy,-f)
shading interp
hold on
plot3(xopt,yopt,-fopt,'marker','o','MarkerFaceColor','r')
subplot(2,1,2)
plot(-fopt)
xlabel('iteration')
ylabel('function maximum')
title('After Increasing the GA population')
%--------------------------------------------------------------------------
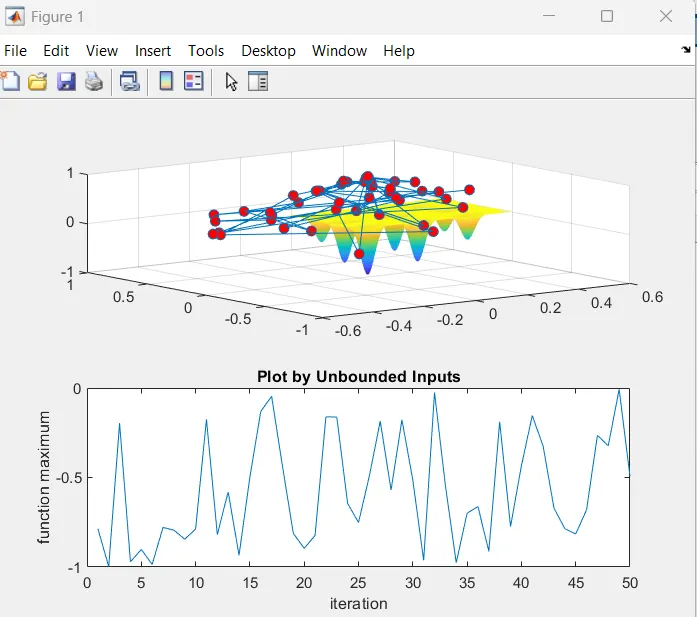
Fitness function used in this program -
function A = stalagmite(input_vector)
x = input_vector(1);
y = input_vector(2);
f1=(sin(5.1*pi*x+0.5)).^6;
f2=exp((-4*log(2)*((x-0.0667).^2))/0.64);
f3=(sin(5.1*pi*y+0.5)).^6;
f4=exp((-4*log(2))*((y-0.0667).^2)/0.64);
A = -(f1*f2*f3*f4);
end
Explanation of code -