Week 4.1 - Genetic Algorithm
CHALLENGE -7: Genetic Algorithm
AIM:
To understand the concept of genetic algorithm by creating a MATLAB program to optimise the stalagmite function and find the global maxima of the function.
OBJECTIVE:
- To understand the concept of Gentic Algorithm
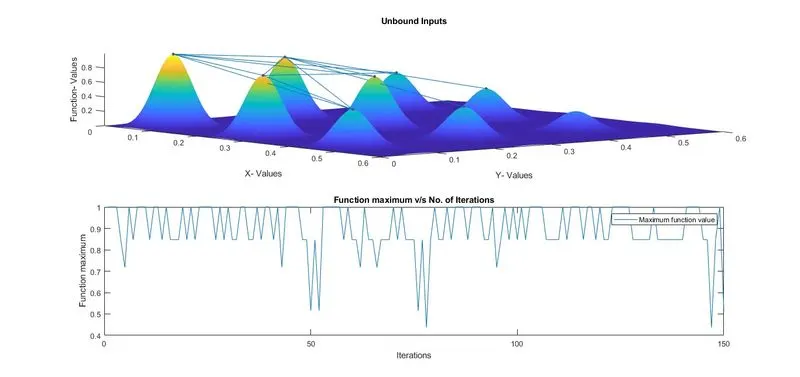
- To write a Matlab program to solve the given stalagmite function and find the global maxima by using three different conditions of ga and plot the surface graph and the plot of global maximum vs No. of Iterations.
THEORY:
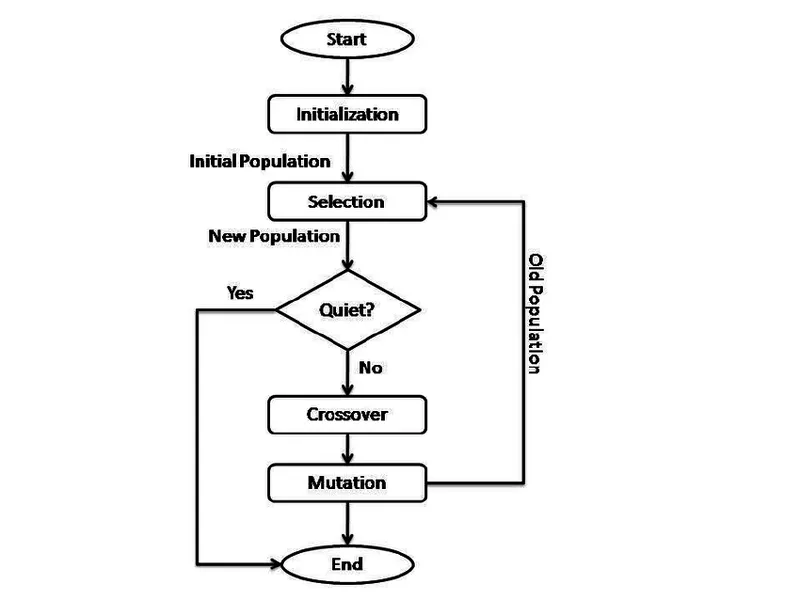
Inorder to get an optimial solution for a probelm there are different types of optimisation processes, Genetic algorithm is one of the such processes which helps to find the optimal solution. This method is based on the natural selection that is the process which drives the biological evolution. In genetic algoritham individual solutions are modified repeatedly inorder to get an optimal solution. That is at each step ga selects parents from the current population and uses them to produce the children for the next generation and upon evolution reaches an optimal solution.
The flow chart representing the process of ga is shown below.
Applications of Genetic Algorithm
- Optimization: For optimization of a problem like finding the maimum or minimum of function under given set of constraints
- Economics
- Image processing
- Neural networks. etc...
The figure shown below represents the general syntaxes which are used in Matlab for GA.
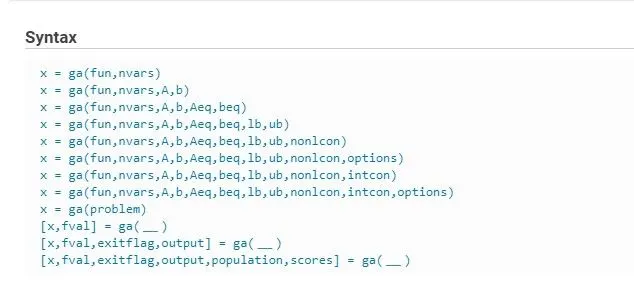
Here "fun" represents the objective function, nvars represents number of variables in the objective function lb and ub represents the lower and upper bounds respectively.
GOVERNING EQUATIONS
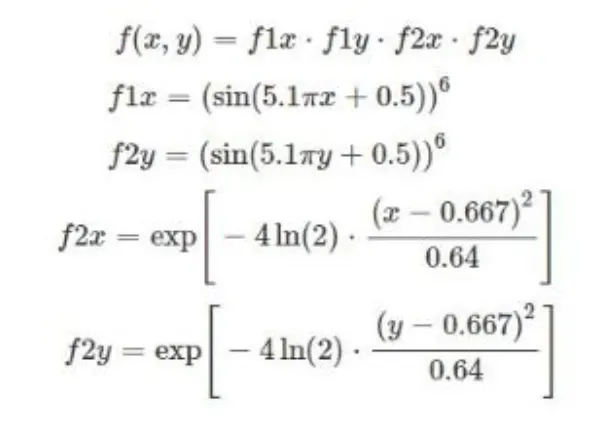
The euqations which are used for solving the stalagmite function is shown below.
PROCEDURE
- Program is started by using the general commands clear all, close all and clc to clear and close all the pre-occupied operations of Matlab.
- Provide the values for the variables x and y and creat 2-D array using meshgrid commands.
- Create a nested for loop for solving stalagmite function inside the loop call the stalagmite function.
- Inside stalagmite function script solve the above mentioned equations and return the answer.
- Define number of iteration till which ga should iterate and create a for loop for ga solving (Use proper syntax for ga for each case as shown in the below code)
- Inside the loop extract the optimum function value and the points at which the same is obtained.
- Plot the surface and the number of iteration vs function maximum plot. Provide title, label and legends if needed.
- Save and run the case
- Solve the above steps foe 3 cases and obtain the output.
Case 1: To find the unconstrained maximum of function value, using the ga syntax- x = ga(fun,nvars)
Case 2: To find maximum of function value by defining a set of lower and upper bounds on the design variables there by providing a range, using the ga syntax- x = ga(fun,nvars,A,b,Aeq,beq,lb,ub)
Case 3: To find maximum of function value by defining a set of lower and upper bounds on the design variables there by providing a range and creating optimization option - PopulationSize, using the ga syntax- x = ga(fun,nvars,A,b,Aeq,beq,lb,ub,nonlcon,intcon,options)
% Program to optimise the stalagmite function and to find the global maxima
% of the function.
clear all
close all
clc

% Input, Creating the value of variables x and y
x = linspace(0,0.6,150);
y = linspace(0,0.6,150);

% Creating a 2_D array by using meshgrid command
[xx yy] = meshgrid(x, y);

% Nested for loop to execute stalagmite function
for i = 1:length(xx)
    for j = 1:length(yy)
        input_vector(1) = xx(i,j);
        input_vector(2) = yy(i,j);
        f(i,j) = ga_stalagmite(input_vector);    % Calling Stalagmite fuction
    end
end


num_case = 150;    % Defining number of iteration requered for ga algorithim

% Study 1- To find the unconstrained maximum of function value.

% for loop to execute ga command to define the maximum of value.
for i =1:num_case
    [inputs, f_opt(i)] = ga(@ga_stalagmite, 2);   % GA syntax

    % Input values at which we got the optimum result
    x_opt(i) = inputs(1);
    y_opt(i) = inputs(2);
end

% Plotting the results
figure(1)
subplot(2,1,1)        % Crearing a subplot to plot 2 graphs
hold on
surfc(x, y, -f)       % Surface creating negative sign is used to find the maximum value
shading interp        % To eliminate the grid on the generated surface

plot3(x_opt, y_opt, -f_opt,'marker', 'o', 'MarkerSize',3, 'MarkerFaceColor', 'r')
title('Unbound Inputs')
xlabel('X- Values')
ylabel('Y- Values')
zlabel('Function- Values')


% Plotting function maximum vs no. of iterations.
subplot(2,1,2)
plot(-f_opt)
title('Function maximum v/s No. of Iterations')
xlabel('Iterations')
ylabel('Function maximum');
legend('Maximum function value')


% Study 2- To find maximum of function value by defining a set of
% lower and upper bounds on the design variables there by providing a range

% for loop to execute ga command
for i =1:num_case
    % GA syntax with lower and upper bounds.
    [inputs2, f_opt2(i)] = ga(@ga_stalagmite, 2, [], [], [], [], [0, 0], [1, 1]);

    % Input values at which we got the optimum result
    x_opt2(i) = inputs2(1);
    y_opt2(i) = inputs2(2);
end

% Plotting the results
figure(2)
subplot(2,1,1)         % Crearing a subplot to plot 2 graphs
hold on
surfc(x, y, -f);       % Surface creating negative sign is used to find the maximum value
shading interp         % To eliminate the grid on the generated surface

plot3(x_opt2, y_opt2, -f_opt2,'marker', 'o', 'MarkerSize',3, 'MarkerFaceColor', 'r')
title('Unbound Inputs')
xlabel('X- Values')
ylabel('Y- Values')
zlabel('Function- Values')

% Plotting function maximum vs no. of iterations.
subplot(2,1,2)
plot(-f_opt2)
title('Function maximum v/s No. of Iterations')
xlabel('Iterations')
ylabel('Function maximum');
legend('Maximum function value')

% Study 3- To find maximum of function value by defining a set of
% lower and upper bounds on the design variables there by providing a range
% and creating optimization option - PopulationSize

% Syntax for creating option
options = optimoptions('ga');
options = optimoptions(options,'PopulationSize',500);

% for loop to execute ga command
for i =1:num_case
    [inputs3, f_opt3(i)] = ga(@ga_stalagmite, 2, [], [], [], [], [0, 0], [1, 1],[], [], options);

    % Input values at which we got the optimum result
    x_opt3(i) = inputs3(1);
    y_opt3(i) = inputs3(2);
end

% Plotting the results
figure(3)
subplot(2,1,1)         % Crearing a subplot to plot 2 graphs
hold on
surfc(x, y, -f);       % Surface creating negative sign is used to find the maximum value
shading interp         % To eliminate the grid on the generated surface

plot3(x_opt3, y_opt3, -f_opt3,'marker', 'o', 'MarkerSize',3, 'MarkerFaceColor', 'r')
title('Unbound Inputs')
xlabel('X- Values')
ylabel('Y- Values')
zlabel('Function- Values')

% Plotting function maximum vs no. of iterations.
subplot(2,1,2)
plot(-f_opt3)
title('Function maximum v/s No. of Iterations')
xlabel('Iterations')
ylabel('Function maximum');
legend('Maximum function value')
Function script used in the main program is attached below:
function [f] = ga_stalagmite(input_vector)

        f1x = (sin((5.1*pi*input_vector(1))+0.5))^6;
        f1y = (sin((5.1*pi*input_vector(2))+0.5))^6;
        f2x = exp(-4*log(2)*((input_vector(1)-0.0667)^2)/0.64);
        f2y = exp(-4*log(2)*((input_vector(2)-0.0667)^2)/0.64);
        f = -(f1x*f1y*f2x*f2y);

    end
Note: ga function is used to return the minimum value, but in this project the object is to find the maximum value of the function which can be achieved by providing negative for the results as shown in the program.
RESULTS:
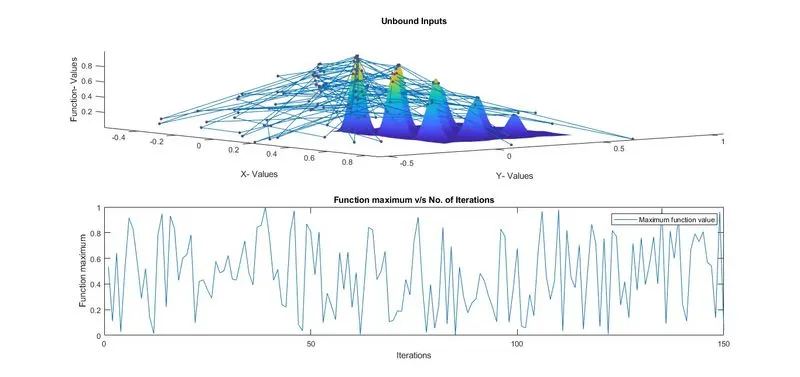
Case- 1 Output plots obtained for case 1 is attached below
Case- 2: Output plots obtained for case 2 is attached below
Case- 3: Output plots obtained for case 3 is attached below
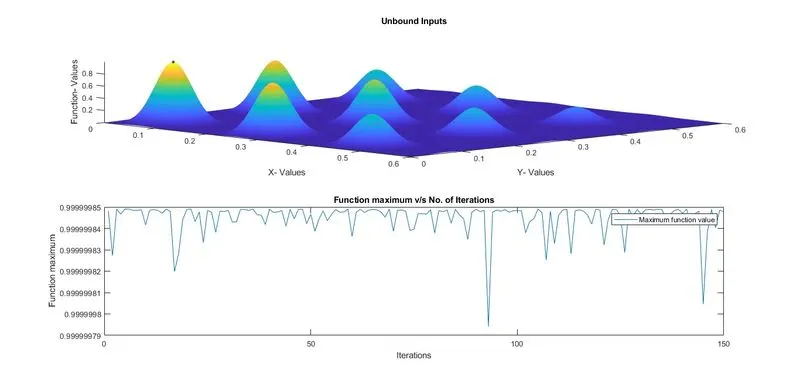
By comaparing the results of 3 cases it is observed that case 3 is more accurate and gives an more optimal maxima solution as compared to others. Case 1 is a general ga function which is used to get unconstrained maximum function value and in case 2 a contrain is provided by giving the lower and upper bound. In the last case upper and lower bound as well as the populationsize option is also given to make the search more accurate thus case 3 gives an accurate optimal solution as comapred to others.
CONCLUSION:
A study in ga is carried out and a program in Matlab is written to solve the stalagmite fuction, to find global maxima of the function is solved by using 3 different cases of genetic algorithm and to plot different graphs of the same.
References
- Genetic Algorithm Explained by Gopinath, Dated 19 March 2022- https://skill-lync.com/knowledgebase/genetic-algorithm-explained
- What is Genetic Algorithm? by Mathwork - https://in.mathworks.com/help/gads/what-is-the-genetic-algorithm.html#:~:text=The%20genetic%20algorithm%20is%20a,a%20population%20of%20individual%20solutions.