Project 1 - Parsing NASA thermodynamic data
PROJECT - 1: Parsing NASA Thermodynamic Data
AIM:
To write a Matlab program to evalute the properties like specific heat, enthalpy, entropy and to evalute the molecular weight of given list of species by file parsing.
OBJECTIVE:
- To determine the properties of the given species with respect to the lower local temperature and lower upper temperature by using file parsing method.
- To plot the variation of specific heat, enthalpy and entropy of these species and to store it to separate folder.
- To evaluate the molecular weight of the same species.
THEORY:
Specific Heat - Specific heat of a gas at constat pressure is the amount of heat required to raise 1 kg of gas by a unit temperature at constant pressure.
Specific heat at constant pressure is represented by Cp
Unit = kJ/(kg.K)
Enthalpy - Enthalpy is the sum of the internal energy of the system plus the product of the pressure of the gas in the system and its volume
that is H = U + PV
Enthalpy is usually represented by H
Unit = kJ/(kg.K)
Entropy - Entropy is the measure of the randomness of the system. It is generally described as the heat transfer to the system divided by temperature.
Entropy usually represented by S
Unit = kJ/K.
Molecular Weight - Molecular weight is defined as the mass of the molecules present in the substance and it is mainly calculated by summing the atomic weight of individual atoms present in the molecule.
Theory related to Matlab programming
In this program properties and molecular weight of the given species are calulated by using file parsing method. From the given data file each line is read separately using fgetl command and relevent datas are stored. While reading the data from file it is stored as string so numbers are converted from string to number by str2num command. strsplit is also used to split the given string based on a datum like space, letters etc... Property plot of each species are stored in separate folder by making a new directory by using the command mkdir.
GOVERNING EQUATION OR FORMULA USED
The equations used to determine different properties of the given species are provided below:
For upper local temperature
`(Cp)/R=a1+a2**T+a3**T^2+a4**T^3+a5**T^4`
`(H)/(RT)=a1+a2**T/2+a3**T^2/3+a4**T^3/4+a5**T^4/5+(a6)/T`
`(S)/(R)=a1lnT+a2**T+a3**T^2/2+a4**T^3/3+a5**T^4/4+a7`
For lower local temperature
`(Cp)/R=a8+a9**T+a10**T^2+a11**T^3+a12**T^4`
`(H)/(RT)=a8+a9**T/2+a10**T^2/3+a11**T^3/4+a12**T^4/5+(a13)/T`
`(S)/(R)=a8lnT+a9**T+a10**T^2/2+a11**T^3/3+a12**T^4/4+a14`
Where
Cp = Specifc heat capacity at constant pressure
R = Universal Gas Constant 8.314 `(kJ)/(kmol*K)`
T = Temperature (K)
a1 - a7 = High-temperature coefficients
a8 - a14 = Low-temperature coefficients
To determine molecular weight of the given species consider the atomic number of following elements as
- Carbon (C) = 12.0107 u
- Hydrogen (H) = 1.00794 u
- Oxygen (O) = 15.994 u
- Nitrogen (N) = 14.0067 u
- Argon (A) = 39.948 u
PROCEDURE:
- Program is started by using the general commands clear all, close all and clc to clear and close all the pre-occupied operations of Matlab.
- Open the dat file saved in the system using fopen command. In the dat file first few lines are heading and command read those lines using fgetl command and skip because it is not possible to jump to a particular line for this case line by line evaluation is needed.
- Create a for loop till 53 to evaulate different properties and molecular weight of all the given species.
- Inside the for loop first read the first line (first line means first usefull line here headings and comments are skipped) using fgetl command. The extracted string is splitted using strspilt command based upon the spacing to eliminate the spacings in between. After splitting, a cell array is formed, from the cell array extract the species name and followed by local temperatures. Here extracted temperatures are formed in string so it is necessary to convert it to number by str2num command.
- Read the second line and extract all the available coefficients by initially finding the position of E using findstr command and followed by extracting each available coefficients in that line
- Repeat the step 5 for lines three and four to extract the remaining coefficients.
- Calculate the properties by using above mentioned equations and a if condition to use upper local temperature for a1 to a7 coefficients and lower local temperature for a8 to a14 coefficients.
- Make folder to store all the plots of properties of each species by using mkdir command, change directory to new directory by command cd.
- Plot Cp, Enthalpy and Entropy variation with Temperature. Provide suitable title, labels, legends if necessary to the plots.
- Save each plot by using saveas command.
- Call mol_wt function to determine the molecular weight of each species.
- Inside the mol_wt function define each elements symbol and defines its atmic weight into 2 different array.
- Set molecular weight inital value as 0 and creat a nested for loop to determine the molecular weight.
- Inside the loop provide a condition to compare each symbols with available species name and allocate the atmoic weight values to molecular weight.
- Check whether any number is there with species name (like H20) if so extract that number and multiply it with atomic weight value and add it to molecular weight.
- End nested loop and print the molecular weight using fprintf command and end the function
- Save and run the program.
The Matlab code for the main program is attached below.
% Program to find the properties, molecular weight of all the species in the given data file
% by file parsing - Project 1
clear all
close all
clc

% Command to open the dat file from the system.
f1 = fopen('THERMO.dat','r');

% for loop to skip the headings and the comments
for i = 1:5
     fgetl(f1);
 end

% for loop to determine the properties and molecular weight of all the 53
% species.
 for i = 1:53

% Extracting the first line from the given data file by using fgetl command.
first_line = fgetl(f1);
% Splitting the extracted string by elimintaing the space available.
temp = strsplit(first_line, ' ');
species_name = temp{1};                        % Storing the species name
% Extracting lower, mid and upper temperature and coverting the string into number.
lower_local_temp = str2num(temp{end - 3});
upper_local_temp = str2num(temp{end - 2});
mid_local_temp = str2num(temp{end - 1});
t = linspace(lower_local_temp,upper_local_temp,500); % defining a temperature array

% Extracting the second line from the given data file by using fgetl command.
second_line = fgetl(f1);
% To extract the coefficient first need to find the position of E in the
% second line
temp = findstr(second_line, 'E');           % finding the position of E
% Extracting available coefficients from second line and coverting them to number.
a1 = str2num(second_line(1:12+3));
a2 = str2num(second_line(temp(1)+4:temp(2)+3));
a3 = str2num(second_line(temp(2)+4:temp(3)+3));
a4 = str2num(second_line(temp(3)+4:temp(4)+3));
a5 = str2num(second_line(temp(4)+4:temp(5)+3));

% Extracting the third line from the given data file by using fgetl command.
third_line = fgetl(f1);
temp = findstr(third_line, 'E');     % Finding the position of E
% Extracting available coefficients from third line and coverting them to number.
a6 = str2num(third_line(1:12+3));
a7 = str2num(third_line(temp(1)+4:temp(2)+3));
a8 = str2num(third_line(temp(2)+4:temp(3)+3));
a9 = str2num(third_line(temp(3)+4:temp(4)+3));
a10 = str2num(third_line(temp(4)+4:temp(5)+3));

% Extracting the fourth line from the given data file by using fgetl command.
fourth_line = fgetl(f1);
temp = findstr(fourth_line, 'E');    % Finding the position of E
% Extracting available coefficients from fourth line and coverting them to number.
a11 = str2num(fourth_line(1:12+3));
a12 = str2num(fourth_line(temp(1)+4:temp(2)+3));
a13 = str2num(fourth_line(temp(2)+4:temp(3)+3));
a14 = str2num(fourth_line(temp(3)+4:temp(4)+3));

% Property calculations

% condition determine lower temperature and upper temperature first 7
% coefficients are used with upper temperature and remaining 7 with lower temperature
if t<=mid_local_temp
         % Property calculation with lower temperature
    Cp = (a8 + a9*t + a10*t.^2 + a11*t.^3 + a12*t.^4)*8.314;
    H = (a8 + a9*(t/2) + a10*(t.^2)/3 + a11*(t.^3)/4 + a12*(t.^4)/5 + a13./t).*t*8.314;
    S = (a8*log(t) + a9*t + a10*(t.^2)/2 + a11*(t.^3)/3 + a12*(t.^4)/4 + a14)*8.314;

else
    % Property calculation with lower temperature
    Cp = (a1 + a2*t + a3*t.^2 + a4*t.^3 + a5*t.^4)*8.314;
    H = (a1 + a2*(t/2) + a3*(t.^2)/3 + a4*(t.^3)/4 + a5*(t.^4)/5 + a6./t).*t*8.314;
    S = (a1*log(t) + a2*t + a3*(t.^2)/2 + a4*(t.^3)/3 + a5*(t.^4)/4 + a7)*8.314;

end

mkdir(species_name)         % Making a new directory by using mkdir command
cd(species_name)            % Changing the directory to new directory

% Plot to show the variation of specific heat with temperature
figure(1)
plot(t,Cp, 'LineWidth',3, 'Color','r')
xlabel('Temperature (K)')
ylabel('Specific Heat (kJ/kg.K)')
title('Cp vs Temperature of', sprintf('%s', species_name))
saveas(figure(1), 'Cp_vs_temp.jpg')    % Saving the figure to a jpg file

% Plot to show the variation of enthalpy with temperature
figure(2)
plot(t,H, 'LineWidth',3, 'Color','b')
xlabel('Temperature (K)')
ylabel('Enthalpy (kJ/kg)')
title('Enthalpy vs Temperature of', sprintf('%s', species_name))
saveas(figure(2), 'enthalpy_vs_temp.jpg')  % Saving the figure to a jpg file

% Plot to show the variation of entropy with temperature
figure(3)
plot(t, S, 'LineWidth',3, 'Color','g'% Saving the figure to a jpg file)
xlabel('Temperature (K)')
ylabel('Entropy (kJ/K)')
title('Entropy vs Temperature of', sprintf('%s', species_name))
saveas(figure(1), 'Entropy_vs_temp.jpg')   % Saving the figure to a jpg file

% Changing back the directory
cd ..

% Calling the molecular weight fuction
mw = mol_wt(species_name);
end
The Matlab code for the function script mol_wt is attached below.
% Defining molecular weight function to calculate the molecular weight of
% the given species.
function mw = mol_wt(sp_name)

% Creating an array with symbols of species
ele = ['C', 'H', 'O', 'N', 'A'];

% Creating an array to store the molecular weight of the stored symbols of
% species in the above line.
value = [12.0107 1.00794 15.994 14.0067 39.948];

% Assigning molecular weight value initially to zero
mw = 0;

% Creating a nested for loop for determining the molecular weight
for i = 1:length(sp_name)
    for j = 1:length(ele)

% If condition to compare the given speicies name with the array created with different symbols
        if strcmp(sp_name(i), ele(j))
            mw = mw + value(j);        % Evaluating the molecular weight if the condition satisfy

            pos = j;
        end
    end

% Determining whether any number is present in the species name
    k = str2num(sp_name(i));

% Condition to evaluate if number is present in the species name
    if(k>1)
        mw = mw + value(pos)*(k-1);    % Defining the molecular weight based on the number present
    end
end

% Printing the molecular weight of the given species.
fprintf('Molecular weight of the %s is %f \n', sp_name,mw);
end
Note1: While reading the numbers from the file it is strored in character it is necessary to convert it into number.
Note2: As the defined temperature of lower local and upper local temperture is an array it is necessary to do the array multiplication and divsion in some part of the equations.
RESULTS
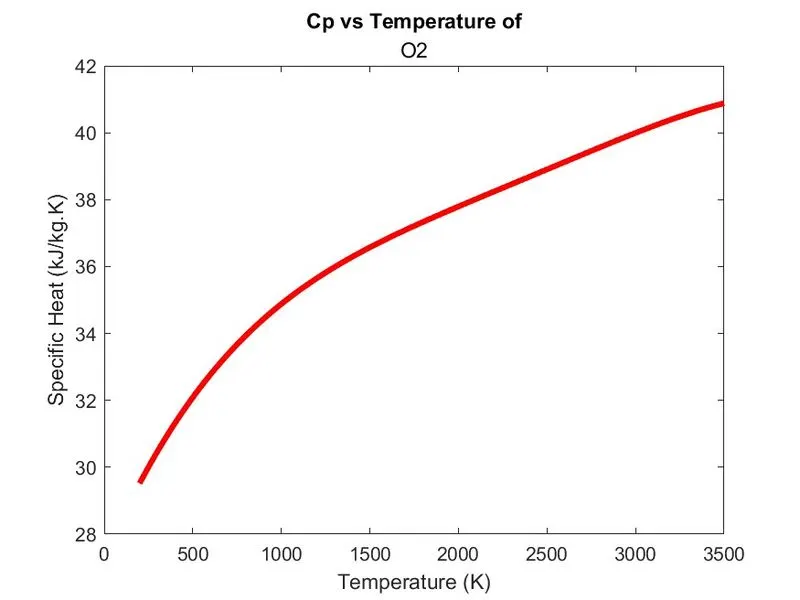
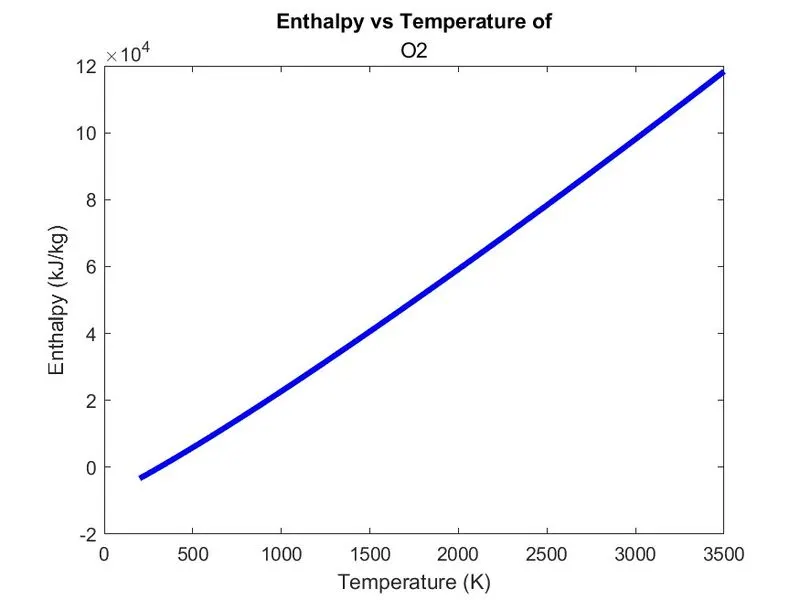
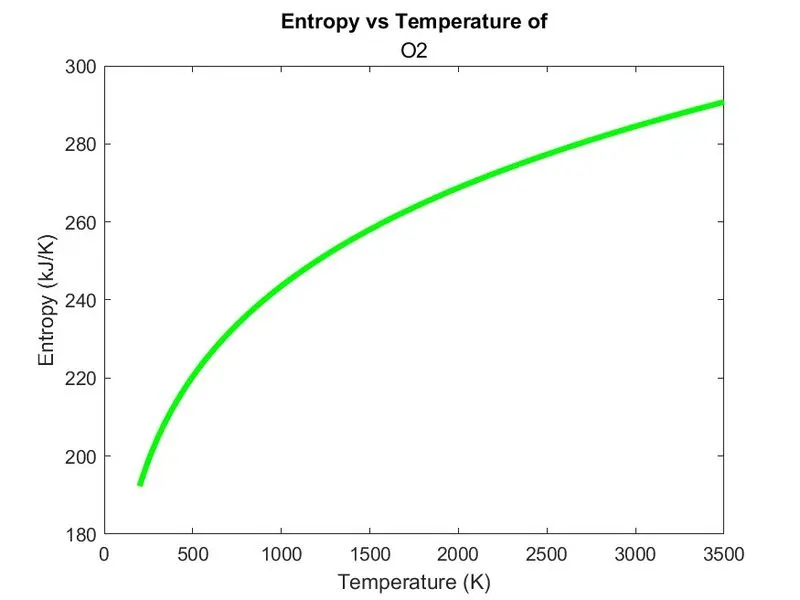
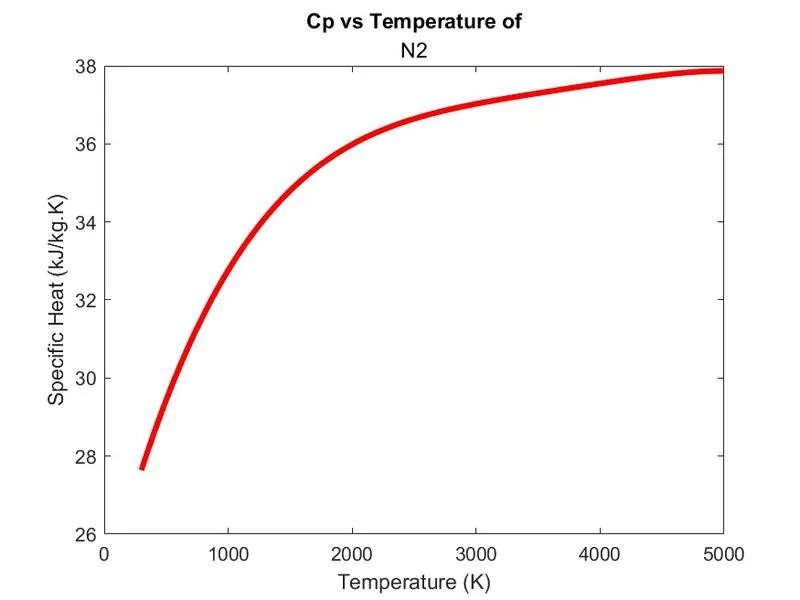
The figures below shown are the variation of different properties with temperature for
1. O2
Variation of specific heat at constant pressure with temperature
Variation of enthalpy with temperature
Variation of entropy with temperature
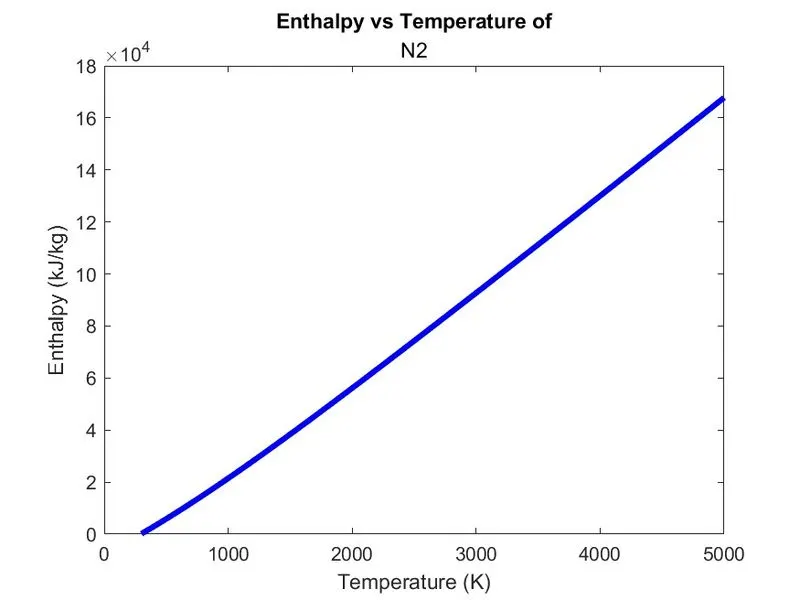
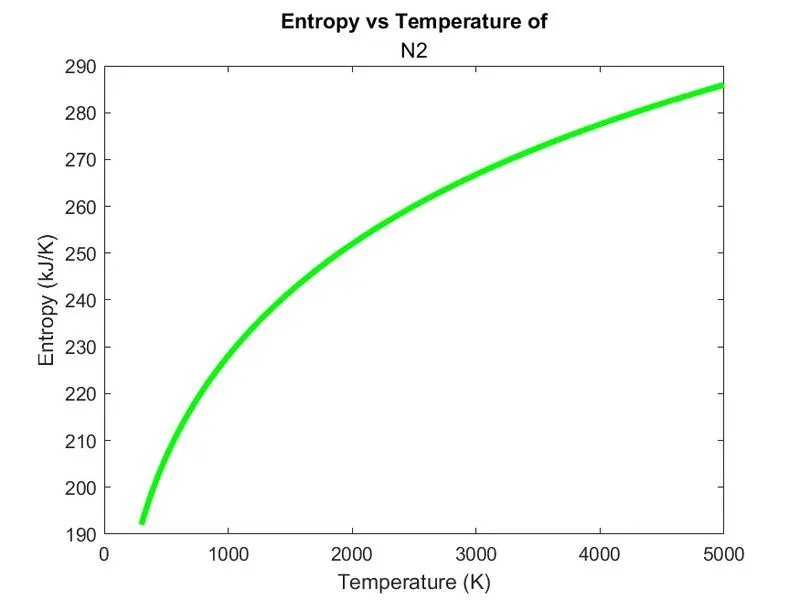
2. N2
Variation of specific heat at constant pressure with temperature
Variation of enthalpy with temperature
Variation of entropy with temperature
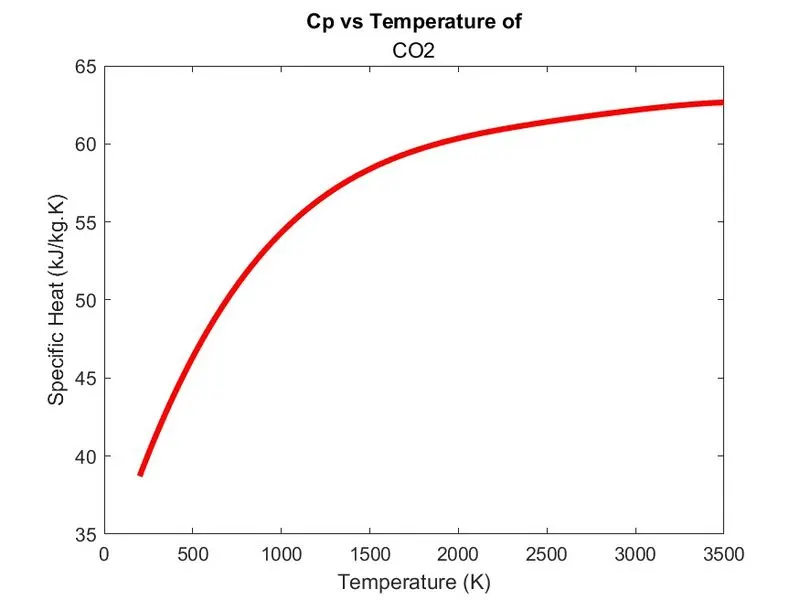
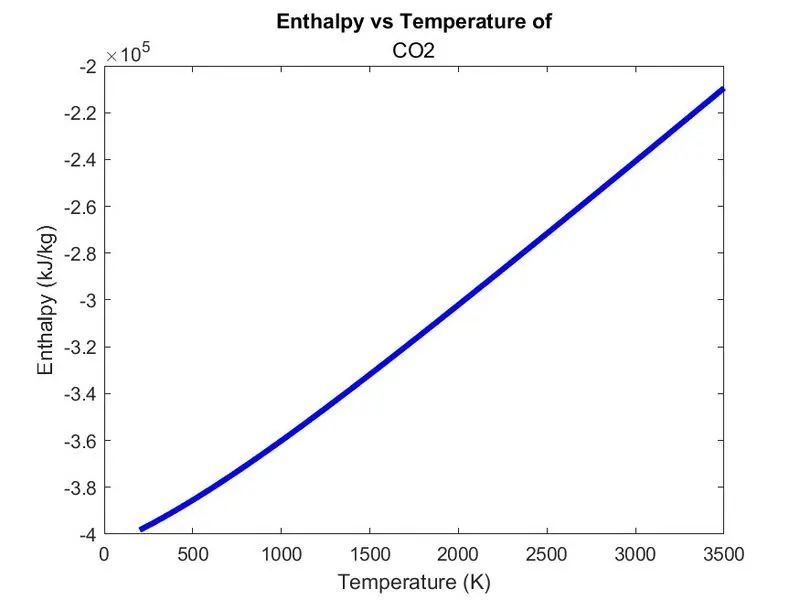
3. CO2
Variation of specific heat at constant pressure with temperature
Variation of enthalpy with temperature
Variation of entropy with temperature
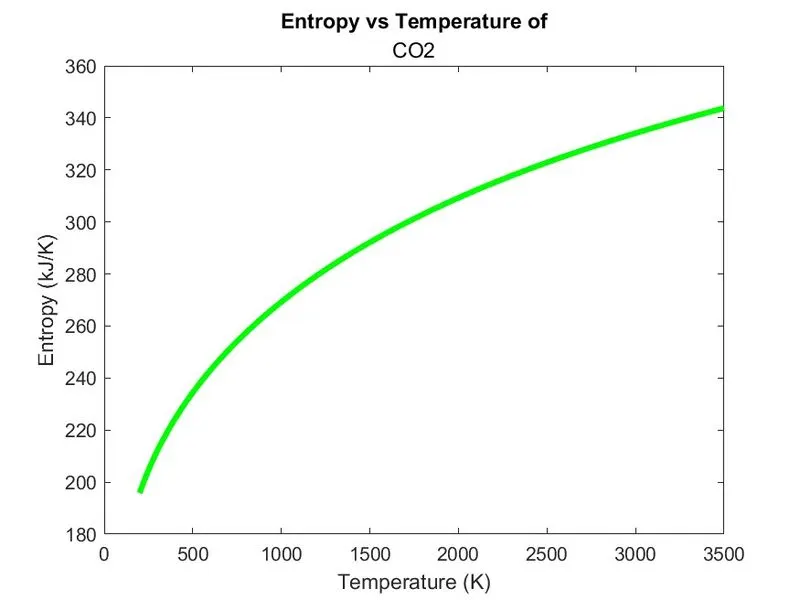
From these plot we can say that the properties like specific heat at constat pressure, enthalpy and entropy varies with temperature for O2, N2 and CO2 these properties increases with temperature i.e., they are deped on change in temperature.
The figures shown below are the molecular weight calculation output obtained from the matlab.
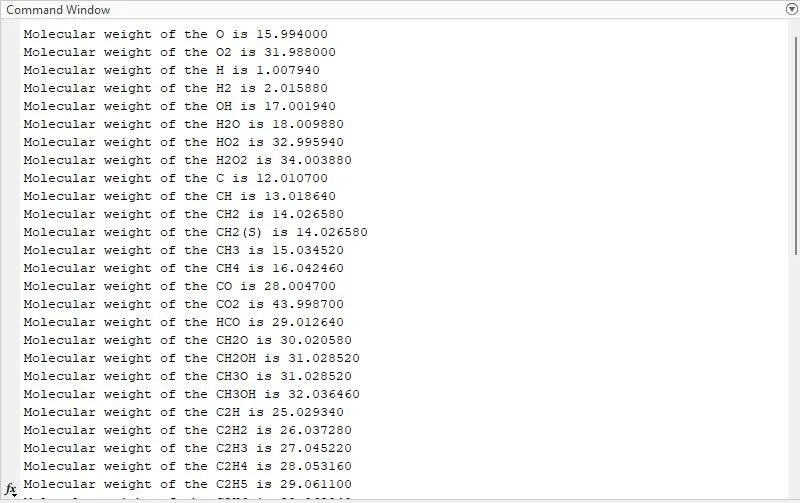
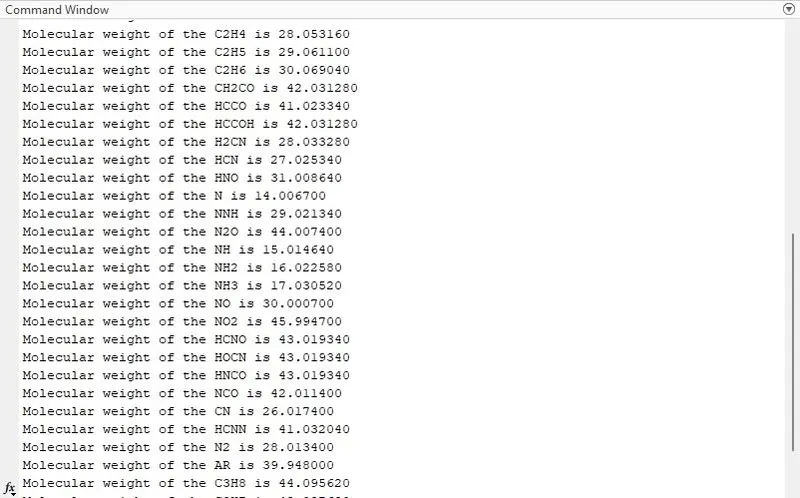
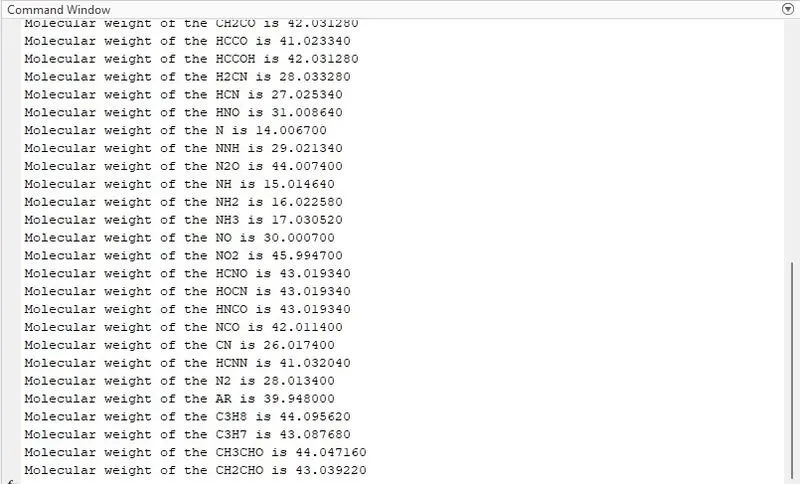
After executing the above program 53 folders representing 53 species are created the screenshot of the same is attached below:

CONCLUSION:
A Matlab program is created to evaluate the properties and molecular weight of given species by using file parsing method. The variation of these properties with temperature are also plotted and these plots are stored in separate folder for each species. The results obtained are shown above.
References
- Entropy of gas, Enthalpy of gas, Specific of gas at constant temperature, Atomic Weight , Universal gas constat by National Aeronautics and Space Administration - https://www.grc.nasa.gov/www/k-12/airplane/entropy.html#:~:text=Entropy%20of%20a%20Gas&text=Thermodynamics%20is%20a%20branch%20of,and%20understanding%20high%20speed%20flows.