# A stalagmite function generally refers to the function with which we are generating values over a stalagmite kind of surface for finding out the local and global maxima and minima of that particular given function. For this in Matlab we are using a method called 'Optimization'.
#GA repeatedly modify the valve of individual solution. At each step, GA select individual at random from the current valve (population) to the main source value and uses them to reproduce the secondary value for the next set.
x = ga(fun,nvars,A,b,Aeq,beq) finds a local minimum x to fun, subject to the linear equalities Aeq*x = beq and A*x ≤ b. (Set A=[] and b=[] if no linear inequalities exist.) ga evaluates the matrix product Aeq*x as if x is transposed (Aeq*x').
x = ga(fun,nvars,A,b,Aeq,beq,lb,ub) defines a set of lower and upper bounds on the design variables, x, so that a solution is found in the range lb ≤ x ≤ ub. (Set Aeq=[] and beq=[] if no linear equalities exist.)
Main Program :
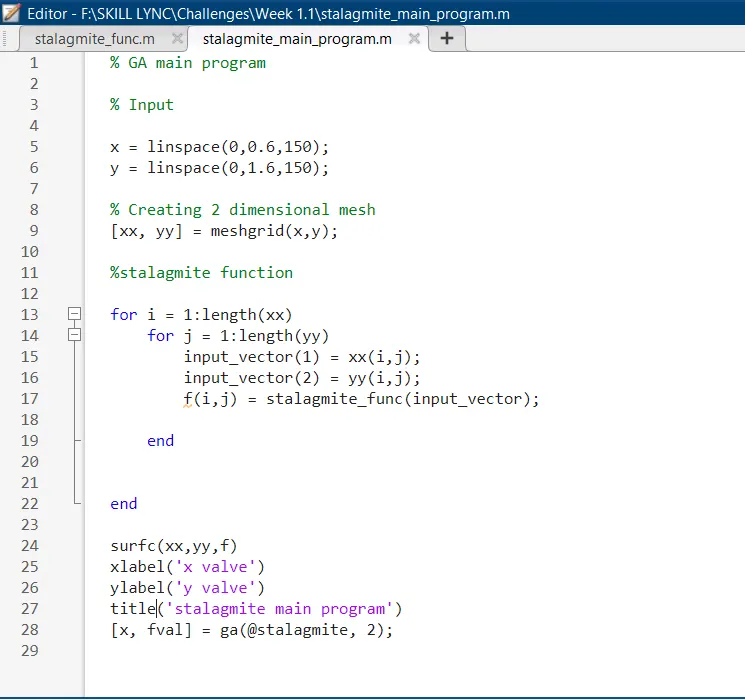
Main Program Explanation :
1. In this program we should not use the clc, clear all, close all. In function program we should not use these command because it will clear the memory of function program.
2. Line 5 & 6 are linspace command, assinging value to x and Y in the range of 0 to 0.6, 150 values.
3. Line No 9 are meshgrid command. To create 2d dimensional array.
4. Basically X and Y value are assinging by using linspace command and then 2 dimensional array are generated by using meshgrid command. For loop is used to repeated the vector formation.
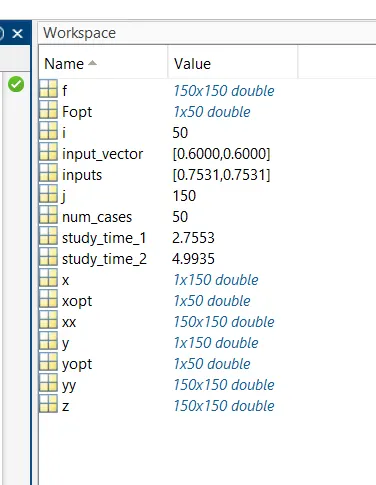
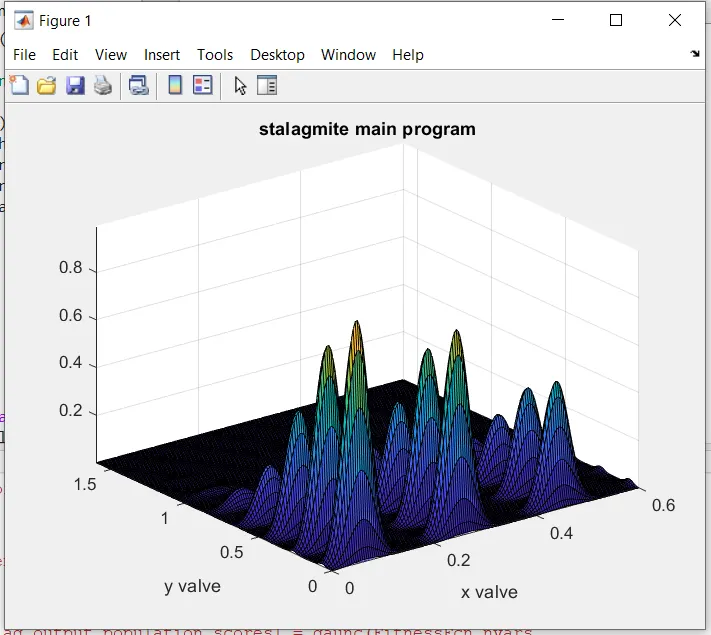
Optimized program for 2 cases :
%Defining our search space to be optimized.
%%one dimensional
x = linspace(0,0.6,150);
y = linspace(0,0.6,150);
num_cases = 50;
%creating 2dimiensional grid
[xx, yy] = meshgrid(x,y);
% evaluating the stalagmite function
for i = 1:length(xx)
for j = 1:length(yy)
input_vector(1)= xx(i,j);
input_vector(2)= yy(i,j);
f(i,j) = stalagmite_func(input_vector);
end
end
%study_1 statistical behaviour
tic
for i = 1:num_cases
[inputs,Fopt(i)] = ga(@stalagmite_func,2);
xopt(i) = inputs(1);
yopt(i) = inputs(2);
end
study_time_1 = toc;
%plotting
figure(1)
subplot(2,1,1);
hold on
surfc(xx,yy,f);
shading interp;
ylabel('Y data');
xlabel('X data');
plot3(xopt,yopt,Fopt,'marker','o','markersize',5,'markerfacecolor','y')
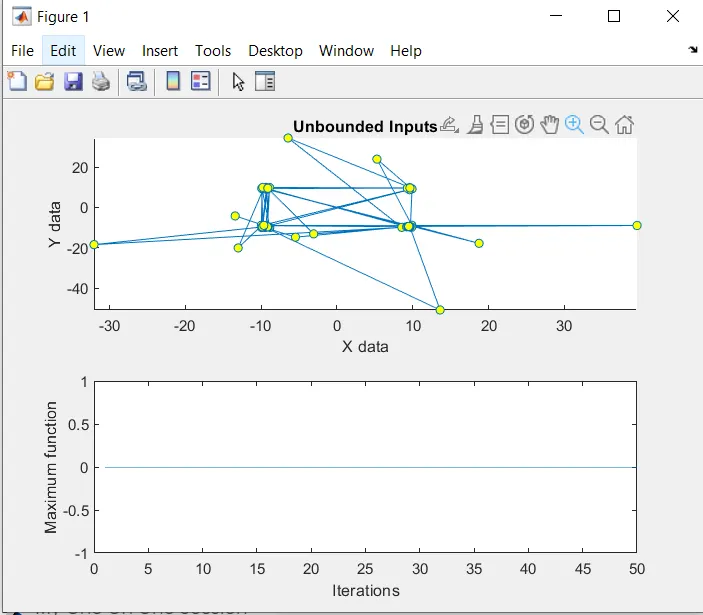
title('Unbounded Inputs')
subplot(2,1,2)
plot(Fopt)
xlabel('Iterations')
ylabel('Maximum function')
%study_2 bounding the values
tic
for i = 1:num_cases
[inputs,Fopt(i)] = ga(@stalagmite_func,2,[],[],[],[],[0;0],[1;1]);
xopt(i) = inputs(1);
yopt(i) = inputs(2);
end
study_time_2 = toc;
figure(2)
subplot(2,1,1)
hold on
surfc(xx,yy,f)
shading interp
xlabel('X data')
ylabel('Y data')
plot3(xopt,yopt,Fopt,'marker','o','markersize',5,'markerfacecolor','r');
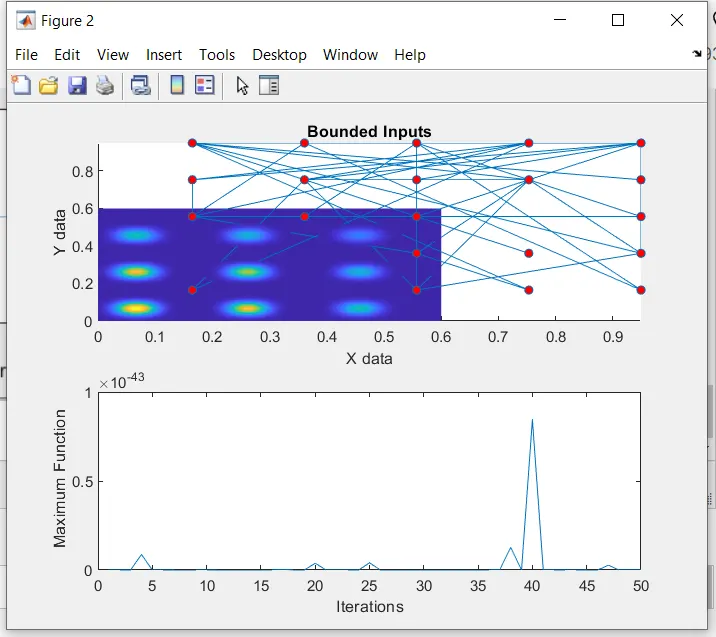
title('Bounded Inputs')
subplot(2,1,2)
plot(Fopt)
xlabel('Iterations')
ylabel(' Maximum Function')
Error Faced and overcome :
1. In some places I didnt call the variable in input.
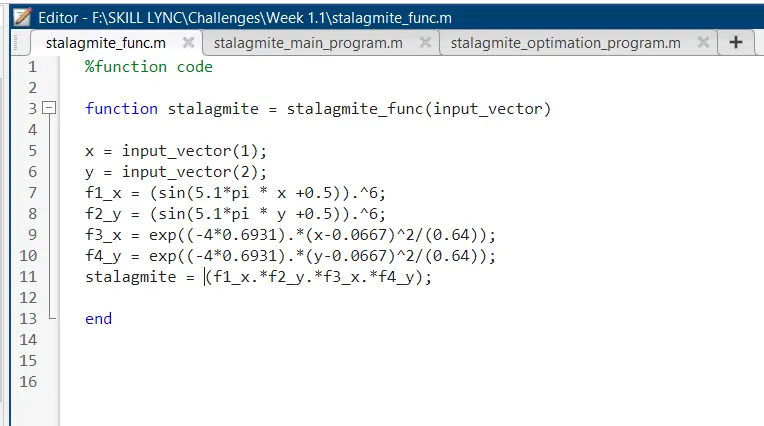
2. And function program line no 11. I made formula error "stalagmite = -(f1_x.*f2_y.*f3_x.*f4_y);" Due to this formula the entire figure get inverted.
3. Basic mistake that i had done. The main I was used the clear all, close all and clc it will create a problem while doing run command.
Refference :
Results:
1. Above result shows data from 2 cases to study the statistical behaviour. Hence optimisation of code has been proved.