Week 3 - Solving second order ODEs
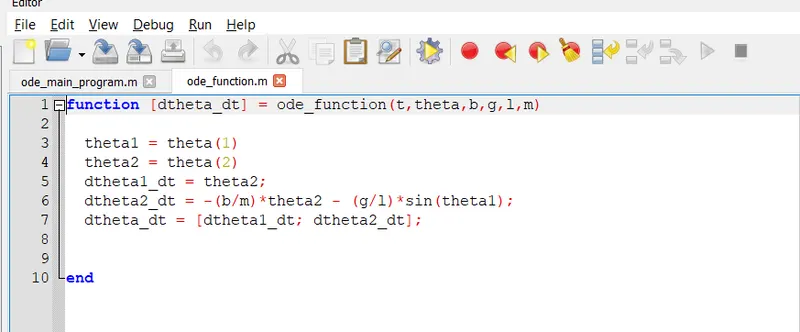
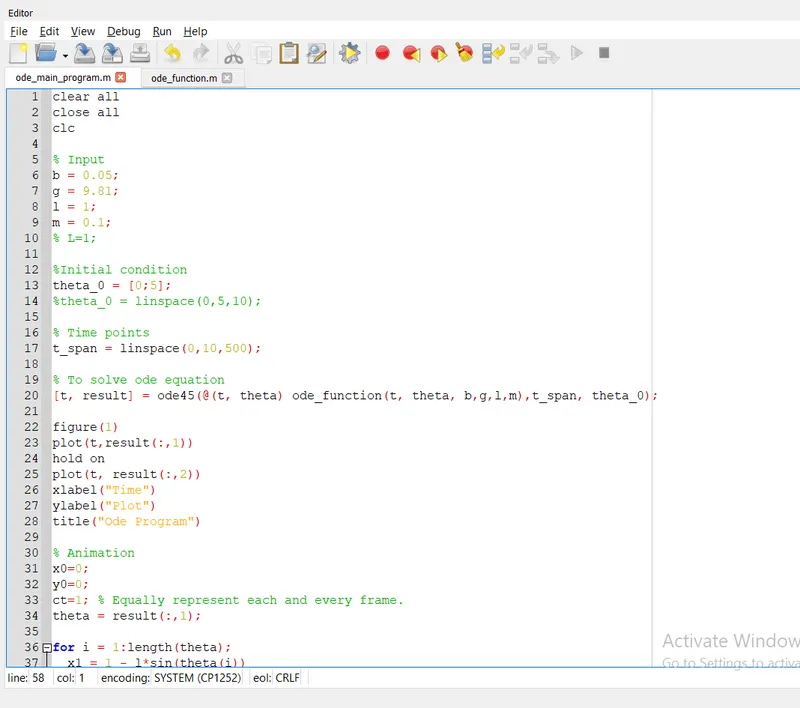
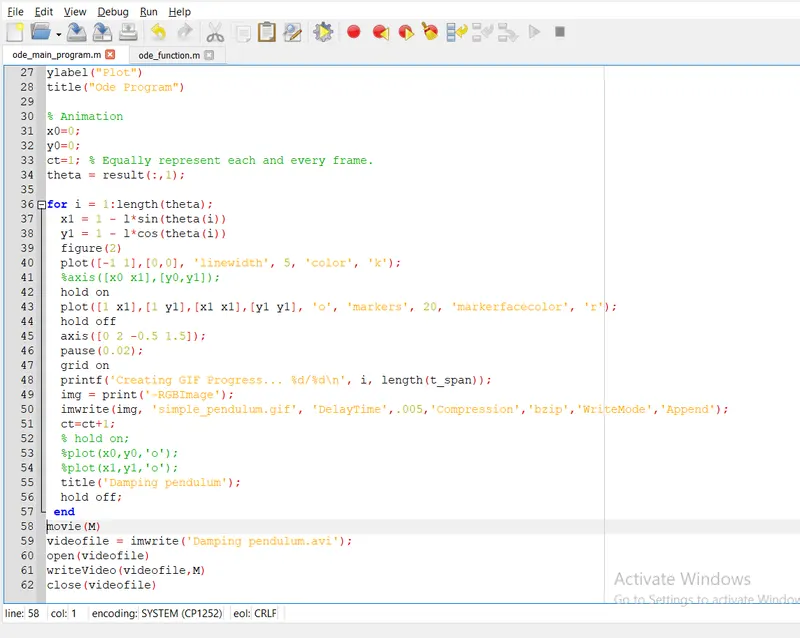
Hereby I have attached the screen shot of ode function & main program. So please find the attachment & screenshot.
First I will explain the function ode then main program. At last error faced and step to overcome those error.
Function program :
1. Line no :1 We are creating function for second order formula. As per bellow snap, second order formula for mathematical respect. So we are convecting into matlab function. If you see line no 6 excatly matching with our formula.
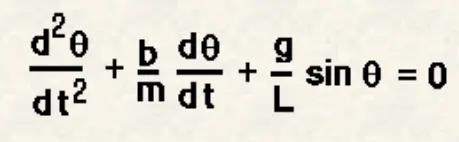
2. Line No : 5 dtheta1/dt we can also say as theta 2. This is first order formula.
3.Line No : 3 & 4 are assigning the valve to variable.
4. Line No :7 "dtheta_dt = [dtheta1_dt; dtheta2_dt];" it means we are getting result like column matrix.Due to semicolan.
5. Line No 1, it means we start the function program. The function name dtheta/dt. And ode function is default matlab syntax.And "(t,theta,b,g,l,m)" these are input. Valve will be assigned in main program. t is time, g is gravity, l is length, m is mass and b is damping coefficient.
Main program:
1. Before doing to start the program we should save the file in the same location of function program. Then only function will work.
2. Clear all, Close all and clc these to avoid error in program.
3. And then Line no 5 to 9 assigning the valve to variable.
4. Line No 13 " theta_0 = [0;3]; " its means displacement is 0 and velocity is 3 m/sec.
5. Line No 17 " t_span = linspace(0,10,500); " its means time valve will be 0 to 10 and 500 valve it will print.
6. Line No : 20 " [t, result] = ode45(@(t, theta) ode_function(t, theta, b,g,l,m),t_span, theta_0); " ode 45 means function syntax. Actually in function program we declare the these into formula. So we need to call the syntax and valve to assign.
7. Line No 22 its means plot the figure 1 . So we have two set of figure window so that only we are identify into number.
8. Line No 23, " plot(t,result(:,1) " its means plotting the graph between time and result but the valve will ne take from 1st cloumn.
9. Line No 24, " hold on " its means it will hold the two or more plot and it will how as sinlge plot figure window.
10. Line No 25, " plot(t, result(:,2)) " it also similar to Line No 23 but this time it will took the valve at 2 column.
11. Line No 26, " xlabel("Time") " It will print the x axis is Time
12. Line 27, " ylabel("Plot") " it will print the y axis is plot
13. Line No 28, " title("Ode Program") " it will as title os Ode program.
14. Line No 31 & 32 are Animation purpose intially we need to declare the some input so x0=0,y0=0
15 Line No 33 are counter frame is intially one that we need to declared.
16. Line No 34 " theta = result(:,1); " get the valve of 1st column of result and assign to theta.
17. Line No 36 is for loop function because of animation we need to have for loop function. So basicaly for loop start with for and end with " End ". For example " i = 1:length(theta); " the valve of theta having 10 number. so we can say that i having the valve 1 to 10 number it will execute one by one.
18. Line No 37 is a formula " x1 = 1 - l*sin(theta(i)) & y1 = 1 - l*cos(theta(i)) " to calculate the X1 and Y1.
19. Line 38 is figure(2). Initialy we have one plot so another we need to plot means we have to go for figure window 2.
20. Line No 40 is " plot([-1 1],[0,0], 'linewidth', 5, 'color', 'k'); " ;plotting line [x1 y1],[x2 y2]. And plot line will thicker as 5.
21. Line No 42 is hold on command. It means we may have more two plot we need to stict on single plot means we have to use hold on command.
22. Line No 43 is also similar to previous one and "o" marker its going to be act as ball in pendulam. That sizes are 20 and red in color.
23. Line No :44 hold off command its means off the all plot
24. Line No :45 " axis([0 2 -0.5 1.5]); " we are giving the valve for axis it will show in plot
25. Line No 46 " pause(0.02); " this command will pause the plot for while like 0.02 sec.
26. Line No 48 to 51 these command for animating purpose line no 48 we are going to print the valve and assigning the valve.
27. Line No 50 ct + 1 it will increament one by one value.
28. Line No : 55 is giving title to plot.
29. Line No 58 to 61 are saving the file as vedio formate. Line No 58 are movie command. After that imwrite command for octave to make annimation. Next we will save the file open the file and then close the file.
So here are explanation for simple pendulam using for loop.
Error faced and overcome :
1. Initial I made formula mistake so plot are running horizontal.Bellow snap are for refference.
for 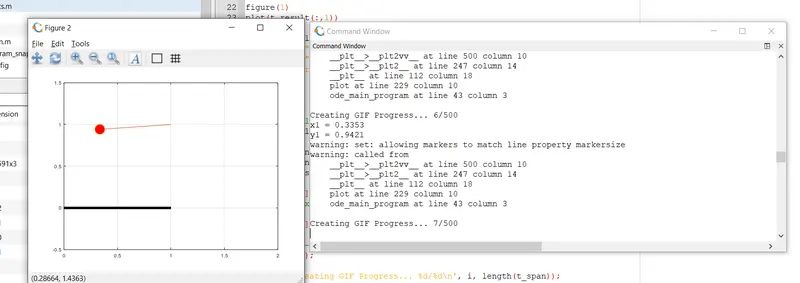
2. And Line no 41 I made mistake of axis value. Because axis need to use later stage but I used previuos stage so that i get errro meassage.

3. Line No : 52 to 54 that aslo i made error. I am trying to animate the pendulam. Instead wirting these two line I am using the " plot([1 x1],[1 y1],[x1 x1],[y1 y1], 'o', 'markers', 20, 'markerfacecolor', 'r');" line no 43.
4. Line No : 56 I forgot to add this comments due to that I am get the error message in plot area. But result will come. Anyway if we use hold on means we need to use hold off command also.
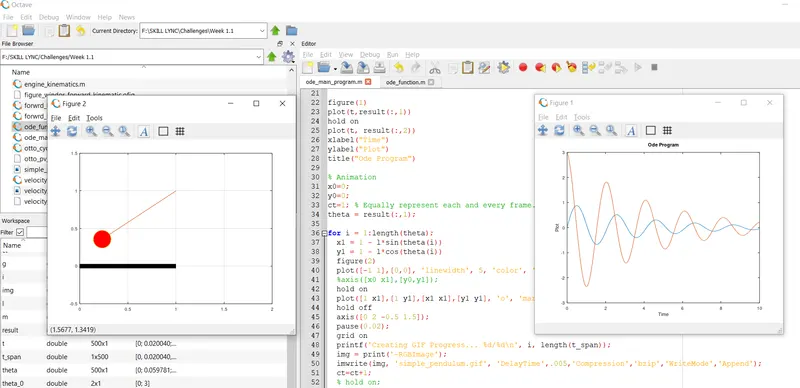
5. So bellow I am adding figure window and animation snap shot. So please find the attachment.