%PROGRAM PROJECT 1, PARSING NASA THERMODYNAMIC DATA
%clear all
close all
clc
%Input
R=8.314; % Gas Constant
%Reading data file
%open file and reading THERMO.dat file
f1 = fopen('THERMO.dat','r');
get = fgetl(f1);
% Now Reading Temperature from this file
temp = fgetl(f1);
%spliting
s = strsplit(temp);
% converting strings cells into numbers
templow = str2num(s{2});
tempmid = str2num(s{3});
temphigh =str2num(s{4});
% Temperature Range
T = linspace(templow, temphigh, 1000) ;
%Skipping comment lines
for i=1:3
get=fgetl(f1);
end
% Reading the Species
for j=1:53
tline=fgetl(f1);
A=strsplit(tline,' '); % spliting into cell array
species = (A{1}); % To read the name of the species
% Converting string to number
lowtemp = str2num(A{end-3});
midtemp = str2num(A{end-2});
hightemp = str2num(A{end-1});
tlinel = fgetl(f1); % getting next line
a = strfind(tlinel,'E'); % Finding the string E
% Finding First 7 higher and second 7 lower
%Finding Higher coefficients
a1 = tlinel(1:a(1)+3);
a1 = str2num(a1);
a2 = tlinel(a(1)+4:a(2)+3);
a2 = str2num(a2);
a3 = tlinel(a(2)+4:a(3)+3);
a3 = str2num(a3);
a4 = tlinel(a(3)+4:a(4)+3);
a4 = str2num(a4);
a5 = tlinel(a(4)+4:a(5)+3);
a5 = str2num(a5);
tline2 = fgetl(f1);
b = strfind(tline2,'E');
a6 = tline2(1:b(1)+3);
a6 = str2num(a6);
a7 = tline2(b(1)+4:b(2)+3);
a7 = str2num(a7);
% Finding Lower coefficients
a8 = tline2(b(2)+4:b(3)+3);
a8 = str2num(a8);
a9 = tline2(b(3)+4:b(4)+3);
a9 = str2num(a9);
a10 = tline2(b(4)+4:b(5)+3);
a10 = str2num(a10);
tline3 = fgetl(f1);
c = strfind(tline3,'E');
a11 = tline3(1:c(1)+3);
all = str2num(a11);
a12 = tline3(c(1)+4:c(2)+3);
a12 = str2num(a12);
a13 = tline3(c(2)+4:c(3)+3);
al3 = str2num(a13);
a14 = tline3(c(3)+4:c(4)+3);
a14 = str2num(a14);
fprintf('%s',species);
% calculate specific heat
Cp = specific_heat(a1,a2,a3,a4,a5,a8,a9,a10,a11,a12,T,R,tempmid);
% calculate Entropy
S = entropy(a1,a2,a3,a4,a5,a7,a8,a9,a10,a11,a12,a14,T,R,tempmid);
% calculate Enthalpy
H = enthalpy(a1,a2,a3,a4,a5,a6,a8,a9,a10,a11,a12,a13,T,R,tempmid);
% Calculate Molecular weight of the Species
wt = Molecular_weight(species);
% writing molecular weight file
cd('F:\SKILL LYNC\Challenges\Week 1.1');
MW_file = fopen('Molecular Weight.txt','w');
fprintf(MW_file, 'Molecular weight of %s is %d ',species,W);
fclose(MW_file); % Closing the file
%Plotting Cp, H and S with Temperature
% Saving in a folder
cd('F:\SKILL LYNC\Challenges\Week 1.1\species') % changing directory
mkdir(species); %creating directory
cd(species);
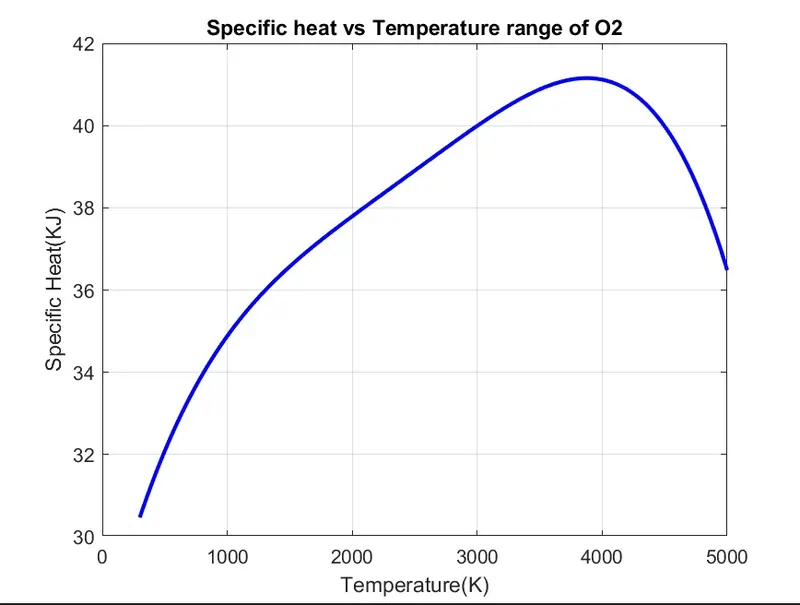
% Plot 1 Cp vs T
figure(1)
plot(T,Cp, 'linewidth',2,'color','b');
xlabel('Temperature(K)');
ylabel('Specific Heat(KJ)');
title(sprintf('Specific heat vs Temperature range of %s',species));
grid on
saveas(figure(1), 'Specific Heat.jpg');
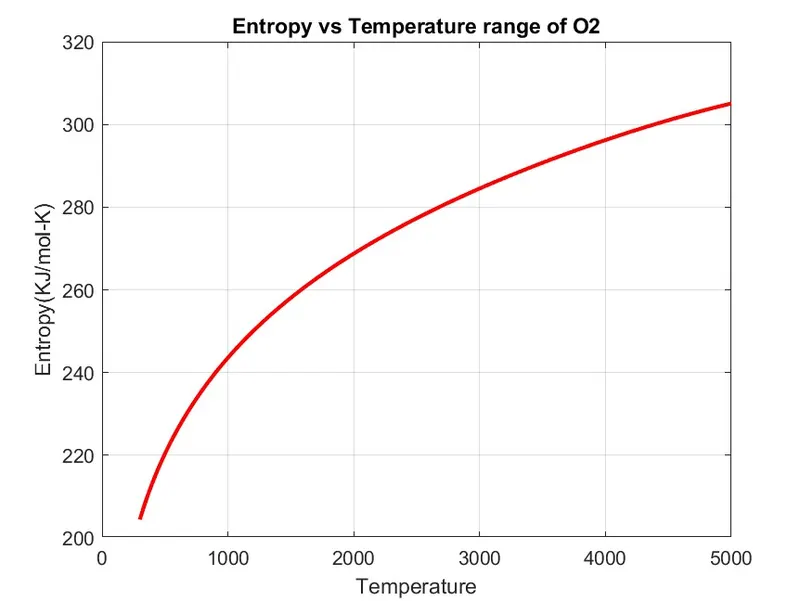
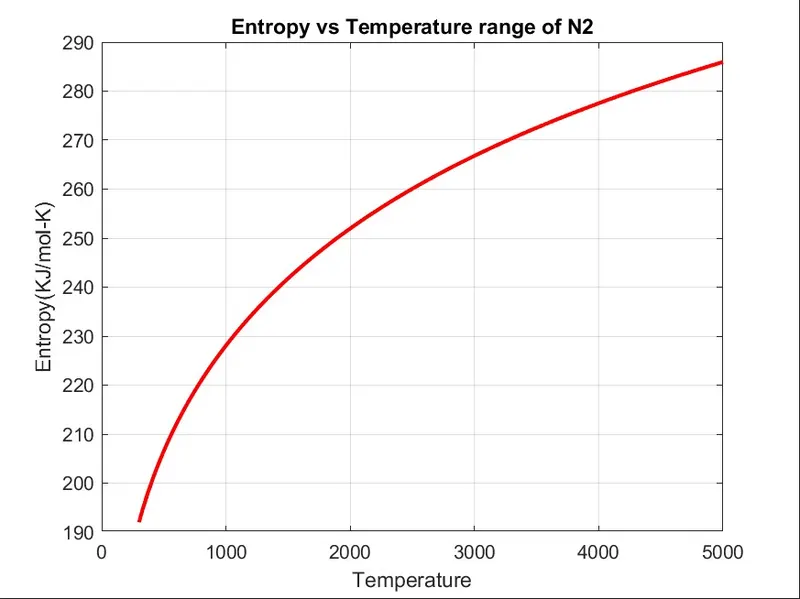
% Plot 2 S vs T
figure(2)
plot(T,S, 'linewidth',2,'color','r');
xlabel('Temperature');
ylabel('Entropy(KJ/mol-K)');
title(sprintf('Entropy vs Temperature range of %s',species));
grid on
saveas(figure(2), 'Entropy.jpg');
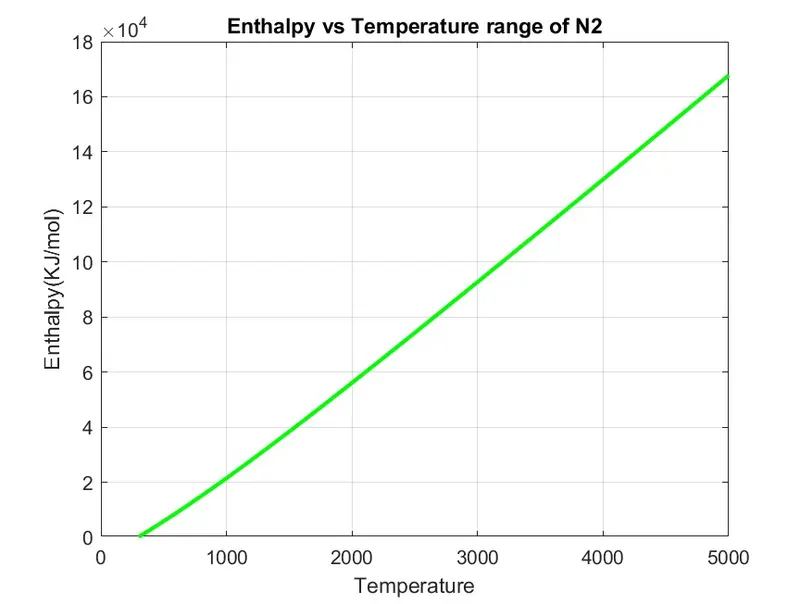
% Plot 3 Cp vs T
figure(3)
plot(T,H, 'linewidth',2,'color','g');
xlabel('Temperature');
ylabel('Enthalpy(KJ/mol)');
title(sprintf('Enthalpy vs Temperature range of %s',species));
grid on
saveas(figure(3), 'Enthalpy.jpg');
cd('F:\SKILL LYNC\Challenges\Week 1.1') %Changing directory to C
% Molecular weight
%W = Molecular_weight(species);
end
\\\\\\\\\\\\\\\\\\\\\\\\\\\\\\\\\\\\\\\\\\\\\\\\\\\\\\\\\\\\\\\\\\\\\\\\\\\\\\\\\\\\\\\\\\\\\\
STEP by STEP EXPLANATION :
1. Thermo.dat file is already given for this project. Before going to get data from it we have to do read and open the data first. By using fopen & fgetl command.
2. Then, we will spilt the temperature data using strsplit convert into cell array. Then will convert this string to number using str2num. To find the low, Mid & high temperature.
3. Then we assign temperature valve by using linspace command. And we will skip first 3 line then we will run loop by using fgetl command.
4. Now, we will run the loop 53 times to find the element in the data file by assigning fgetl command and then spliting into the cell array to find the species line and then find the species name and then find the number of the temperatures in the species line.
5. We will first find the 'E' string using strfind command to find before and after numbers of the coefficients then we will find remaining 14 coefficients and convert them to numbers from strings by using str2num.
6. Out of 14 co efficient , first 7 coefficient are Higher Temperature and remaining lower 7 cofficient are lower temperature.
7. Now we will mention Specific heat Cp, Entropy S, Enthalpy H functions to find these parameters using these 14 coefficients for Lower and higher Temperature. then we will specify molecular weight W function to find the Molecular weight of the different species.
8. Then we will write the Molecular weight.txt file and fprintf all the molecular weights of the species.
9. And then close the txt file using fclose command.
10. Now we change the directory using cd command and then creating directory folder where we have to save our files using mkdir command and then we will change the directory to this created folder.
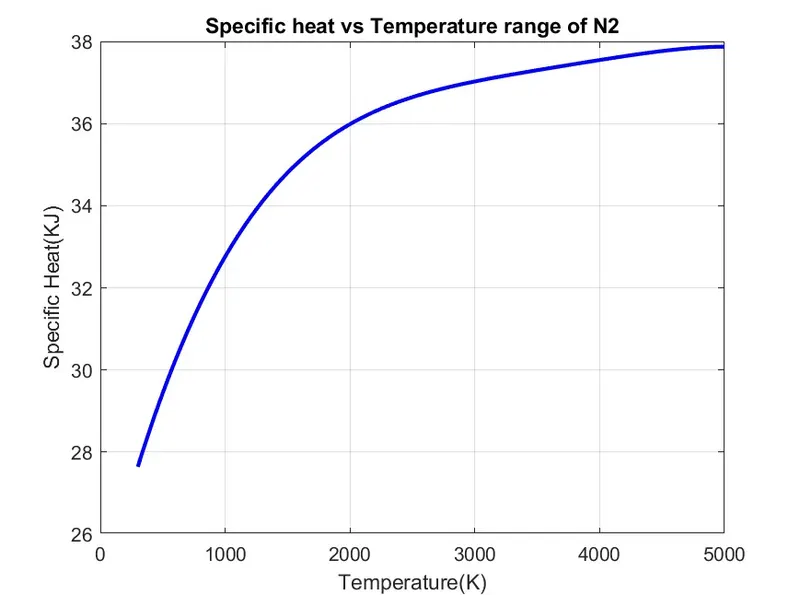
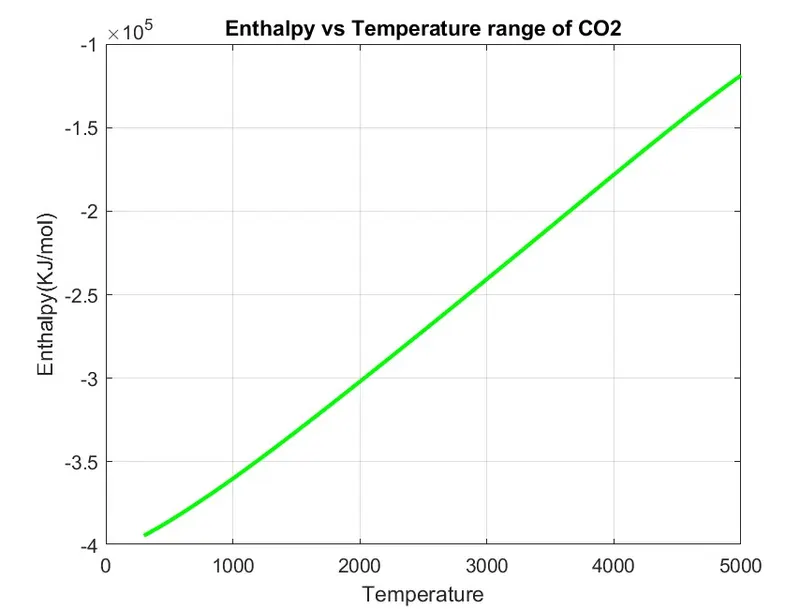
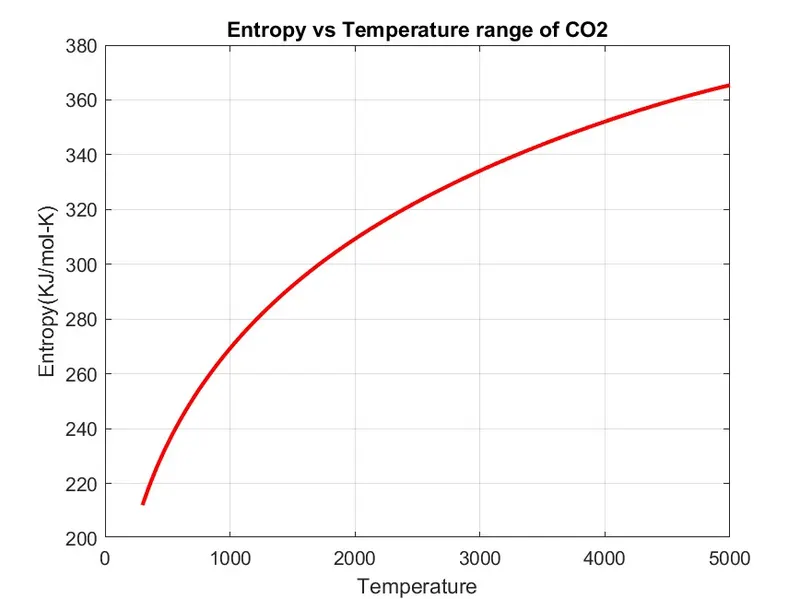
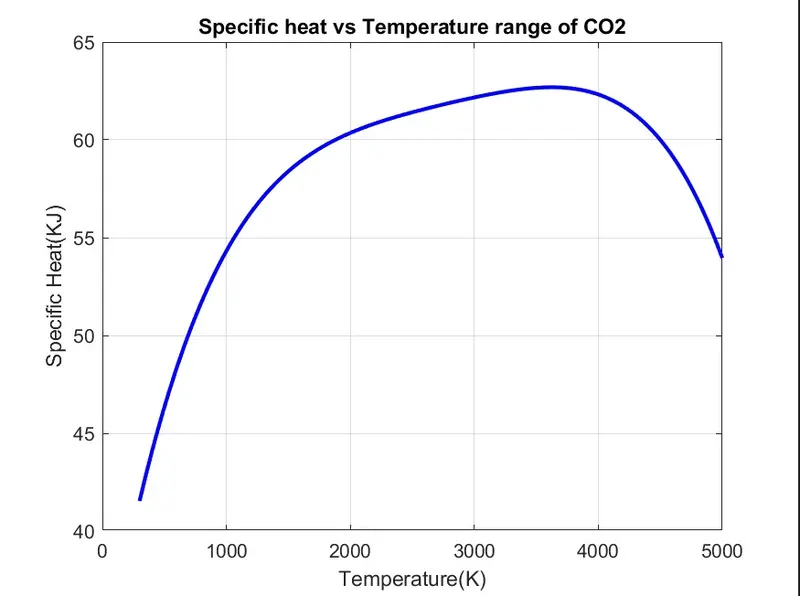
11. Finally, we will plot Specific heat, Entropy and Enthalpy with the Temperature for different species. We we will use scanf command to in the title command.
12. Last step we will saveas command to save the plot of different species.
Function to find Specific Heat :
function Cp = specific_heat(a1, a2, a3, a4, a5, a8, a9, a10, a11, a12,T, R, tempmid)
% calculating specific heat % calculating specific heat for higher and lower temperature repectively
if (T <= tempmid)
Cp = R*(a8 + (a9*T) + (a10* (T).^2) + (a11*(T).^3) + (a12*(T).^4));
else
Cp = R*(a1 + (a2*T) + (a3*(T).^2) + (a4*(T).^3) + (a5*(T).^4));
end
end
STEPS :-
1. To find the Specific heat by creating Specific heat function and assigning the formula coefficent from 14 coefficients, Gas constant, Temperature and mid temperature.
2. Then we will creatre an condition using if loop and make the temperature less than and equal to mid temperature to specify lower temperature coefficent in the formula.
3. Then we will use else condition to specify coefficient of Higher temperature coefficent in the formula.
4. Then end the loop and function to calculate Specific Heat.
Function to find Entropy:
function S = entropy(a1, a2, a3, a4, a5, a7, a8, a9, a10, a11, a12, a14,T, R, tempmid)
% calculating entropy % calculating entropy for higher and lower temperature repectively.
if (T <= tempmid)
S = R*(a8.*log(T) + (a9*T) + ((a1e*(T).^2)/2) + ((a11*(T).^3)/3) + ((a12*(T).^4)/4) + a14);
else
S = R*(a1.*log(T) + (a2*T) + ((a3*(T).^2)/2) + ((a4*(T).^3)/3) + ((a5*(T).^4)/4) + a7);
end
end
STEP :
1. First to find the Entropy by Entropy function and same as above to assigning its relted formula coefficent from 14 coefficients, Gas constant, Temperature and mid temperature.
2. Then we will creatre an condition using if loop and make the temperature less than and equal to mid temperature to specify lower temperature coefficent in the formula.
3. Again we will use else condition to specify coefficient of Higher temperature coefficent in the formula.
4. Finnally end the loop and function to calculate Entropy.
Function to find Enthalpy:
function H = enthalpy (a1, a2, a3, a4, a5, a6, a8, a9, a10, a11, a12, a13,T, R, tempmid)
% calculating enthalpy % calculating enthalpy for higher and lower temperature repectively.
if (T <= tempmid)
H = R*T.*(a8 + ((a9*T)/2) + ((a10* (T).^2)/3) + ((a11*(T).^3)/4) + ((a12*(T).^4)/5) + ((a13./T)));
else
H = R*T.*(a1 + ((a2*T)/2) + ((a3*(T).^2)/3) + ((a4*(T).^3)/4) + ((a5*(T).^4)/5) + ((a6./T)));
end
end
STEP :
1. First we will find the Enthalpy by creating Enthalpy function and same as above assigning its relted formula coefficent from 14 coefficients, Gas constant, Temperature and mid temperature.
2. Then we will creatre an condition using if loop and make the temperature less than and equal to mid temperature to specify lower temperature coefficent in the formula.
3. Again we will use else condition to specify coefficient of Higher temperature coefficent in the formula.
4. Finnaly end the loop and function to calculate Enthalpy.
Defining Atomic masses of main species
atomic_weight = [1.008 12.011 15.999 14.007 39.948];
wt=0; % Molecular weight starting range
for i=1:length(species) % Loop runs to the length of the species
for j=1:length(atomic_name) % Loop runs to the length of the atomic name
if strcmp(species(i), atomic_name(j)) %function to compare 2 strings
wt = wt + atomic_weight(j);
position = j;
end
end
n = str2num(species); % Now we will find if there is more element
if n>1
wt = wt + atomic_weight(position)*(n-1);
end
end
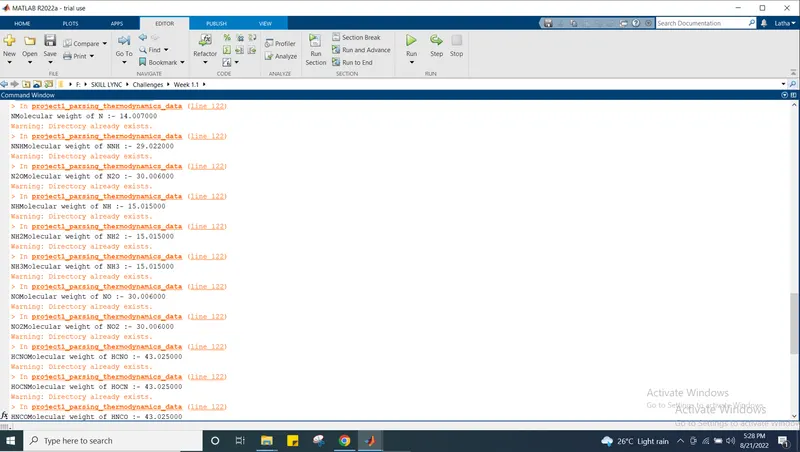
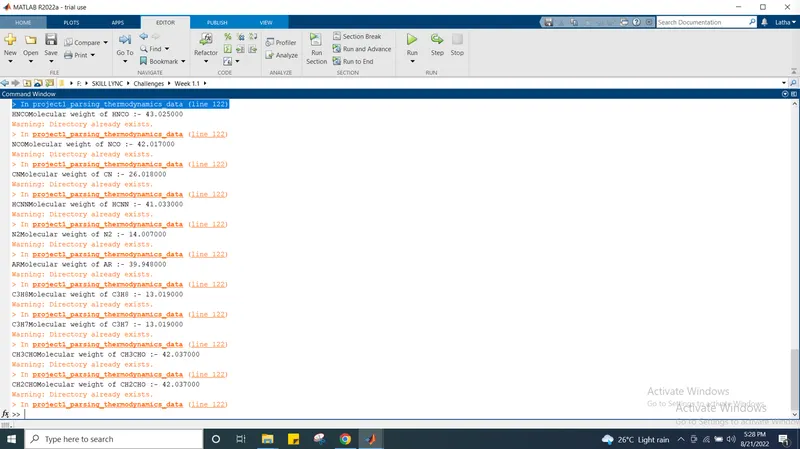
fprintf('Molecular weight of %s :- ', species);
fprintf('%f',wt);
disp(' ')
end
STEPS :
1. First we will create an Molecular weight function wt and assigning species input to that.
2. Then define the main element of all 53 species in an array atomic_name that are :- 'H','C','O','N','Ar'.
3. Then by taking above main elements we will create there atomic_wieght array that are : 1.008 12.011 15.999 14.007 39.948.
4. Then we will assign molecular starting range wt = 0. To zero and then create an for loop condition which runs to the length of the species and an another nested for loop is created which runs to the length of the string atomic_name.
5. Then we will create an condition using if condition and use strcmp command to compare the species and atomic_name strings to calculate molecular masses if by comparison both string found same then we will assign its molecular weight.
6. Now, we will string to the number using str2num command assign to n. Then we run an condition of if loop to find weather the species contains more than one element if there are more then 1 elements that is n>1 then we will increment the atomic weight by the multiplication of position and n-1 to the atomic_weight array.
7. Finnaly, we will print the Molecular weight using fprintf command and display using disp command.
ERRORS :
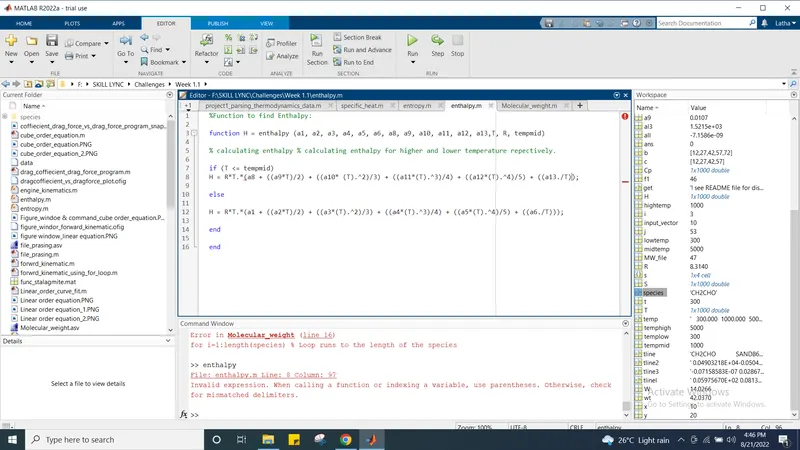
Bellow errror I faced due to close parenthesis is missed in function program.
After assigning the parenthesis its resolved.
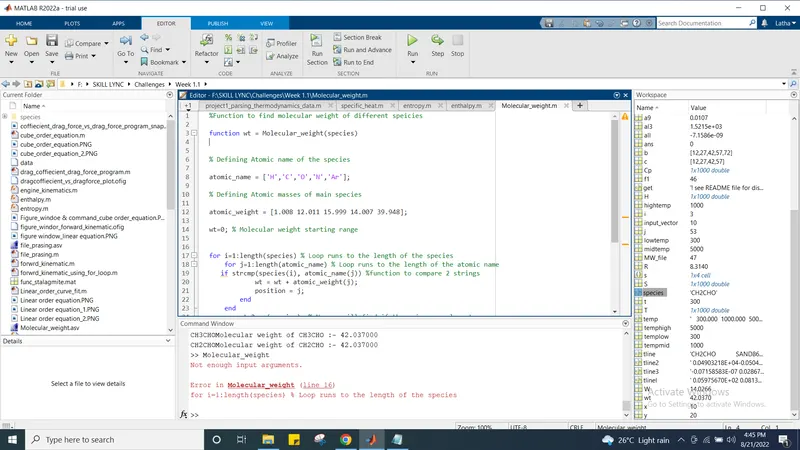
Bellow error i faced due to the for loop misalginment. After aglining the loop segment its disappear the error.
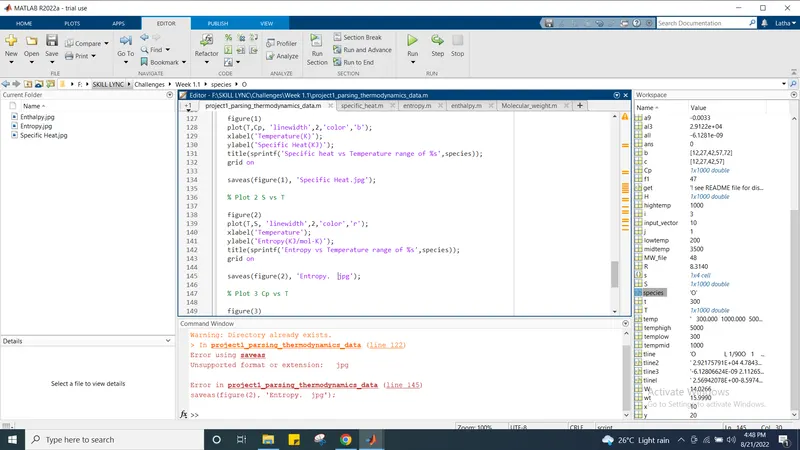
Bellow error was happened due to unwanted space in .jpg file formate. After removing space its ressolved .
FINAL RESULT :
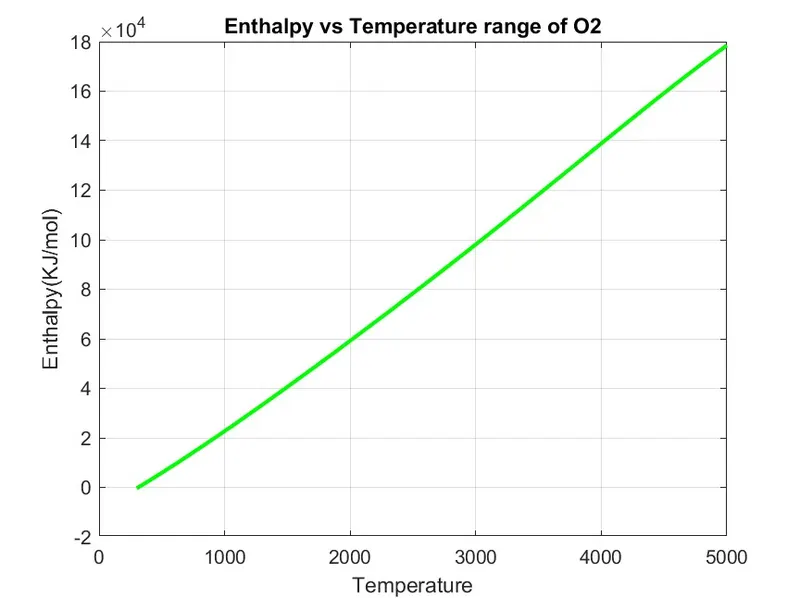
PLOT :
PLOT OF O2 SPECIES :
PLOT OF N2 SPECIES :
PLOT OF CO2 SPECIES :
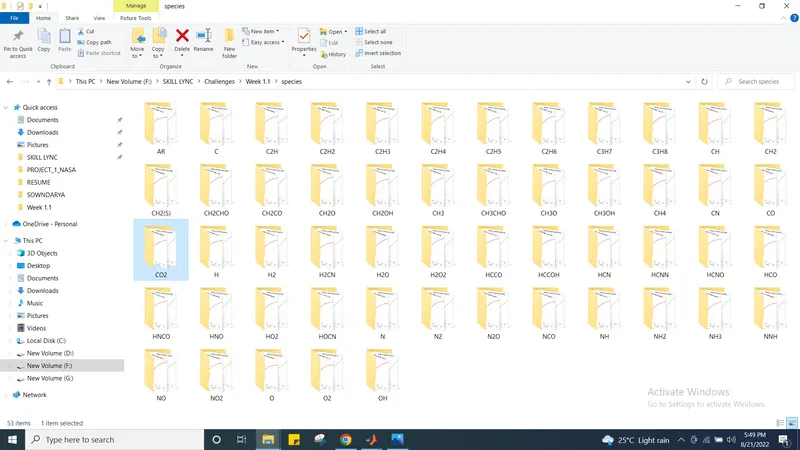
SCREEN SHOT OF DIFFERENT SPECIES SAVED IN FOLDER :
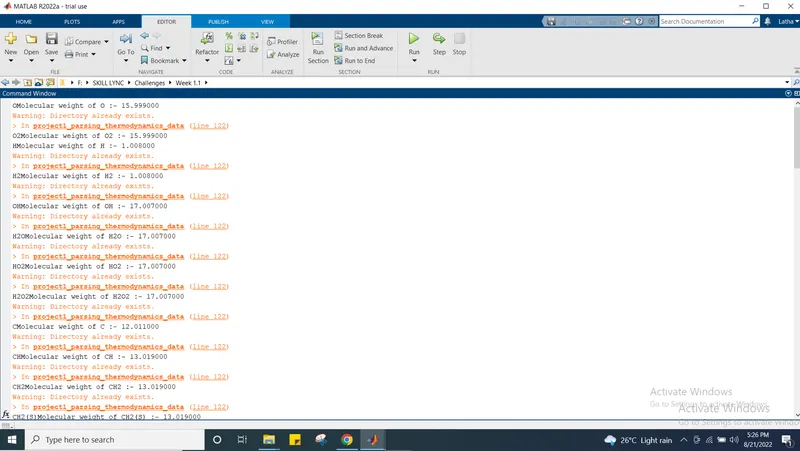
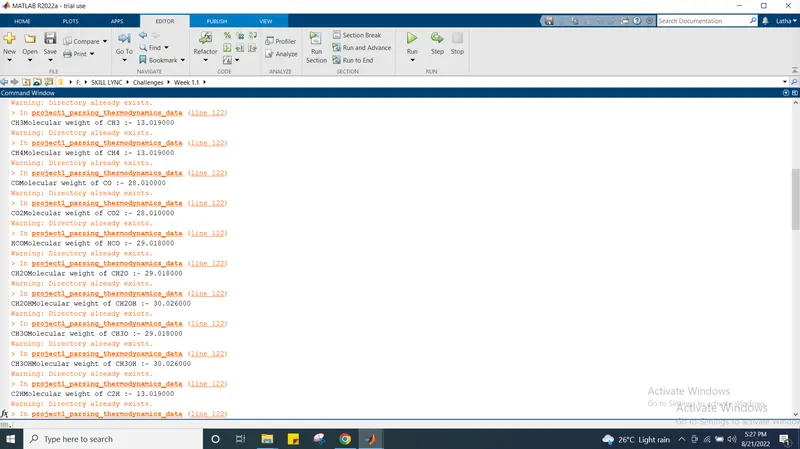
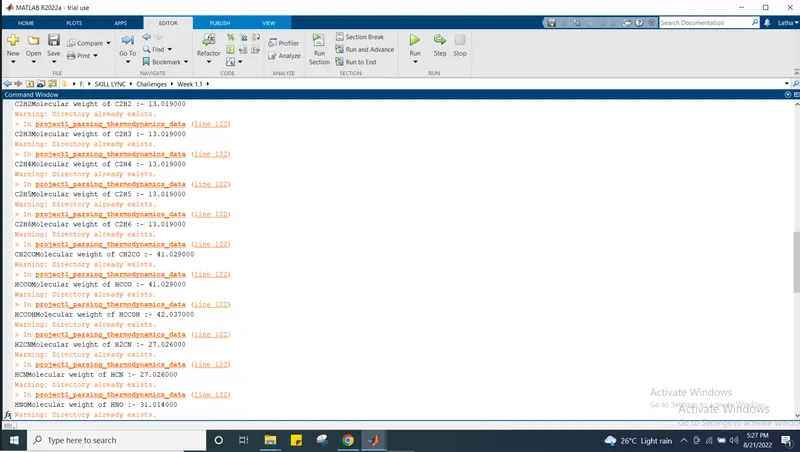
MOLECULAR WEIGHT OF DIFFERENT SPECIES :
DRIVE LINK :