Week 4.1 - Genetic Algorithm
Aim
- To explain the concept of Genetic Algorithm and the syntax for the ga in the MATLAB.
- To write a code to optimize the stalagmite function and find the global maxima of the function. Also plot the graphs for all three studies and for Function maximum value vs number of iteration.
Governing Equations:
The below equations are used to write the code for the stalagmite function:
`f(x,y)=f1x*f2x*f1y*f2y`
where,
`f1x=(sin(5.1πx+0.5) )^6`
`f1y=(sin(5.1πy+0.5) )^6`
`f2x=exp[-4 ln(2)*(x-0.0667)^2/0.64]`
`f2y=exp[-4 ln(2)*(y-0.0667)^2/0.64]`
Theory
A Genetic algorithm is a method in MATLAB used for solving both constrained and unconstrained optimization problem based on the natural selection process that used in biological evolution. The algorithm repeatedly modifies a population of individual solutions. The genetic algorithm randomly selects individuals from the current population and uses them as parents to produce the children for the next generation. Over successive generations, the population evolves toward an optimal solution.
The Genetic Algorithm can be applied to solve problem that are not suited for standard optimization algorithm, including the problems in which the objective function is discontinuous, nondifferentiable, stochastic or highly non-linear.
The genetic algorithm is applied using the following steps:
- Initialization of population: In this step, we are defining the size of the population which is going to evaluate the fitness of the members of the population which are going to the next generation based on the number of iterations.
Fitness function is used to optimize the fitness value of the members with the help of the number of the generations which have been formed by code. The fitness values are used to evolve the next generation.
- Selection: The selection process is based on the fitness of the individual in the generation and forward their characteristics or genus to the next generation and the same process is followed till the fittest is not find or the number of iterations not completed. This process is inspired by the natural phenomena of the survival for the fittest.
It should be balanced between the exploration and the exploitation of search space. The genetic algorithm tries to move the characteristics to the higher fitness in the search space.
The strong fitness selection bias can lead to sub-optimal solutions and too little fitness selection bias results unfocused search.
- Reproduction: Generally, the reproduction is based on the two parents selected from the generation based on their fitness and a new individual is generated in the next generation having their parent’s characteristics and improved from the old generation. The reproduction is done by two ways
- Cross over
- Mutation
- Cross over: It is the most significant stage in genetic algorithm. In the cross over the random points are selected while mating the parents to generate new baby.
There are three major types of cross over
- Single point crossover: In this a single point is picked from the parents and designed a crossover.
- Two-point crossover: In this, two points are selected from parents to designed a crossover.
- Uniform crossover: In this crossover, each point is selected from either parent with equal probability.
- Mutation: In the mutation, some of the points or characteristics are build due to the diversity or the environments. This indicates the random evolution based on the surroundings.
Syntax of ga in MATLAB
There are some types of syntax used to genetic algorithm, which are as following:
- x= ga(fun,nvars): It finds a local unconstrained minimum, x, to the objective function, fun. nvars is the dimension (number of design variables) of
- x= ga(fun,nvars,A,b) finds a local minimum x to fun, subject to the linear inequalities A*x ≤ b. ga evaluates the matrix product A*x as if x is transposed (A*x').
- x= ga(fun,nvars,A,b,Aeq,beq) finds a local minimum x to fun, subject to the linear equalities Aeq*x = beq and A*x ≤ b. (Set A=[] and b=[] if no linear inequalities exist.) ga evaluates the matrix product Aeq*x as if x is transposed (Aeq*x').
- x= ga(fun,nvars,A,b,Aeq,beq,lb,ub) defines a set of lower and upper bounds on the design variables, x, so that a solution is found in the range lb ≤ x ≤ ub. (Set Aeq = [] and beq = [] if no linear equalities exist.)
- x= ga(fun,nvars,A,b,Aeq,beq,lb,ub,nonlcon) subjects the minimization to the constraints defined in nonlcon. The function nonlcon accepts x and returns vectors C and Ceq, representing the nonlinear inequalities and equalities respectively. ga minimizes the fun such that C(x) ≤ 0 and Ceq(x) = 0. (Set lb = [] and ub = [] if no bounds exist.)
- x= ga(fun,nvars,A,b,Aeq,beq,lb,ub,nonlcon,options) minimizes with the default optimization parameters replaced by values in options. (Set nonlcon = [] if no nonlinear constraints exist.) Create options using optimoptions.
- x= ga(fun,nvars,A,b,Aeq,beq,lb,ub,nonlcon,intcon) or x = ga(fun,nvars,A,b,Aeq,beq,lb,ub,nonlcon,intcon,options) requires that the variables listed in intcon take integer values.
- x= ga(problem) finds the minimum for problem, a structure described in problem.
- [x,fval] = ga(___), for any previous input arguments, also returns fval, the value of the fitness function at x.
- [x,fval,exitflag,output] = ga(___)also returns exitflag, an integer identifying the reason the algorithm terminated, and output, a structure that contains output from each generation and other information about the performance of the algorithm.
- [x,fval,exitflag,output,population,scores] = ga(___)also returns a matrix population, whose rows are the final population, and a vector scores, the scores of the final population.
The all above are the syntax of the Genetic Algorithm used for different conditions which are mentioned above and the below table shows the below table shows the variables used in the syntax of the Genetic Algorithm.
|
Fun |
Objective function |
|
Nvars |
Number of design variables |
|
A |
A matrix for linear inequality constraints |
|
B |
b vector for linear inequality constraints |
|
Aeq |
Aeq matrix for linear equality constraints |
|
Beq |
beq vector for linear equality constraints |
|
Lb |
Lower bound on x |
|
Ub |
Upper bound on x |
|
Nonlcon |
Nonlinear constraint function |
|
Solver |
'ga' |
|
Fval |
Value of the fitness function |
|
Options |
Options created using optimoptions or exported from the Optimization app |
Code for the stalagmite function:
function f = stalagmite(input_vector)
x=input_vector(1);
y=input_vector(2);

f1x = sin(5.1*pi*x + 0.5).^6;
f1y = sin(5.1*pi*y + 0.5).^6;
a1 = ((x-0.0667).^2)/(0.64);
f2x = exp(-4.*log(2)*a1);
a2 = ((y-0.0667).^2)/(0.64);
f2y = exp(-4.*log(2)*a2);
f = -(f1x.*f2x.*f1y.*f2y);
end
The above code is the used as the stalagmite function used to perform genetic algorithm. The above code is developed by using the governing equations written above in the report.
Main program
The following steps are followed in the code for executing the genetic algorithm for the study of the evolution of a set of population:
- Firstly, creating a search space by defining the x and y variable and creating a meshby using the meshgrid command.
- Defining the number of iterations by num_case command to iterate the value of the optimum values of the function.
- Now, calculating the value of the fitness function at each point of the mesh grid by the use of for loop and the stalagmite function.
- Creating the surface plot by using the surfc command and also show the maxima of the function by using the f with negative sign on the surface plot.
- After this the statistical is started with the no boundation condition in first study
- The next two statistical studies also have boundation and the increased population condition respectively in study 2 and study 3.
Code for the main function:
close all
clear all
clc

% search space
x=linspace(0,0.8,150);
y=linspace(0,0.8,150);

%2D mesh
[xx yy] = meshgrid(x,y);
num_case=60;

% exicutating the stalagmite function
for i=1:length(xx);
    for j = 1:length(yy);
        input_vector(1)=xx(i,j);
        input_vector(2)=yy(i,j);

        f(i,j) = stalagmite(input_vector);
    end
end
 figure(1)

 %generating the surface plot
s
urfc(xx,yy,-f);

shading interp

[inputs,fval]=ga(@stalagmite,2);
xlabel('x value')
ylabel('y value')

%study1-Statistical behaviour without boundations

tic
for i=1:num_case

    % calculating the optimized value of the function
  [inputs,f_opt(i)] = ga(@stalagmite,2);
  x_opt(i)=inputs(1);
  y_opt(i)=inputs(2);
end

%time taken to evaluate
study1_time=toc

%plotting the graph
figure(2)

subplot(2,1,1);

surfc(x,y,-f);

hold on
shading interp

plot3(x_opt,y_opt,-f_opt,'marker','o','markersize',5,'markerfaceColor','r');
xlabel('x');
ylabel('y');
title('Statistical behaviour without boundations')
grid on

subplot(2,1,2);

plot(-f_opt);
xlabel('iterations')
ylabel('function maximum value')

%study2-statistical behaviour with boundations

tic

for j = 1:num_case

    % calculating the optimized value of the function

    [inputs,f_opt(j)]=ga(@stalagmite,2,[],[],[],[],[0;0],[1;1]);
    x_opt(j)=inputs(1);
    y_opt(j)=inputs(2);
end
study2_time=toc

%plotting

figure(3)
subplot(2,1,1);
hold on
surfc(x,y,-f);
shading interp

plot3(x_opt,y_opt,-f_opt,'marker','o','MarkerSize',5,'markerfacecolor','y');
xlabel('x');
ylabel('y');
title('Statistical behaviour with boundations')
grid on

subplot(2,1,2);
plot(-f_opt);
xlabel('iteration');
ylabel('function maximum value');

%study3-statistical behaviour with increase in populations

options=optimoptions('ga','PopulationSize',160);
tic
for k=1:num_case

    % calculating the optimized value of the function

    [inputs,f_opt(k)]=ga(@stalagmite,2,[],[],[],[],[0;0],[1;1],[],[],options);
    x_opt(k)=inputs(1);
    y_opt(k)=inputs(2);
end
study3_time=toc

%plotting

figure(4)
subplot(2,1,1);
hold on
surfc(x,y,-f);
shading interp

plot3(x_opt,y_opt,-f_opt,'marker','o','markersize',5,'markerfacecolor','b');

xlabel('x')
ylabel('y')
title('Statistical behaviour with increased population')
grid on
subplot(2,1,2);
plot(-f_opt);


xlabel('iteration')
ylabel('function maximum value')
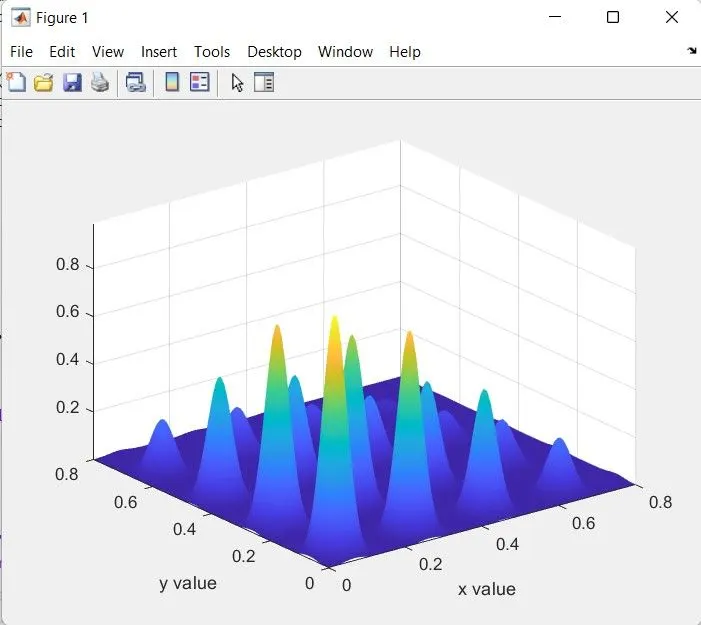
The above code contains the three studies of the statistical behavior of a set of population during the next generation. The initial code contains the search space and mesh grid which are used to calculate the values of fitness function and creating the surface plot which shows the maxima of the function by using the negative sign with the function value (-f).
The first section of the code calculate the stalagmite function output and plot a surface plot which showing the maxima of the function as shown below
After this the studies of statistical behavior occur which are as following
Study1-statistical behavior without boundation: In this study the optimum value of the fitness function at each iteration is evaluated and calculated using the syntax ga(@stalagmite,2) which gives the values of x and y the stalagmite function is maximum. Now, plotting the values in surface by using surfc command and also plot the optimum values of the function. The tic and toc commands are used to evaluate the time used to optimizing the function.
Plot for study 1:
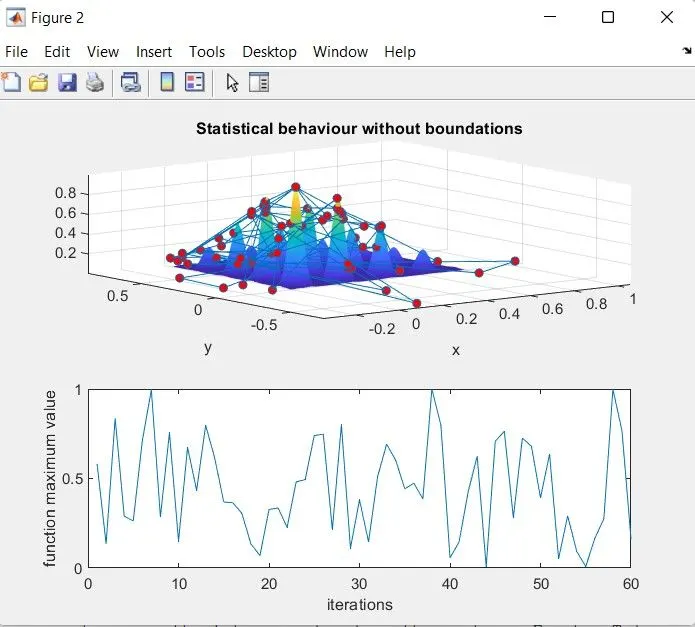
The above plot showing the optimizing values of the function which are looking verry messy and give a lot of variation in the optimized values.
The second graph shows the optimize values of the function.
The time taken to complete the function for the study 1 is as below

Study 2 -Statistical behavior with boundation: In this study the only difference is that here we are applying the limits on the ga so the search space is restricted with upper and lower boundaries. In this study we used the syntax of ga as ga(@stalagmite,2,[],[],[],[],[0;0],[1;1]) .Then plotting the data as plotted in the study 1.
Plot for study 2:
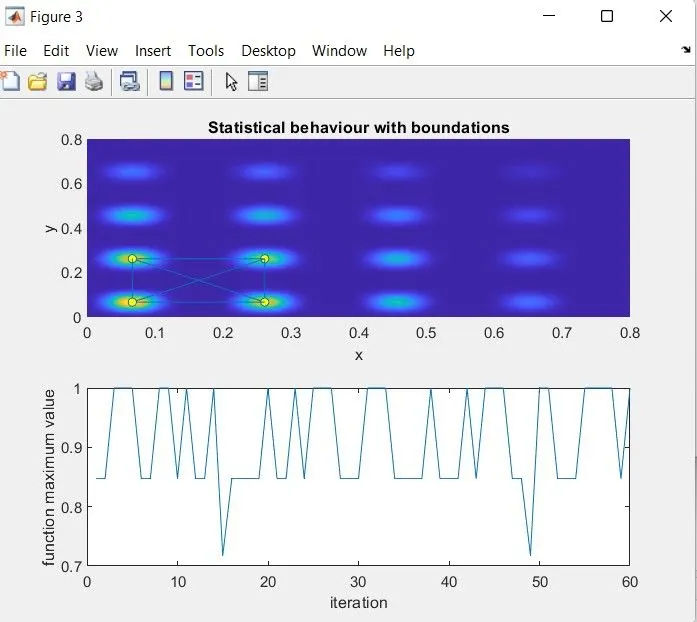
By providing the boundary limit we get a better and specified result of the optimized values of the function.
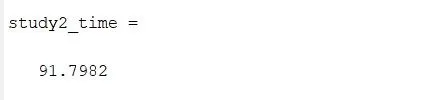
The time taken to complete the function for the study 2 is as below
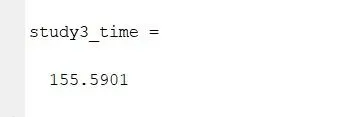
Study 3- Statistical behavior with increase in the population: In this study, we increase the population by the use of the optimoptions command. With this study we can work on a large set of population which will led to increase the possibilities of finding the better fitness of the function. The only drawback is that it took a lot of time to evaluate the population.
Plot for study 2:
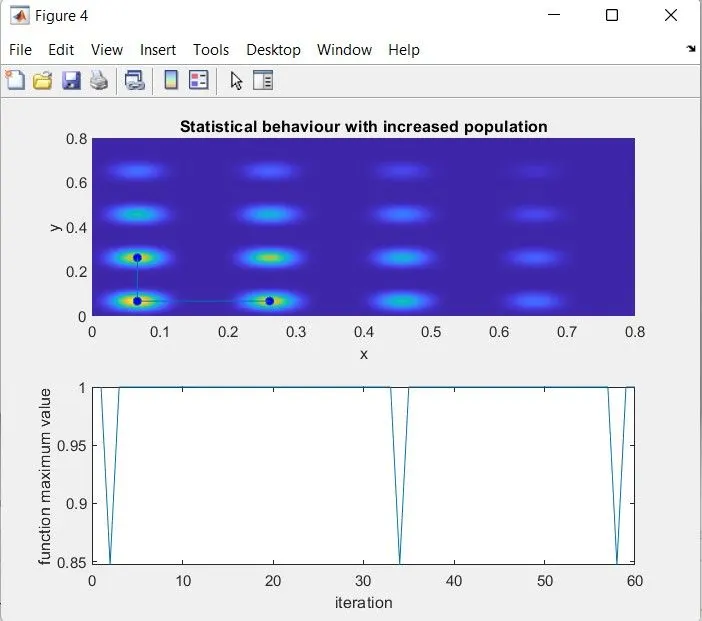
The above plot shows the fitness function value of an increased population evolution.
The time taken to complete the function for the study 3 is as below
Errors
Error01:

As shown in the above image that variable is unrecognized because I forget to define the num_case variable above. So I define the variable and resolved the error.
Erroe02:

The above error is coming due to the same length of the variables for the input, on checking the code I found mistake in loop so the error is resolved by correction the loop by adding the i in the f_opt.
Error03:

This error is coming because of not defining the option variable So the error is resolved by defining the option variable with the following syntax
options=optimoptions('ga','PopulationSize',160);
Conclusion: Form the above challenge I have understand the Genetic Algorithm and their use in the MATLAB coding and with the help of the genetic algorithm I have developed a code for the evaluation of a set of population. I also learn about the different syntaxes of the ga.
References:
- https://en.wikipedia.org/wiki/Genetic_algorithm
- https://in.mathworks.com/help/gads/ga.html?searchHighlight=Syntax#mw_46d5ecc6-7ae1-4400-821b-3a29c14be603
YouTube links