Solving second order ODEs
AIM:- To write a program in Matlab that will simulate the Pendulum Motion.
OBJECTIVE:- To write a program that solves the following ODE i.e. (Second Order Differential Equation).
THEORY:- Second order differential equation is a equation involving the unknown function y. Its derivatives y' and y''. ODE is used to describe the transient behaviour of system. for example a simple pendulum.
SCHEMATIC DIAGRAM:-
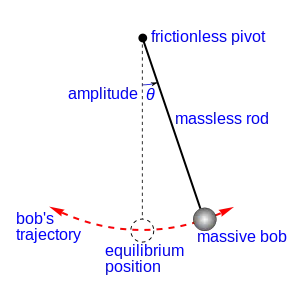 '
'
FORMULA USED:-
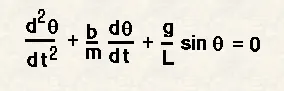
where,
g = 9.81 ; gravity in m/s^2.
L = 1 ; Length of pendulum in metre.
m = 1 ; mass of the ball in kg.
b = 0.05 ; damping coefficient.
USE OF ABOVE FORMULA TO SOLVE SECOND ORDER DIFFERENTIAL EQUATION:-
suppose theta = theta1
(d theta)/(dt) = (d theta1)/(dt) = (theta2) --- this is equation 1
In the above equation we have assumed the variables.
(d^2 theta)/(dt^2) = (d^2 theta1)/(dt^2) = d/dt*(d_theta1)/dt = d/dt*(theta2)--- this is equation 2
In the above equation we have applied values to assumed variables.
The output hence obtained is ;
By applying the equation 1 and 2 to the above given formula after splitting it and the output obtained is:-
[(d theta2)/dt = (-b)/m*theta2 - g/L*sin(theta1)]
CODE:-
clear all
close all
clc


b = 0.05;
g = 9.81;
l = 1;
m = 1;

% initial condition
theta = [0;3]; %[Angular Displacement (0); Angular Velocity (3)in rad/sec]

% time points
t_span = linspace(0,20,500)

% solve ODE
[t, results] = ode45(@(t,theta) ode_func(t, theta, b,g,l,m),t_span, theta);

plot(t,results(:,1))
hold on
plot(t,results(:,2))
xlabel('time')
ylabel('Plot')

ct = 1;
for i = 1:length(results(:,1))
    THETA = results(i,1);
    %Inputs
    x0 = 0;
    y0 = 0;

    x1 = l*sin(THETA);
    y1 = -l*cos(THETA);

    % plotting string
    figure(2);
    plot([x0,x1],[y0,y1],'color','g');
    hold on

    % plotting pendulum bob
    plot(x1,y1,'o','markersize',10,'color','r','MarkerFaceColor','r');
    hold off

    axis([- 1 1 -1.5  0]);
    pause(0.001);
    M(ct) = getframe(gcf);
    ct=ct+1
end

%Creating a movie
movie(M);
videofile = VideoWriter('pendulum.avi', 'Uncompressed AVI');
open(videofile)
writeVideo(videofile,M)
close(videofile)
Step 1:- First we created the simple code to start the program.
Step 2:- Now write down the values of variables given such as (m, g, L, b)
Step 3:- By this command (%) we have shown the comments in the code.
Step 4:- Now write the code for particular fumctions.
Step 5:- ODE45 is a syntax used is Matlab to solve the differential equation. As for second order differential equation we try to solve the equation and get 2 outputs and manually its too long task so for that ODE45 syntax command is used which make ease to solve higher order of differential equations at great ease.
Step 6:- After this we apply values to plot the graph between Time v/s Plot.
Step 7:- Now we give syntax For loop which is used in the program to repeat specified value at different number of times.
Step 8:- counter (ct) syntax is used to count number of iterations placed in the program as far as for loop runs. counter command always used to start with 1 i.e. ct = 1.
(For using it for higher numbers its like [ct = ct + 1])
Step 9:- Now at last we create a AVI file to show the pendulum oscillation by applying movie syntax to it. It is used to show the movie from uncompressed file and once its completed then it is closed.
Function Program for ODE:-
function [dtheta_dt] = ode_func(t,theta,b,g,l,m)

theta1 = theta(1)
theta2 = theta(2)
dtheta1_dt = theta2;
dtheta2_dt = -(b/m)*theta2 - (g/l)*sin(theta1);
dtheta_dt = [dtheta1_dt; dtheta2_dt];
end
In the another tab we use a function syntax to make a program to solve the second order differential equation.
The above code solve the equation and provide respective answer.
ERRORS :-
(A) ERROR OCCURED:-
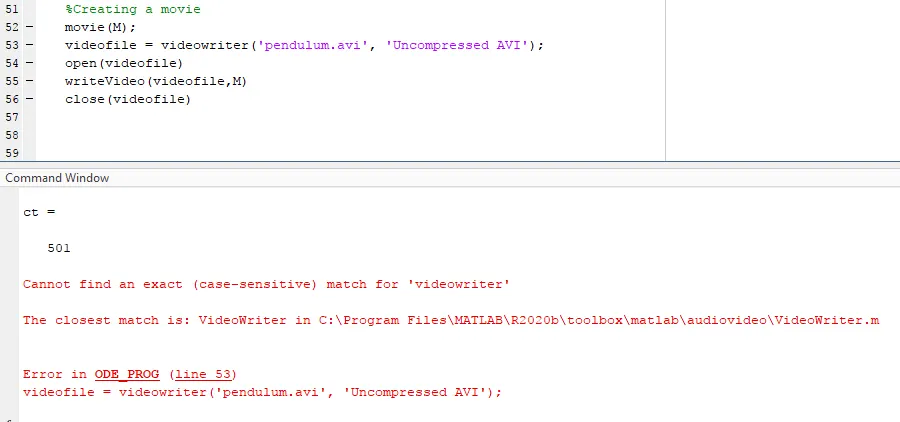
The above failure was occured due to writing the syntax of VideoWriter as videowriter.
The alphabets Vand W are in small letters which shows the different value of syntax through with there was problem in running code.
ERROR SOLVED:-
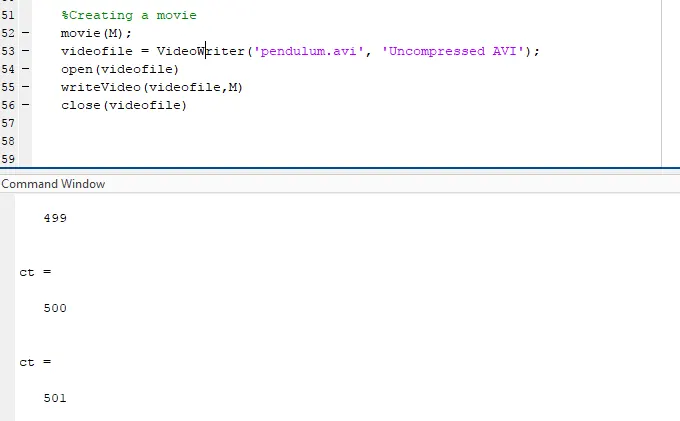
After correcting the syntax as used for VideoWriter the program began to run. and the result is shown in the above figure.
(B) ERROR OCCURED:-
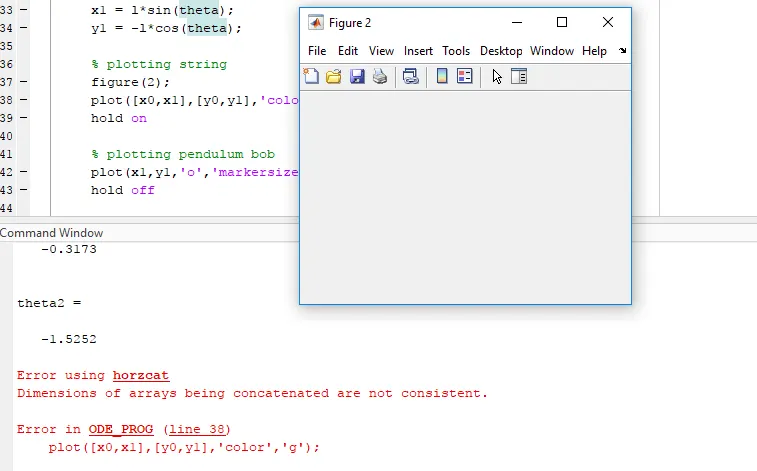
In the above figure the value of x1 and y1 were provided the wrong inputs as 'theta' which is to be written as 'THETA' because the code above this is mentioned as
{i = 1:length(results(:,1))
THETA = results(i,1);}
That means the THETA values vary every where.
ERROR SOLVED:-
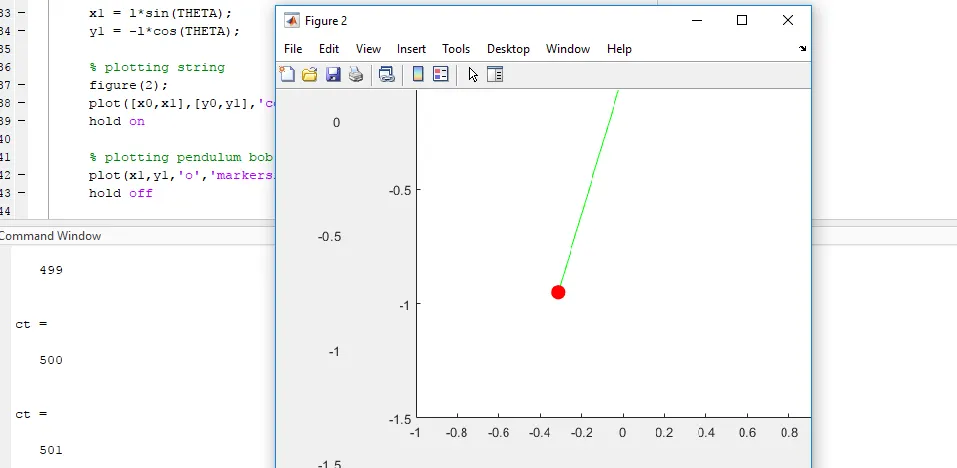
The above image shows that there was change in the inputs as mentioned for the syntax and the program was run and the output can be seen as it perform well.
RESULTS:-
(1) PLOTTING GRAPH:-
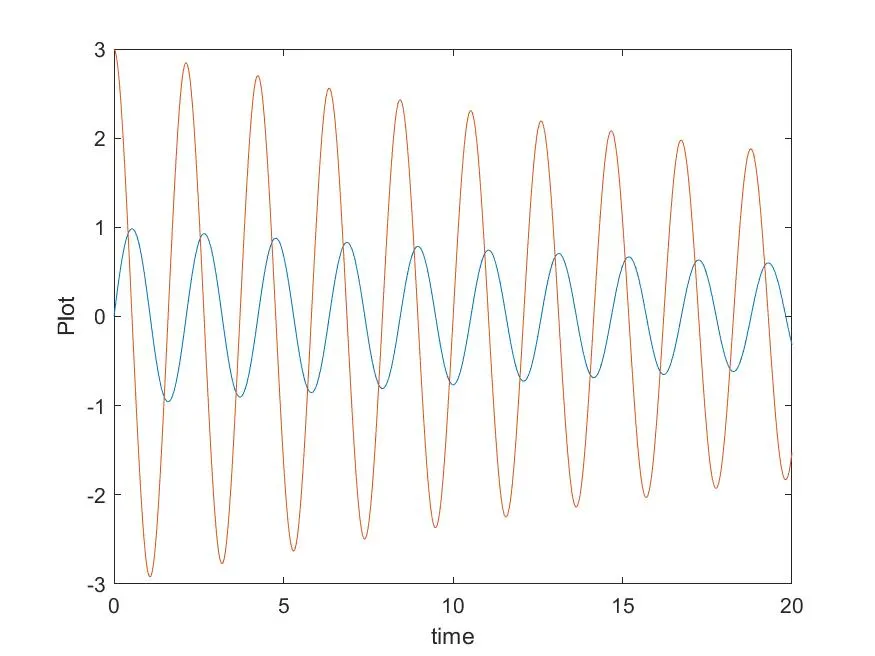
In this above graph the x-axis shows 'time' where as y-axis shows 'plot'.
The blue line on the graph resemble the angular displacement which is in metre and it starts with 0, The another line shown on the graph represents angular velocity which is in rad/sec and it starts with 3.
(2) VIDEO LINK:-
The above link is posted on the youtube which shows the oscillating pendulum.