Parsing NASA thermodynamic data
AIM:-
Write a MATLAB program that extracts the 14 co-efficients and calculates the enthalpy, entropy and specific heats for all the species in the data file i.e. NASA thermodynamic data.
OBJECTIVE:-
1) Calculate Enthalpy, Entropy and Specific heats for all the species in the data file.
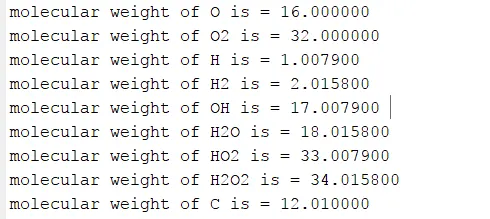
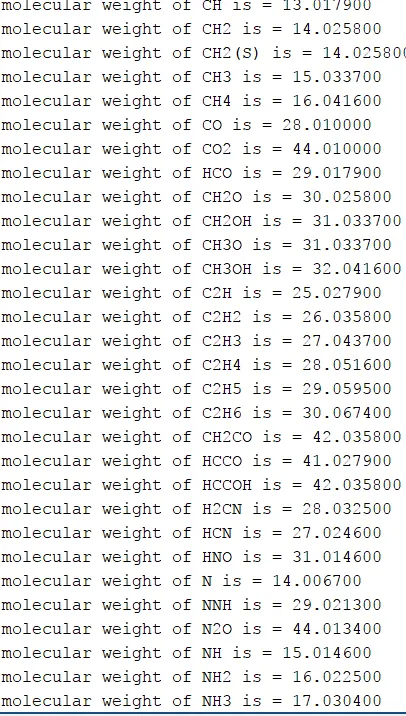
2) Calculate the molecular weight of each species and display it in command window.
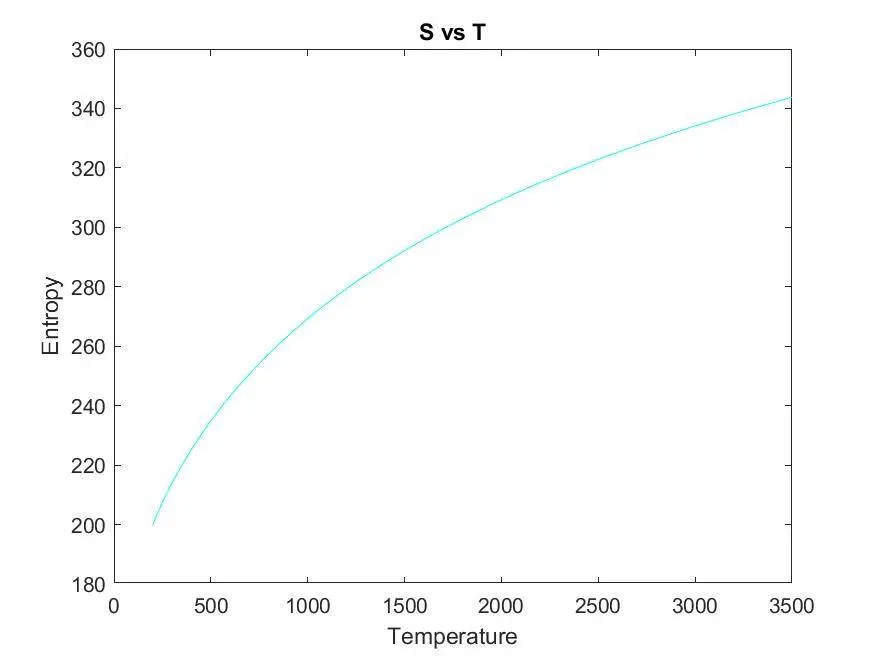
3) Plot the Cp, Entropy, Enthalpy for the local temperature range.
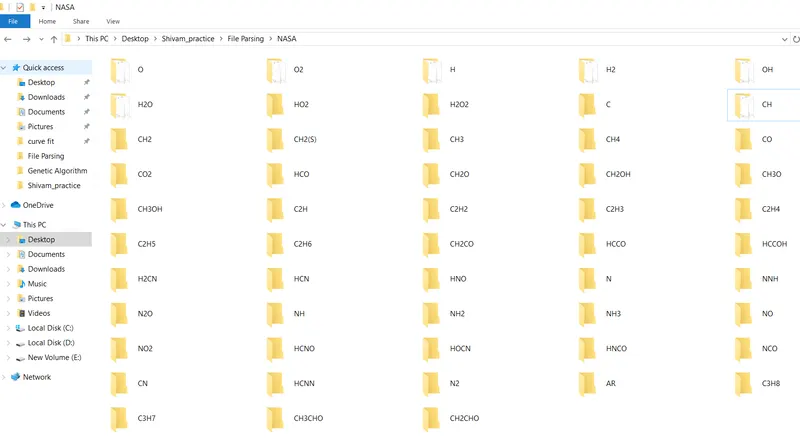
4) Save the plots as images with appropriate names and create seprate folder for each species.
THEORY:-
1) FILE PARSING
File parsing or parsing a file means reading in a data stream of some sort and building an in memory model of the semantic content of that data. The aims at facilitating performing some kinds of transformation on the data.
The actual definition of parse is to split a file or other input into pieces of data that can be easily stored or manipulated. So we are splitting a string into parts then recognizing the parts to convert it into something simpler than a string.
2) Thermodynamic Properties:-
a) Specific Heat (Cp):- The heat required to raise the temperature of a unit mass of a substance by 1 degree celsius.
b) Enthalpy (H):- Enthalpy is the property of thermodynamic system, defined as the sum of the system internal energy and the product of its pressure and volume .
Formula :- {H = U + PV}
c) Entropy (S):- The measure of sysytem internal energy per unit temperature that is unavailable for doing useful work. It is also define as measure of randomness of a system.
Formula :- {S = k logW}, where k is Boltzman Constant which is equal to 1.38065x10^-23 J/K.
FORMULA USED:-

COMMANDS USED:-
1) fgetl = By using this command we read a file data line by line.
2) fopen = Here the use of this command was to open a 'THERMO.dat' file.
3) strcmp = Strings are in both upper case and lower case . So this command is used to compare all the lines by ignoring the case of letter.
4) Strsplit = This command is used to split into separate quantity which can be store in variable.
5) Findstr = This command is used to find a location of a particular character from string.
6) linspace = This command was used to generate 1000 values between Local Minimum Temperature and Local High Temperature.
7) For loop = For loop is used to repeat a number of iterations for a specified number of time.
8) cd = This command is used to change directory, it changes the current folder to new folder.
9)mkdir = This command is used to create a folder.
10) str2num = This command is used to convert string into number.
11) Save as = This command is used to save the code, plot as jpg format.
12) frewind(fileID) = This command in used to reach the beginning of file.strcmp
Main Code
clear all
close all
clc

%getting the data

f1 = fopen('THERMO.dat','r')

% reading header information
x = fgetl(f1);

counter = 1

while strcmp(x,'END') == 0
counter = counter + 1
x = fgetl(f1);
end

%skipping six lines
%calculate number of species in data file

Number_of_species = (counter-6)/4
%find global temperature values from the 2nd line
%temp is string and we make it into integer
% strsplit command is used to split the line according to our input
 frewind(f1);
 fgetl(f1);

f2 = fgetl(f1);
temp_split = strsplit(f2);
global_low_temp = str2double(temp_split{2});
global_mid_temp = str2double(temp_split{3});
global_high_temp = str2double(temp_split{4});
temp = linspace(global_low_temp,global_high_temp,1000);

%skipping next 3 lines
for j = 1:3
    f3 = fgetl(f1);
end

for i = 1:Number_of_species

    % extract the values of local high, mid and low temperatures
    f4 = fgetl(f1);
    local_temp_split = strsplit(f4);
    w = length(local_temp_split);
    species_name = local_temp_split{1};
    local_low_temp = str2double(local_temp_split{w-3});
    local_mid_temp = str2double(local_temp_split{w-1});
    local_high_temp = str2double(local_temp_split{w-2});

    % temperature ranges are formed from low to high temperatures
    T = linspace(local_low_temp,local_high_temp,1000);

   %first line of coefficents

  coefficient_L1 = fgetl(f1);
  a = strfind(coefficient_L1,'E');
  %strfind takes the coefficient L1 as input and find all E
  %a(1) is the first position of E and likewise
  %coefficients of first line
  c1 = str2double(coefficient_L1(1:a(1)+3));
  c2 = str2double(coefficient_L1(a(1)+4:a(2)+3));
  c3 = str2double(coefficient_L1(a(2)+4:a(3)+3));
  c4 = str2double(coefficient_L1(a(3)+4:a(4)+3));
  c5 = str2double(coefficient_L1(a(4)+4:a(5)+3));

  %coefficients of second line
  coefficient_L2 = fgetl(f1);
  a = strfind(coefficient_L2,'E');
  c6 = str2double(coefficient_L2(1:a(1)+3));
  c7 = str2double(coefficient_L2(a(1)+4:a(2)+3));
  c8 = str2double(coefficient_L2(a(2)+4:a(3)+3));
  c9 = str2double(coefficient_L2(a(3)+4:a(4)+3));
  c10 = str2double(coefficient_L2(a(4)+4:a(5)+3));

  %coefficient of third line
  coefficient_L3 = fgetl(f1);
  a = strfind(coefficient_L3,'E');
  c11 = str2double(coefficient_L3(1:a(1)+3));
  c12 = str2double(coefficient_L3(a(1)+4:a(2)+3));
  c13 = str2double(coefficient_L3(a(2)+4:a(3)+3));
  c14 = str2double(coefficient_L3(a(3)+4:a(4)+3));

 % create a folder to store all data
 mkdir(['C:UsersSkill_LyncDesktopShivam_practiceFile ParsingNASA',species_name])

 %value of universal gas constant, unit(J/Kmol)
 R = 8.314;

 for k = 1:length(T)
 if T(k) > local_mid_temp;
     CP(k) = R*(c1 + c2*T(k) + c3*T(k)^2 + c4*T(k)^3 + c5*T(k)^4);
     H(k) = R*T(k)*(c1 + c2*T(k)/2 + c3*T(k)^2/3 + c4*T(k)^3/4 + c5*T(k)^4/5 + c6/T(k));
     S(k) = R*(c1*log(T(k)) + c2*T(k) + c3*T(k)^2/2 + c4*T(k)^3/3 + c5*T(k)^4/4 + c7);
 else
      CP(k) = R*(c8 + c9*T(k) + c10*T(k)^2 + c11*T(k)^3 + c12*T(k)^4);
     H(k) = R*T(k)*(c8 + c9*T(k)/2 + c10*T(k)^2/3 + c11*T(k)^3/4 + c12*T(k)^4/5 + c13/T(k));
     S(k) = R*(c8*log(T(k)) + c9*T(k) + c10*T(k)^2/2 + c11*T(k)^3/3 + c12*T(k)^4/4 + c14);
   end
 end

 % plot for Cp vs T
 figure (1)
 plot(T,CP,'color','r')
 xlabel('Temperature')
 ylabel('Specific Heat')
 title('Cp vs T')

  % plot for H vs T
 figure (2)
 plot(T,H,'color','b')
 xlabel('Temperature')
 ylabel('Enthalpy')
 title('H vs T')

  % plot for S vs T
 figure (3)
 plot(T,S,'color','c')
 xlabel('Temperature')
 ylabel('Entropy')
 title('S vs T')

 %cd command is used to change the current folder to new folder
 cd(['C:UsersSkill_LyncDesktopShivam_practiceFile ParsingNASA',species_name])

 %saveas command is used tostpre the figures to specified file formart 'jpg'
 saveas(1,'Specific Heat','jpg')
 saveas(2,'Enthalpy','jpg')
 saveas(3,'Entropy','jpg')

 %calculate molecular weight of species
 Atoms = ['A','C','H','N','O'];
 Atomic_Weight = [39.95,12.01,1.0079,14.0067,16];
 Molecular_Mass = 0;

 for r = 1:length(species_name)
     for s = 1:length(Atomic_Weight)
         if strcmp(species_name(r),Atoms(s))
             Molecular_Mass = Molecular_Mass + Atomic_Weight(s);
             t = s;
         end
     end
     n = str2double(species_name(r));

     if n > 1
         Molecular_Mass = Molecular_Mass + (Atomic_Weight(t)*(n-1));
     end
 end
 fprintf('molecular weight of %s is = %f n',species_name,Molecular_Mass)
end
PROCEDURE:-
Step 1:- First open the Thermo data file using the fopen command.
Step 2:- Now reading the header information we will use fgetl command to get the lines as allowed same as split command is used to split the lines.
Step 3:- Now extract the data for different types of global temperature.
Step 4:- extract the data for different types of local temperature.
Step 5 :- linspace command is used to find the exact values which we have given input 1000 to find the values between local and high temperature.
Step 6:- Counter command is used to count the lines.
Step 7:- I have find the coefficients of line 1 as c1-c5 after this the coefficients of line 2 i.e. c5 -c10 and then the coefficient of line 3 i.e. c11-c14.
Step 8:- strfind command is used to find the string value.
Step9:- I use for-loop command to start the code for a number of iterations going to take place.
Step 10:- In for-loop command. I use the if-else command to calculate the specific heat (CP), Enthalpy(H), Entropy(S). This command is probably used to display the value either this or that.
Step11:- After this i have plotted the different graphs for CP vs T, H vs T, S vs T.
Step 12:- mkdir command is used to create a new folder.
Step 13:- cd command is used in the code to change the position of the folder from current to new.
Step 14:- After this i have used the saveas command to save figures in jpg format.
Step 15:- After this again for loop command is used to find the Atomic weight , Molecular Mass of the atoms taken as ['A','C','H','N','O'.
Code to calculate Molecular Mass:-
%calculate molecular weight of species
 Atoms = ['A','C','H','N','O'];
 Atomic_Weight = [39.95,12.01,1.0079,14.0067,16];
 Molecular_Mass = 0;

 for r = 1:length(species_name)
     for s = 1:length(Atomic_Weight)
         if strcmp(species_name(r),Atoms(s))
             Molecular_Mass = Molecular_Mass + Atomic_Weight(s);
             t = s;
         end
     end
     n = str2double(species_name(r));

     if n > 1
         Molecular_Mass = Molecular_Mass + (Atomic_Weight(t)*(n-1));
     end
 end
 fprintf('molecular weight of %s is = %f n',species_name,Molecular_Mass)
end
PROCEDURE:-
1) In this i have taken the atoms and mark the atomic weight of such atoms.
2) Now i have marked the molecular mass as 0 as its initial position.
3) I have started the for loop including the range from 1 to length of number of species.
4) Inside this we created one more for loop which is used to calculate the values between 1 to Atomic Weight.
5) strcmp command is used for string comparison.
6) I have mention the formula for Molecular Mass which will be calculated throgh it.
7) fprintf command is used to print whatever is calculated in command window.
RESULT:-
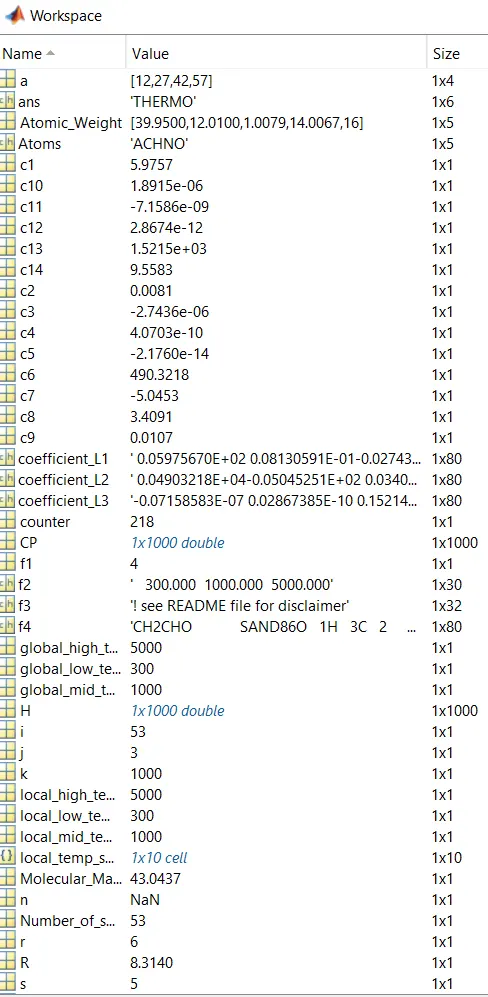
Command Window:-
Destination Folder where all the species are stored
PLOTS:-
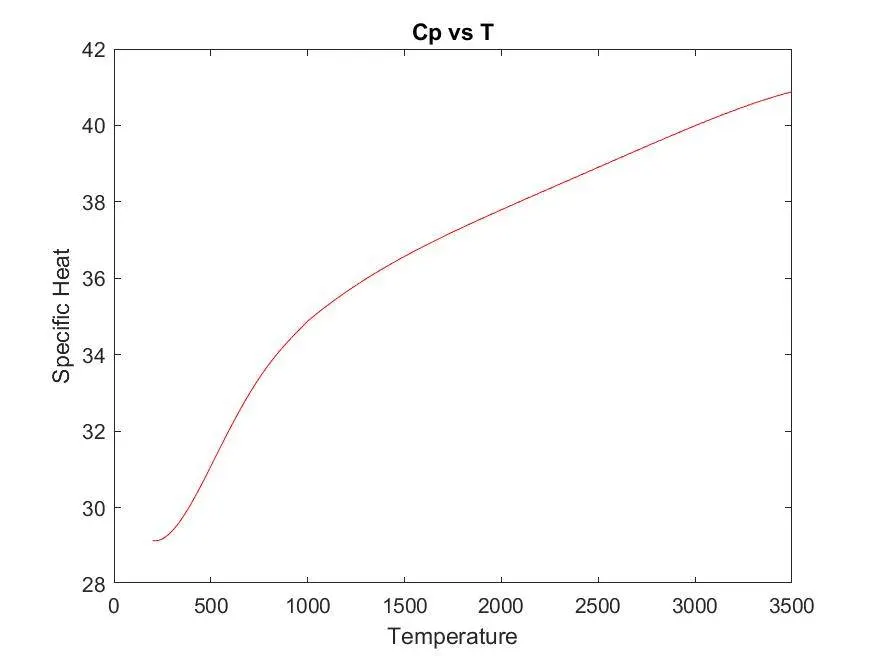
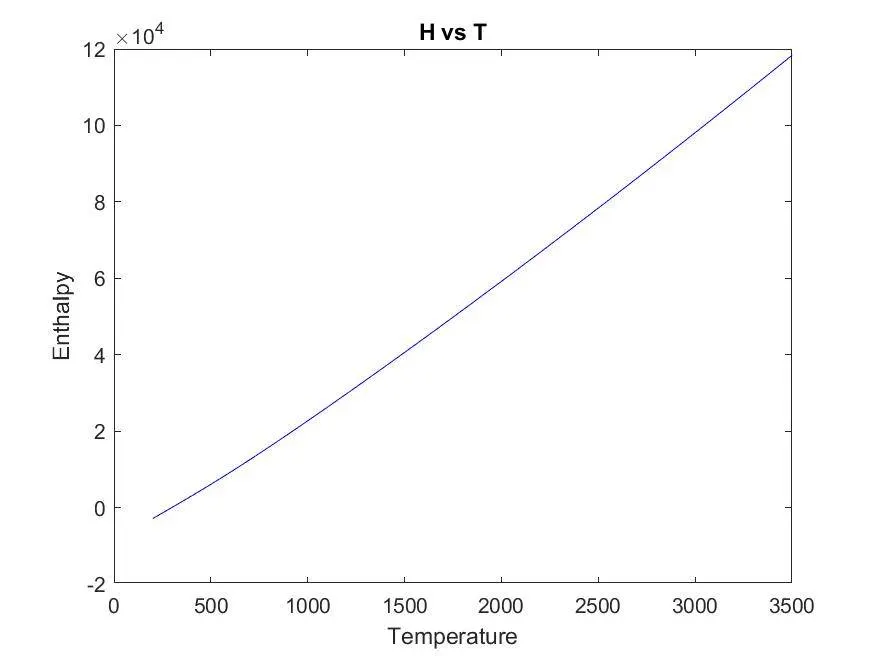
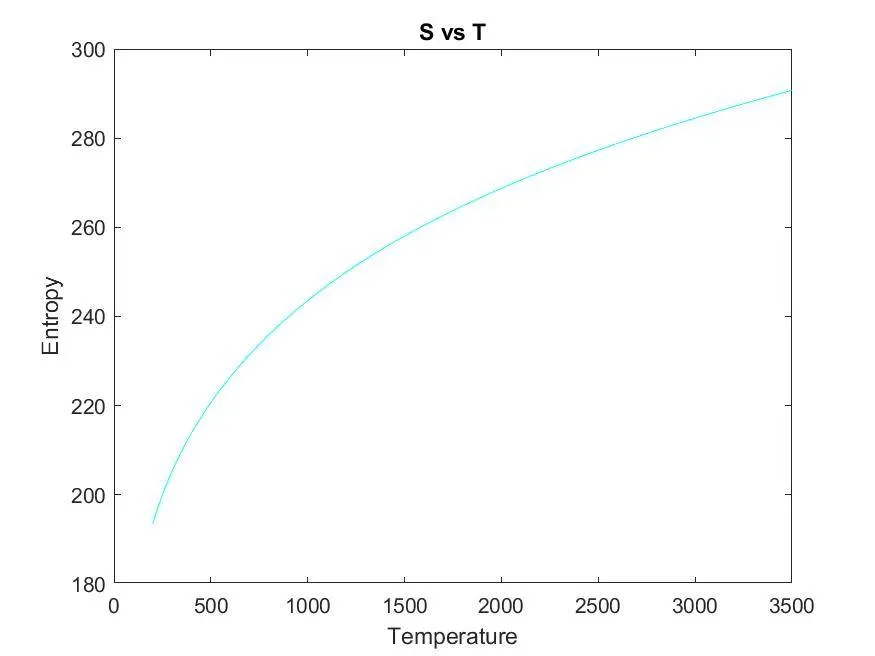
1) Plot for O2
Plotting between Temperature vs Specific Heat
Plotting between Temperature vs Enthalpy
Plotting between Temperature vs Entropy
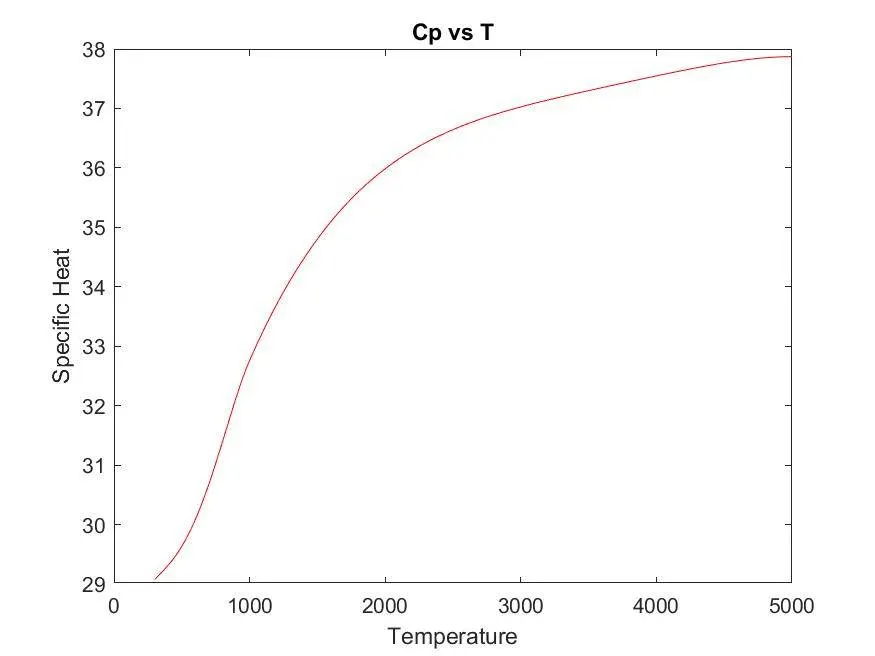
2) Plot for N2
Plotting between Temperature vs Specific Heat
Plotting between Temperature vs Enthalpy
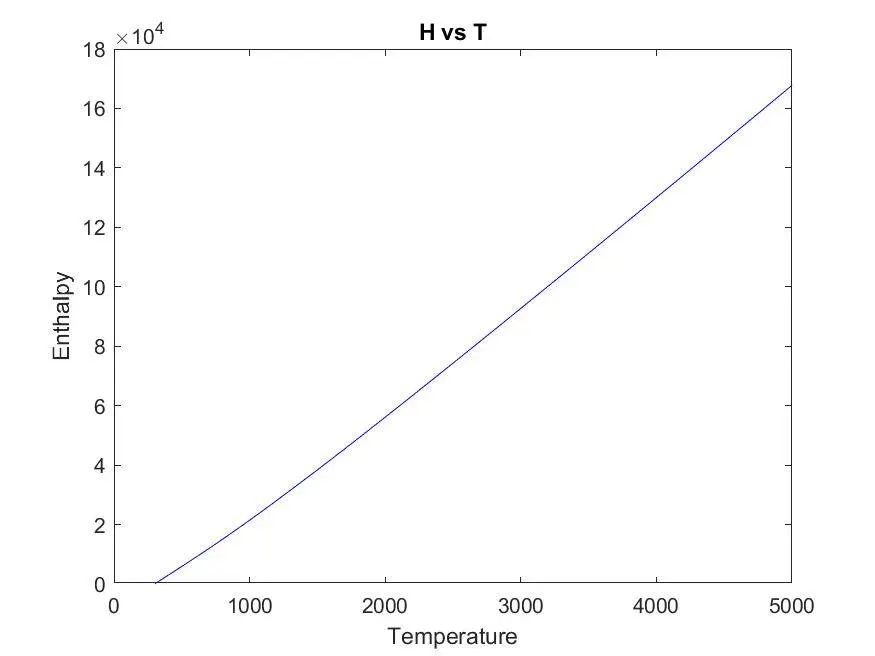
Plotting between Temperature vs Entropy
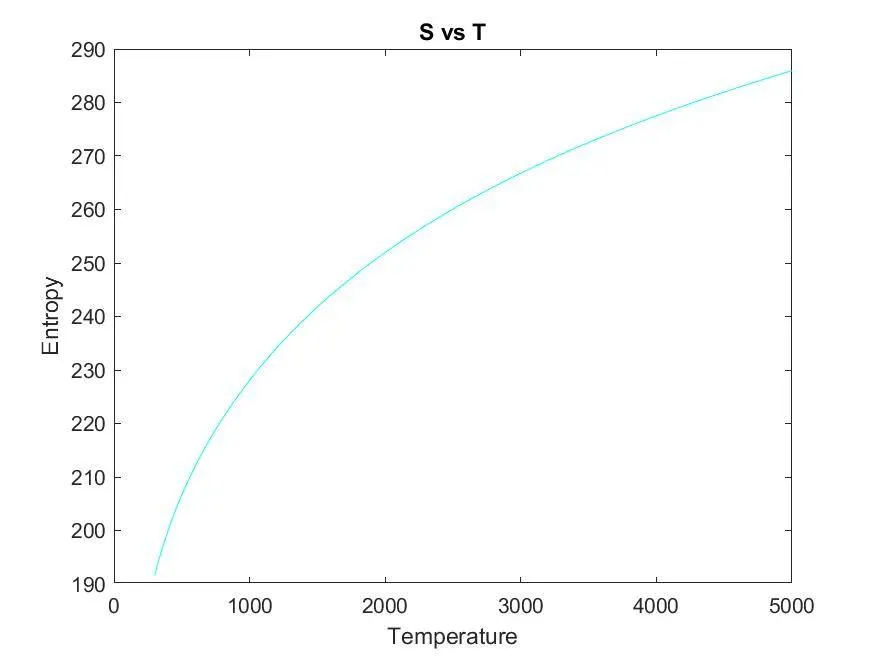
3) Plots for CO2
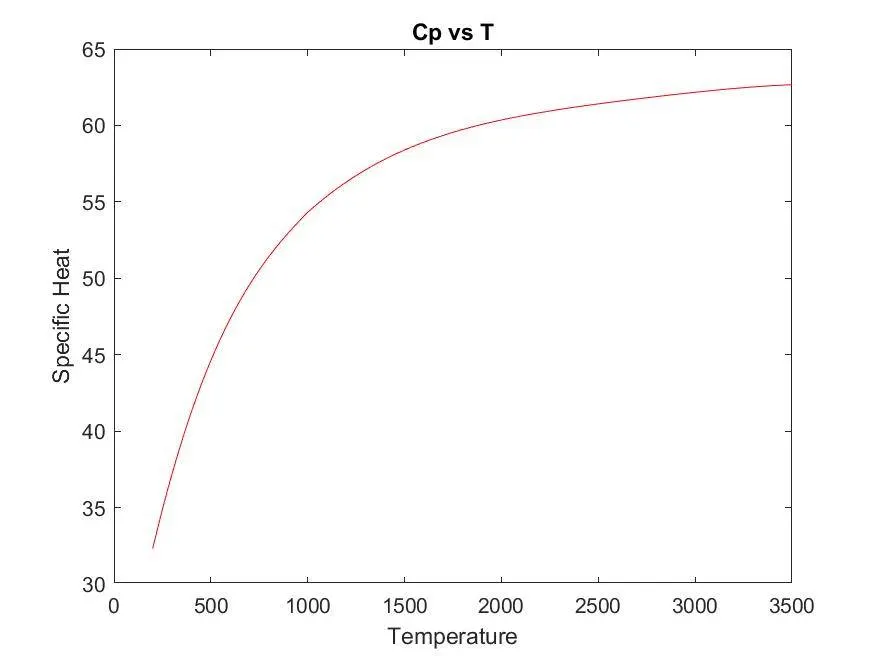
Plotting between Temperature vs Specific Heat
Plotting between Temperature vs Enthalpy
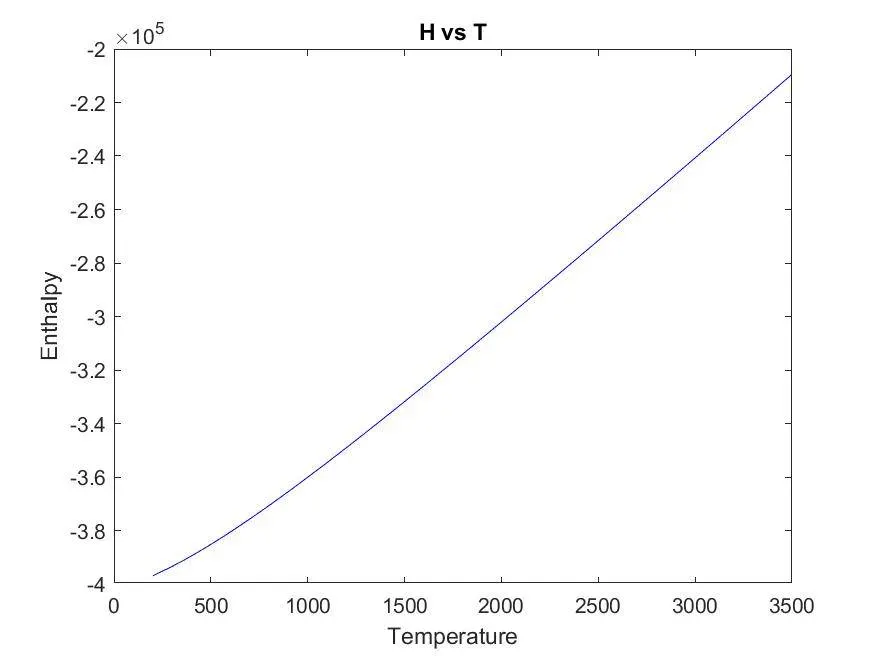
Plotting between Temperature vs Entropy
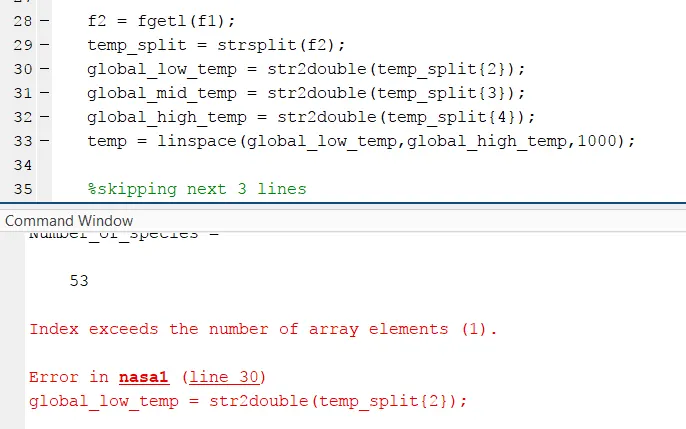
ERRORS:-
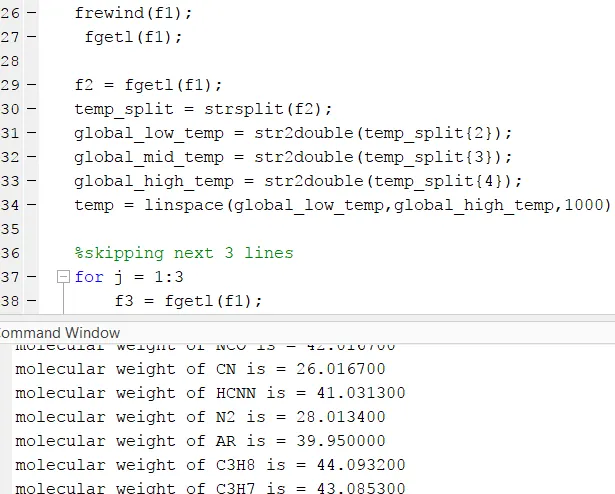
SOLVED:-
LEARNING OUTCOME:-
1) I have learned how to open and read the files.
2) I have learned how to extract files for the different values of temperature.
3) Use of if-else loop and counter command.
4) Learn how to create folder and then change the directory of that folder.
5) This challenge make me learn everything in matlab and got to know much more about that.
CONCLUSION:-
1) Got to learn so much into this.
2) This was one of the challenging task or project to me.
3) This helped me a lot in understanding MATLAB properly.