Week 3 - Solving second order ODEs
Aim- To solve the pendulum equation by using ODE45 in MATLAB and ploting the graph and creating animation.
Objective-
Your objective is to write a program that solves the following ODE. This ODE represents the equation of motion of a simple pendulum with damping.
Pendulum motion governing equation:-
`d^2theta/dt^2+(b/m)d^1theta/dt+(g/l)sintheta=0`
In the above equation,
g = gravity in m/s2,
L = length of the pendulum in m,
m = mass of the ball in kg,
b=damping coefficient.
Theory-
ODE45 command - In MATLAB ODE45 is used to solve the differential equations of 1st order. ODE45 is predefined function. It uses the 4th order Ranga Kutta (4 step euler method) at the backend proccessing in MATLAB. We will uses this function to solve our pendulum motion governing equation.
Main script:-
clear all
close all
clc

%Defining the input state points.
b= 0.5;  %Damping co-efficient Nm/s
g= 10;   %gravitational acceralation m/s^2
l= 0.75; %length of the pendulum string m
m= 1;    %mass of the bob kg

%Initail condition angular displacement and angular velocity
theta_0 = [0;5];     %Intnitial dispacement= 0 and Intial velo.= 5 in radian

%Time input
tspan= linspace(0,10,400);

%Solving the differntial equation of the pendulum
[t,theta_D_V]= ode45(@(t,theta) ode_func(t,theta,b,g,l,m),tspan,theta_0);

%plotting the graph for the displacement and velocity at different time values.
figure(1);
plot(t,theta_D_V);
xlabel('time span');
ylabel('Displacement and angular velocity in radian');
title('Displacement, velocity and time graph');
legend('Displacement','Velocity');

%now using for loop to control the different values of Displacment
x0= 0;   %initial value of x for string
y0= 0;   %initial value of y for string
ct=1;   %counter variable for movie creation

for i= 1:length(theta_D_V(:,1))    %indexing done on theta_D_V
    thet1 = theta_D_V(i,1);        %i is carrying only the single displacement value in column 1

    x1= l*sin(thet1);
    y1= -l*cos(thet1);             %the '-' is used in y axis because the string of the pendulum is
                                   %on the negitive side of the y-axis from the origin

    %ploting the graph of x1 and y1
    figure(2);
    plot([-0.2 0.2],[0 0],'LineWidth',4)
    hold on
    plot([x0 x1], [y0 y1],'LineWidth',2);
    hold on                        %to hold the previous plot
    %ploting marker as a BOB for pendulum
    plot(x1,y1,'o','markers',20,'MarkerFaceColor','g');
    hold on
    xlabel('x-axis');
    ylabel('y-axis');
    axis([-1.5 1.5 -1 0.4]);

    title('SHM Motion of a pendulum');
    hold off

    %M is an array of the different frame captured of the x1,y1 plot
    M(ct) = getframe(gcf);
    ct= ct+1;  %ct is an updating value for each iteration of i to maintain the order of the frames.
end

%movie command is used to creat movie of array (M).
movie(M)
%videofile is a variable.
videofile = VideoWriter('Pendulum.AVI','Uncompressed AVI');
open(videofile)
writeVideo(videofile,M)
close(videofile)
User defined function:-
function [dtheta_dt] = ode_func(t,theta,b,g,l,m)

theta1= theta(1);                             %Displacement
theta2= theta(2);                             %Velocity
dtheta1_dt= theta2;                           %This equation is derived from the pendulum governing equation. this is equ no. 1
dtheta2_dt= -(b/m)*theta2-(g/l)*sin(theta1);  %This equation is derived from the pendulum governing equation. this is equ no. 2
dtheta_dt= [dtheta1_dt;dtheta2_dt];

end
Code explanation-
- Defining all the input variables and parameters related to pendulam geometry.
- Defining the initial contion of the pendulum angular displacement, angular velocity and the entire time span of the motion.
- Solving the differential equation of the pendulum by using the ODE45 command and by solving the differential eqation we get the states points to plot the Displacement, Velocity and time graph.
- [t,theta_D_V]= ode45(@(t,theta) ode_func(t,theta,b,g,l,m),tspan,theta_0)
Here,
theta_0 = Initial condition at y-axis which contains 2 dependent variables displacement and velocity respectively.
tspan = time duration this is an Row vector.
ode_func = this is a function which contian's the pendulum equation and 'ode_func' is the name of the function and (t,theta,b,g,l,m) are the inputs to the function.
@ = this is a MATLAB command which used when there is unknown variables in the script.
[t, theta_D_V] = these are the output of the function and 'theta_D_V' is an column vector carrying 2 dependend variables.
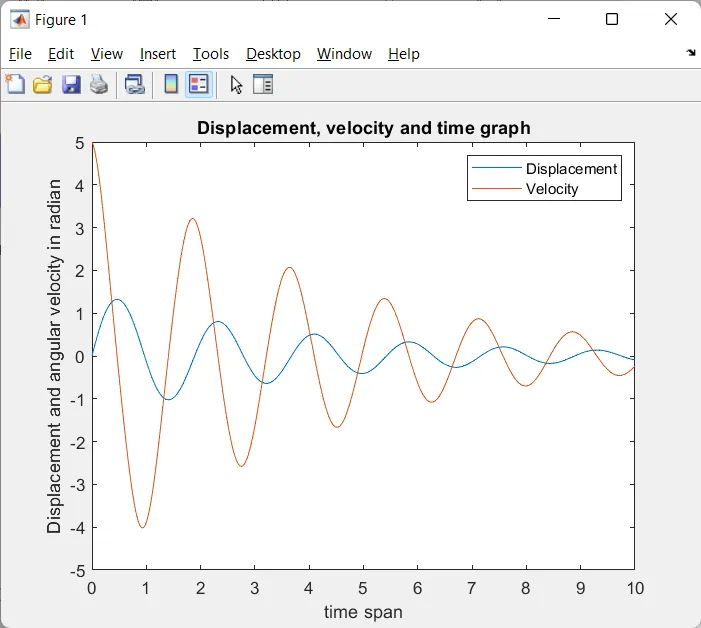
- plotting the graph for the displacement and velocity at different time values using the (t,theta_D_V) points. There will be 2 graphs as there are 2 dependend variables along with the time t. Figure(1) command iss used because there are 2 figures in this case.
- Using for loop to control the theta (Displacement) because the moment of the pendulum depends on the change the displacement vlaues. AS there are 2 column so we are indexing the theta_D_V to access only the column 1 i.e, displacement.
- Defining the X1, Y1 points the pendulum trigonometrical equation and for Y1 we'll take '-' because the pendulum is below the y-axis from the the origin and the origin of the pendulum string is fixed.
- Ploting X1, Y1 using plot commands and the BOB is plot as a point in the graph so using marker to represent the BOB.
- The M(ct) =getframe(gcf) command is used for capturing the graph as a frameand then storing it on the M array with indexing (ct) in asequential order.
- we wrote the plot and M(ct) array inside the inner loop because we want to plot at each value of theta and the have to capture the each frame in order in M(ct) array.
- Finally we gave the command to creat the movie with the help of (M) array by using the movie(M) command.
- The output we got is the animated clip of the SHM of pendulum.
The output of the entire code:-
Animation Video link:-https://drive.google.com/file/d/1WyFWUWzznH9cAnGWjIUaLTBiMuC0ijgG/view?usp=sharing
conclusion:-
The conclusion of the problem is that the velocity and dispalcement of the pendulum is decreasing along with the time in other words it is coming to rest after a span of time. Which we can see from the Velocity, diplacement and time graph.
Error faced:-
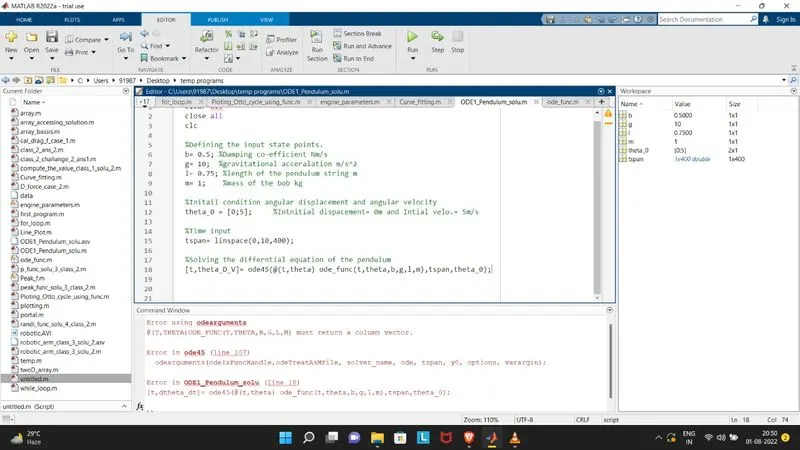
Got error on runing the ODE45 funtion becuause the the user define fuction was having some syntax error in it which was not returning the column vector values.
Over coming the error:-
Rechecking the error multiple times specifically the user define fuction and found out that the output of the user define function has the 2 values in coloum vector because the input to the fuction was also in column/array form and have to make the output also in vector form.