Project 1 - Parsing NASA thermodynamic data
Aim: - Calculate the specific heat, enthalpy, and entropy, plot the 3 graphs with respect to temperature for all the 53 species names and calculate the molecular mass.
Objective: -
- Write a function that extracts the 14 coefficients and calculates the enthalpy, entropy, and specific heats for all the species in the data file.
- Calculate the molecular weight of each species and display it in the command window.
- Plot the Cp, Enthalpy and Entropy for the local temperature range (low temperature : high temperature) specific for each species.
- Save the plots as images with appropriate names and dump them in separate folders for each species with a suitable name. All these should be generated automatically.
- The main program that you will submit will just take the "THERMO.dat" file as an input and generate Cp, H and S plots.
- Please write a detailed report to describe your logic.
The formulae are shown below: -
`(Cp)/R = a1 + a2T + a3T^2+a4T^3+a5T^4`
`H/(RT)=a1+a2T/2+a3T^2/3+a4T^3/4+a5T^4/5+a6/T`
`S/R=a1lnT+a2T+a3T^2/2+a4T^3/3+a5T^4/4+a7`
Here R is the universal gas constant, and T is the temperature.
The FIRST 7 coefficients are HIGH-temperature coefficients and the SECOND 7 coefficients are LOW-temperature coefficients.
Theory: -
File Parsing:
Parsing means to make something understandable (by analyzing its parts). For programming, this means converting information represented in one form into another form that's easier to work with. This is done by partially analyzing the data, understanding its underlying structure (by making some assumptions based on what you're expecting to see), and then explicitly representing that structure in the code.
Cp, h, and s calculation function code: -
 function [Cp, h, s] = parsing(a1,a2,a3,a4,a5,a6,a7,a8,a9,a10,a11,a12,a13,a14,mid_temp,T,R)

if (T<=mid_temp)

Cp = R*(a8 + (a9*T) + (a10*T.^2) + (a11*T.^3) + (a12*T.^4));
h = R.*ltr.*(a8 + (a9*(T./2)) + (a10*(T.^2./3)) + (a11*(T.^3./4)) + (a12*(T.^4./5)) + (a13./T));
s = R*((a8*(log(T))) + (a9*T) + (a10*(T.^2./2)) + (a11*(T.^3./3)) + (a12*(T.^4./4)) + a14);

else

Cp = R*(a1 + (a2*T) + (a3*T.^2) + (a4*T.^3) + (a5*T.^4));
h = R.*T.*(a1 + (a2*(T./2)) + (a3*(T.^2./3)) + (a4*(T.^3./4)) + (a5*(T.^4./5)) + (a6./T));
s = R*((a1*(log(T))) + (a2*T) + (a3*(T.^2./2)) + (a4*(T.^3./3)) + (a5*(T.^4./4)) + a7);

end
Cp, h, and s calculation function code explanation: -
- Created function providing with all the input co-efficient, mid temp, and gas constant.
- Applied if-else condition for splitting up of the temperature T array in LTR and HTR.
- End of the function.
Molecular weight calculation function code: -
function molecular_weight = wt(species_name)


Elements = ['H' 'C' 'O' 'N' 'A' 'S']

Atomic_weight = [ 1.00784 12.011 15.999 14.0067 39.948 32.065];


molecular_weight = 0;

for i = 1:length(species_name)    %this is the length of the current specie on the main code

    for j = 1: length(Elements)    %we used nested for loop in order to compare the each an every specie elements with the elements array

        if strcmp(species_name(i),Elements(j))    %comparing the specice name element with elements array

            molecular_weight = molecular_weight+ Atomic_weight(j);

            k=j;      %saved the atomic weight (j) value for further use in code

        else
            n = str2double(species_name(i));      %converting the string into double

            if n>1
                molecular_weight = molecular_weight + Atomic_weight(k)*(n-1);  %using (n-1) becuase we already added an atomic wt of the same element before

            end
        end
    end

end
Molecular weight calculation function code explanation: -
- Created function providing with the input species.
- Defined elements and respective atomic weight for all the elements in all the species.
- Used nested for loop with if-else condition in it. The parent for loop will control the species name length and the child for loop will control the length of elements for single iteration of the parent for loop variable.
- If-else condition is used to compare the species element with the element array and n is for the numerical digit.
- End of all the for loop and if condition.
File Parsing code script: -
clear
close
clc

%data file reading
f = fopen('THERMO.dat','r');

for i=1:5
    fgetl(f);
end

for k=1:53

b = fgetl(f);
a = strsplit(b,' ');

%extraction of the specices name.
species_name = a{1};

%extraction of the local tempratures.
low_temp = str2double(a{end-3});
high_temp = str2double(a{end-2});
mid_temp = str2double(a{end-1});

%extraction of coeffiecients

co_eff = fgetl(f);
posi_E = strfind(co_eff,'E');

%coefficients (a) from 1st line of coefficients

a1 = str2double(co_eff(1:(posi_E(1)+3)));
a2 = str2double(co_eff((posi_E(1)+4):(posi_E(2)+3)));
a3 = str2double(co_eff((posi_E(2)+4):(posi_E(3)+3)));
a4 = str2double(co_eff((posi_E(3)+4):(posi_E(4)+3)));
a5 = str2double(co_eff((posi_E(4)+4):(posi_E(5)+3)));

%coefficients (a) from 2nd line of coefficients

co_eff1 = fgetl(f);
posi_E1 = strfind(co_eff1,'E');

a6 = str2double(co_eff1(1:(posi_E1(1)+3)));
a7 = str2double(co_eff1((posi_E1(1)+4):(posi_E1(2)+3)));
a8 = str2double(co_eff1((posi_E1(2)+4):(posi_E1(3)+3)));
a9 = str2double(co_eff1((posi_E1(3)+4):(posi_E1(4)+3)));
a10 = str2double(co_eff1((posi_E1(4)+4):(posi_E1(5)+3)));

%coefficients (a) from 3rd line of coefficients

co_eff2 = fgetl(f);
posi_E2 = strfind(co_eff2,'E');

a11 = str2double(co_eff2(1:(posi_E2(1)+3)));
a12 = str2double(co_eff2((posi_E2(1)+4):(posi_E2(2)+3)));
a13 = str2double(co_eff2((posi_E2(2)+4):(posi_E2(3)+3)));
a14 = str2double(co_eff2((posi_E2(3)+4):(posi_E2(4)+3)));


%temperature array creation

T = linspace(low_temp,high_temp,500);

R = 8.314;    %gas constant

%func call for calculating Cp, h, and s

for i=1:length(T)
    [Cp, h, s] = parsing(a1,a2,a3,a4,a5,a6,a7,a8,a9,a10,a11,a12,a13,a14,mid_temp,T,R);
end

% Calculating molecular weight and printing it.

molecular_Weight = wt(species_name);                     %func call for calculating molecular weight
fprintf('Molecular weight of %s = %f ', species_name, molecular_Weight);

%creating folder and changing the directory

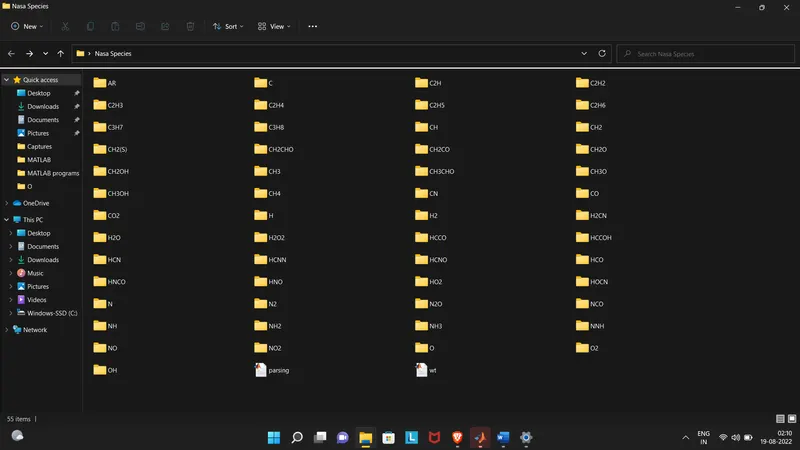
mkdir(['C:\Users\91987\Desktop\Nasa Species\',species_name])
cd(['C:\Users\91987\Desktop\Nasa Species\',species_name])

%plotting Cp vs T, h vs T, and s vs T.

figure(1)
plot(T,Cp,'LineWidth',2,'Color','y');
title(species_name);
grid on;
xlabel('Temperature (K)');
ylabel('Specific heat (KJ/K)');
saveas(1,'Specific Heat','jpg')

figure(2)
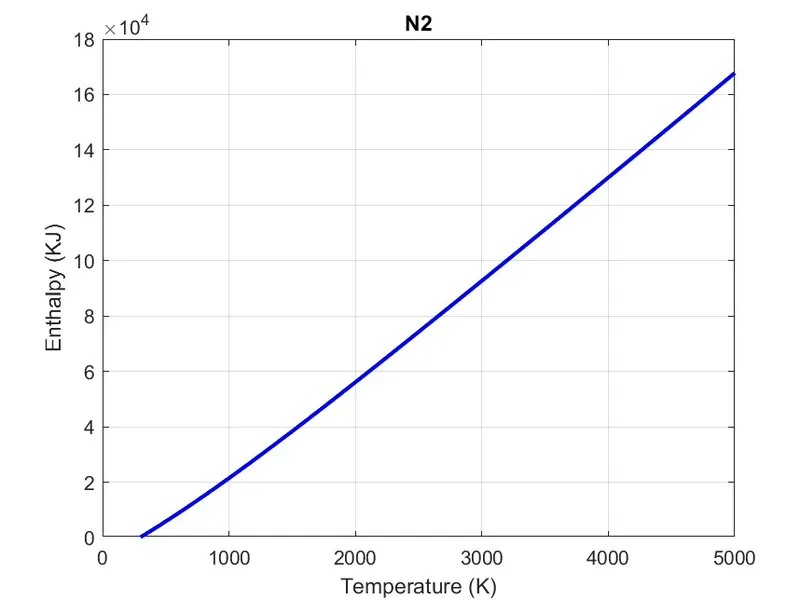
plot(T,h,'LineWidth',2,'Color','b');
title(species_name);
grid on;
xlabel('Temperature (K)');
ylabel('Enthalpy (KJ)');
saveas(2,'Enthalpy','jpg')

figure(3)
plot(T,s,'LineWidth',2,'Color','r');
title(species_name);
grid on;
xlabel('Temperature (K)');
ylabel('Entropy (KJ/K)');
saveas(3,'Entropy','jpg')
cd ..
end
File Parsing code explanation: -
- Initially loaded the data file and read it through fopen command.
- Skipped the 1st 5 lines using a small for loop.
- Used a large for loop in order to calculate and plot the graph for Cp, h, and s for all the 53 species.
- Get the next line from the data file with fgetl command and splited it with space delimiter using strsplit command.
- extraction of the species name and extraction of the local tempratures.
- extraction all the coeffiecients of a single specie and finding the postion of the E using strfind command
- Creating temperature array for 500 points due make curve smoother.
- Function call for calculating Cp, h, and s for every temperature point using for loop.
- Calculating molecular weight through molecular weight function call and printing it.
- creating a folder and changing the directory
- plotting Cp vs T, h vs T, and s vs T graphs for all the 53 species and saving them as jpg file.
- End of the large for loop.
Output: -
- Cp, h, and s graph for O2 specie: -
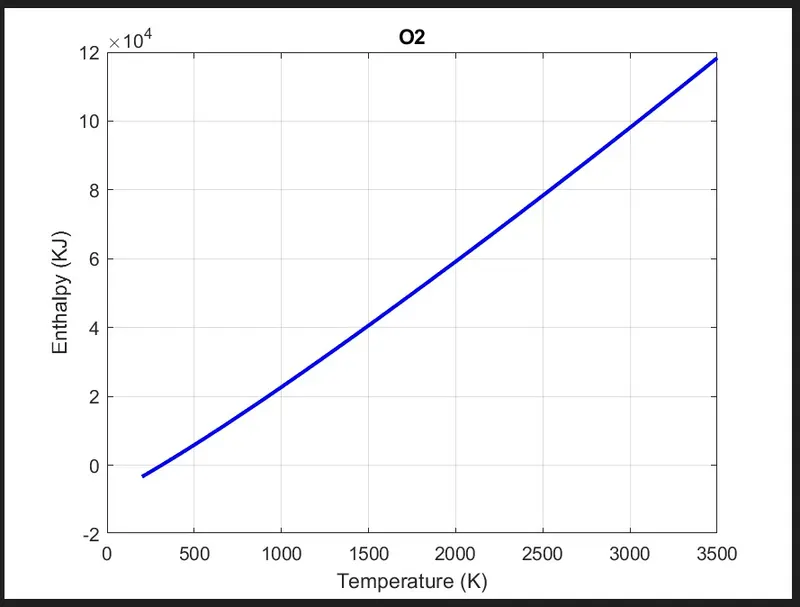
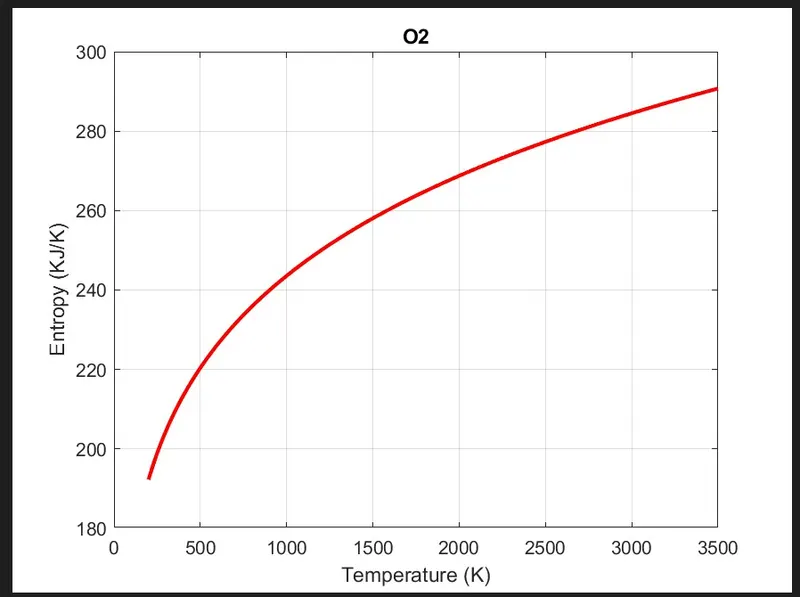
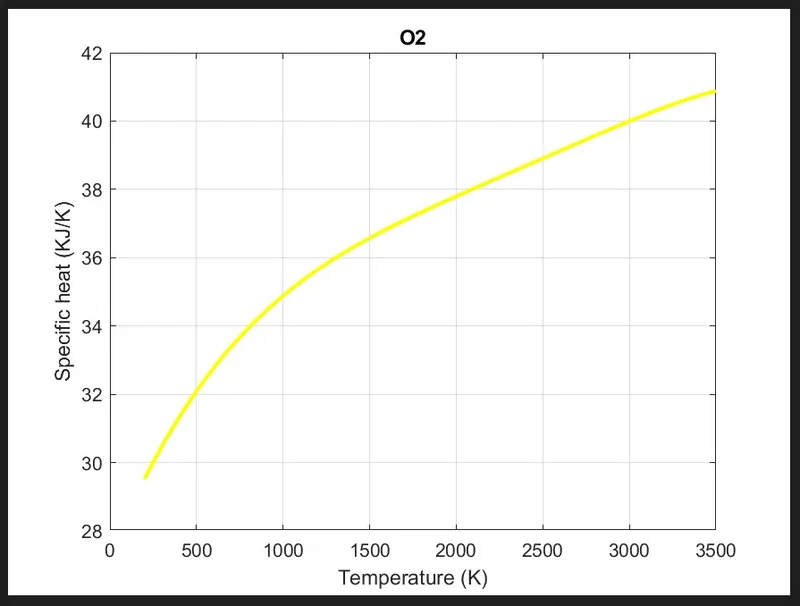
2. Cp, h, and s graph for N2 specie: -
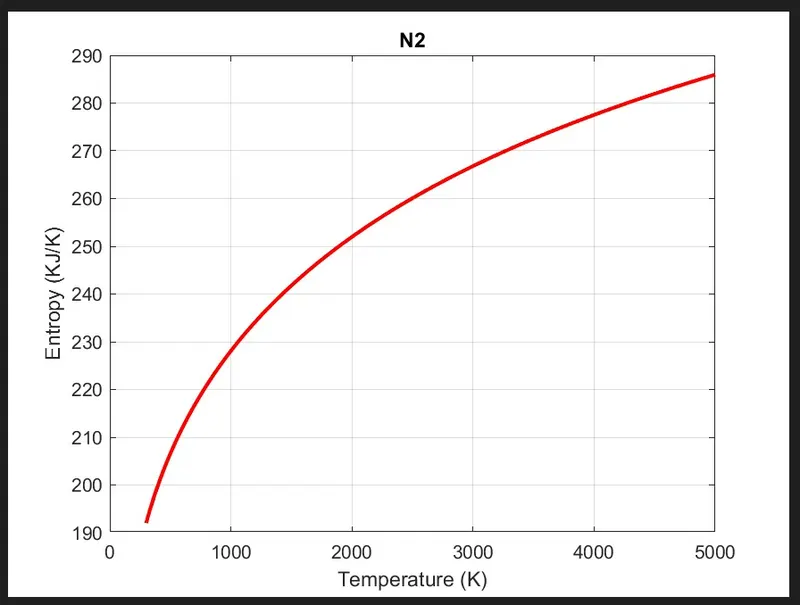
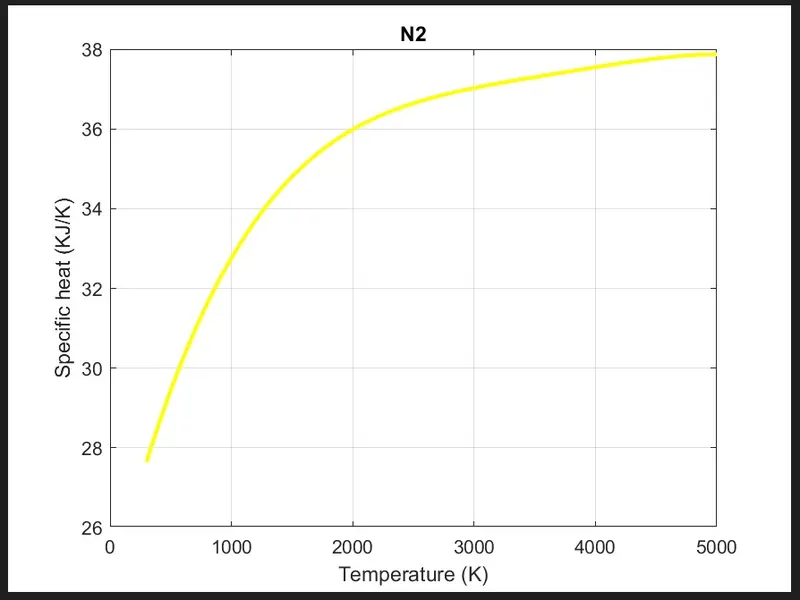
3. Cp, h, and s graph for CO2 specie: -
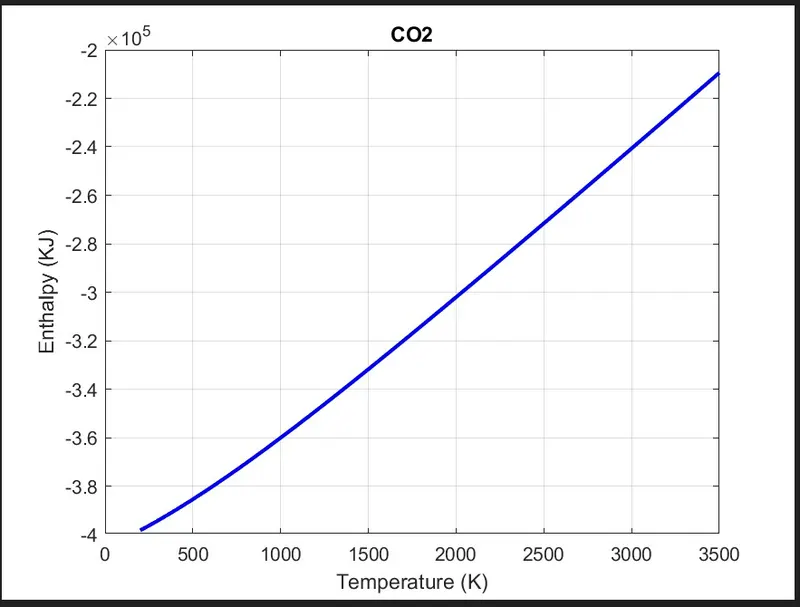
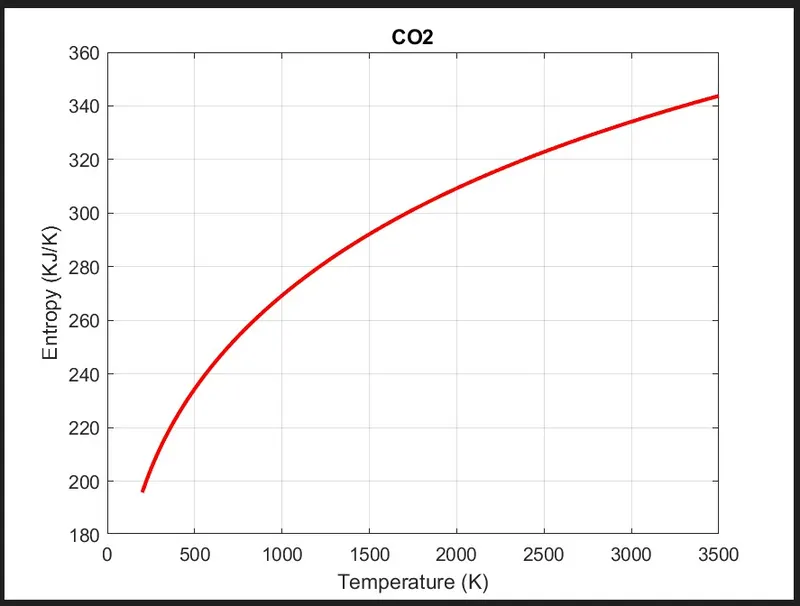
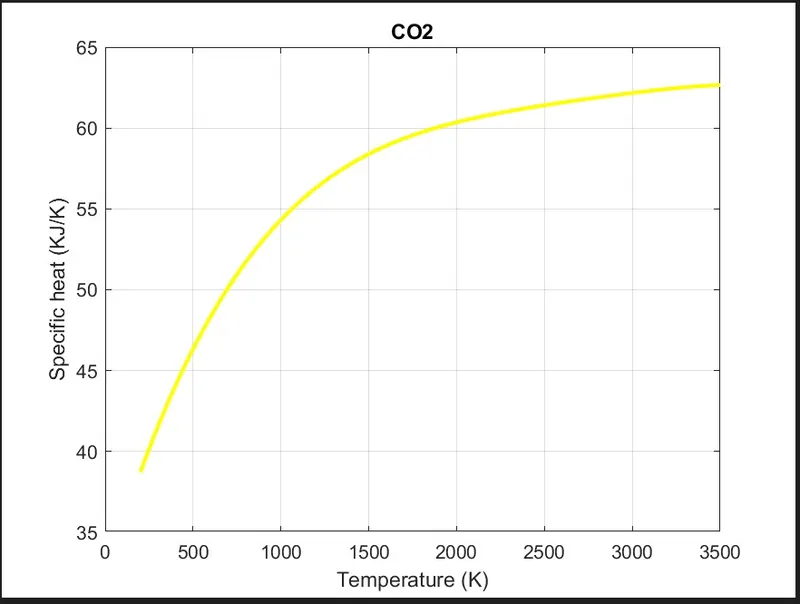
Folder screen shot of all the species graph are located: -
Error faced : –
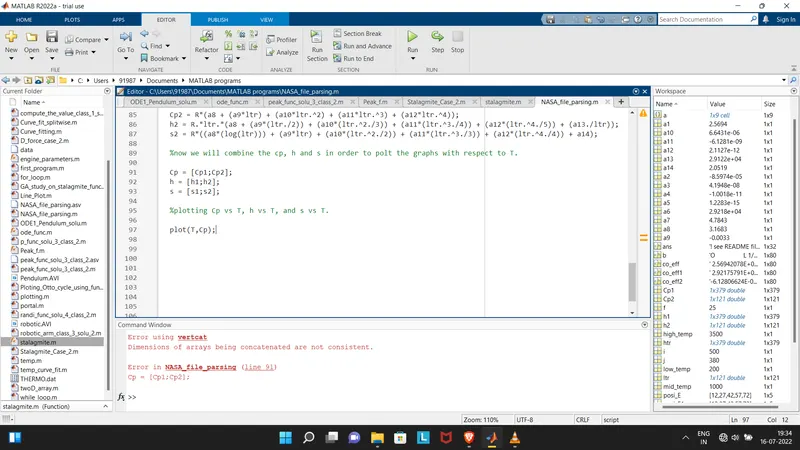
Dimensions of arrays being concatenated are not consistent because I was combing the Cp1 and Cp2, h1 and h2, s1 and s2 by using semicolon ; where the ; is used to create a next row in the matrix.
Overcoming the error: –
Analyzed the code again specifically the combining part and found I was using the ; instead of space in order to combine Cp1 and Cp2, h1 and h2, s1 and s2.