Week 3 - Solving second order ODEs
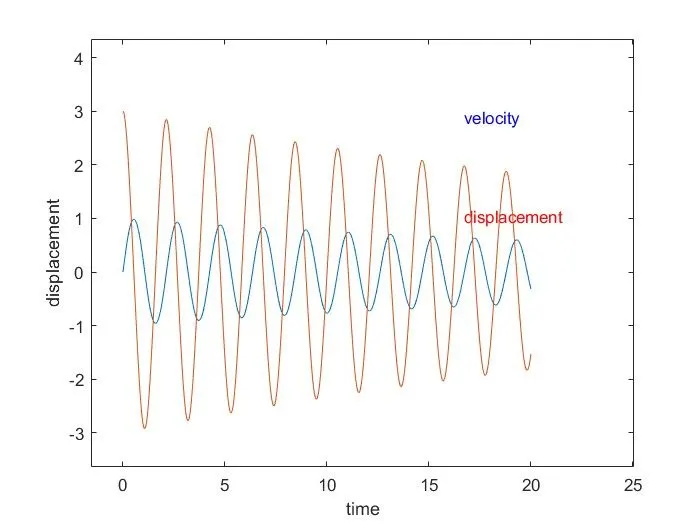
clear all
close all
clc
% Input parameters
b=0.05; % damping coefficient
g=9.81; % spring constant
l=1;    %length of linkage in meter
m=1; % mass of bob in kg

% initial condition
theta_0=[0,3];     % it denotes the swing angle

% time points
t_span = linspace(0,20,500);  % linspace command creates the array of values from 0 to 20 sec with 500numbers in between

%solve ode

[t, results]=ode45(@(t,theta) ode_func(t,theta,b,g,l,m),t_span,theta_0);
figure(1)
plot(t,results(:,1))  %plot command used to generate a plot  of  all results for 1st variable displacement
hold on
gtext('displacement','color','red')
plot(t,results(:,2))   % plot command is used for generating a graph of  2nd variable velocity
gtext('velocity','color','blue')
ylabel('displacement')         % ylabel nomenclates the y axis
xlabel('time')          % xlabel is used to nomenclates the x axis

ct=1;
theta1 = results(:,1); %theta 1 is variable assigned  for the displaement
for i=1:length(t_span) %for loop function staring from interation 1  till all values for t span
    r=theta1(i);       %r new variable assigned for all itrations of  theta 1
    figure(2)
    x0=0;
    y0=0;
    x1=l*sin(r);    %x1 is displacement of bob from x0 to x1 with an angle (r)is new variable for storing all values of theta dureing all itration
    y1=-l*cos(r);
    plot([x0 x1],[y0 y1],'linewidth',4) % plot the support
    hold on
    plot(x1,y1,'.','markers',50)  % while plotting the bob remember thatuse proper paranthesis with marker width
    hold on                        %hold on the plot frame
    plot([-5,5],[0,0],'linewidth',5)
    hold off
    axis([-9,9,-4,4])
    pause(0.05)                   % pause time for the animation after every frame.
    M(ct)=getframe(gcf);          %For all contors we get and store the gcf frames
    ct=ct+1;
end
movie(M)                         %creates the video file
videofile = VideoWriter('ode.m','Uncompressed AVI'); % store the video file in .avi format
open(videofile)
writeVideo(videofile,M)
close(videofile);
% Explanation of project
Aim- To solve ,plot and animate the second order diffrential equation useing matlab
% define the input parameters like
m=mass of bob
l=length of string
b=damping coefficient
g= Acceleration due to gravity
% Initial condition i.e displacement of bob
theta_0= 3 rad/sec -here note that angular displacement is in rad/sec so we should not use sind(theta) & cosd(theta) as theta is not given in degrees
%Defining time span for displacement
t_span = linspace(0,20,500);
here i created an array of time value range from 0 to 20 sec which contains 500 no of arbitory values.
% solveing ODE function i.e ode45
function dtheta_dt = ode_func(t,theta,b,g,l,m);
theta1=theta(1);
theta2=theta(2);
dtheta1_dt = theta2;
dtheta2_dt = -(b/m)*theta2-(g/l)*sin(theta1);
dtheta_dt = [dtheta1_dt;dtheta2_dt];
end
i have seperately defined the function .
ode_func is a function with the variables (t,theta,b,g,l,m)
defineing theta 1 as theta(1) angular displacement
theta2 is angular velocity i.e derivation of theta 1
Calling the function in main program
[t, results]=ode45(@(t,theta) ode_func(t,theta,b,g,l,m),t_span,theta_0);
soveing the above equation we get the values of displacement and velocity
% plotting the results for displacement and velocity vs time
plot(t,results(:,1)
results of displacement with respect to time are plotted in a graph
use hold on command for holding the frames
followed by
gtext('displacement','color','red')
this command is used to nomenclate the plot with displacement in red colour
syntax-gtext('text to be asign to plot')
plot(t,results(:,2))
plotted all results for velocity
- nomenclature used to define axis
xlabel('time')
ylabel('displacement')
% for loop fuction
for i=1:length(t_span)
r=theta1(i)
figure(2)
x0=0;
y0=0;
x1=l*sin(r);
y1=-l*cos(r);
plot([x0 x1],[y0 y1],'linewidth',4)
hold on
plot(x1,y1,'.','markers',50)
hold on
plot([-5,5],[0,0],'linewidth',5)
hold off
axis([-9,9,-4,4])
pause(0.05)
M(ct)=getframe(gcf);
ct=ct+1;
end
to assign all displacement of bob with time for loop is used .where itration beegins with 1 and ends with values of t_span.
r is the new variable used for defineing desplacement value for corresponding itration.
in this stage the support , final displacement of bob are plotted.
bob is been marked .all frames are clubed together by useing command M(ct)=getframe(gcf)
ct=ct+1 ......incrementing the contor by 1
% creating the animation file
movie(M) %creates the video file
videofile = VideoWriter('ode.m','Uncompressed AVI');
open(videofile)
writeVideo(videofile,M)
close(videofile);
% Errors faced dureing programming
1 in column no 20 semicolon was used instead of collen 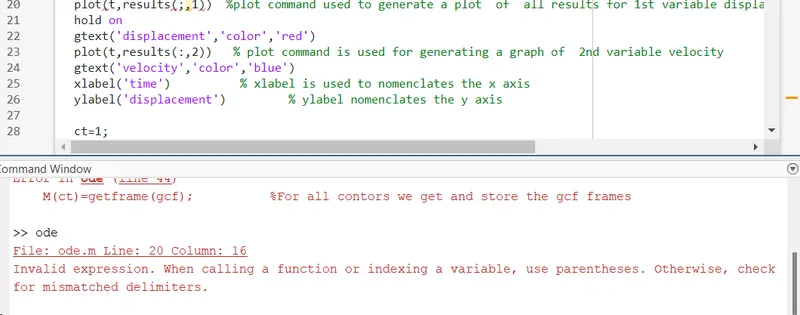
it was corrected by useing collen . so learning is that paranthesis is very very important in matlab.