Project 1 - Parsing NASA thermodynamic data
Aim- To calculate the thermal properties such as Specific heat, enthalpy,entropy for the given species by extracting the NASA themodynamic file.
Objectives-
1) Writing a script to extract the 14 coeffients and calculate the cp,h,s for all the given species.
2) to calculate the molecular weight of each species
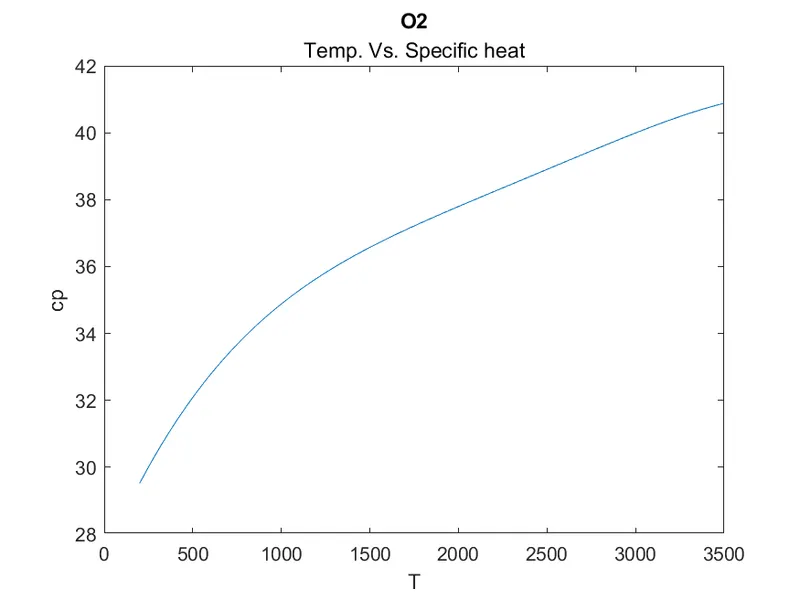
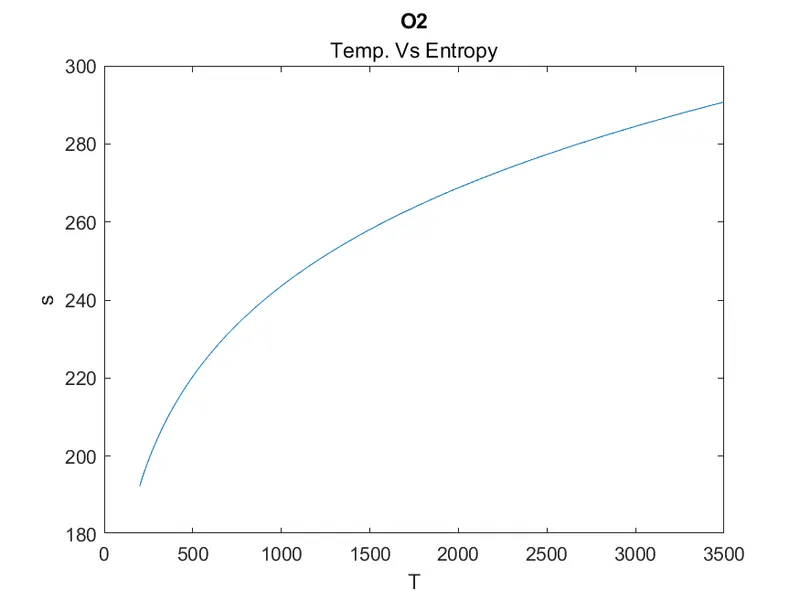
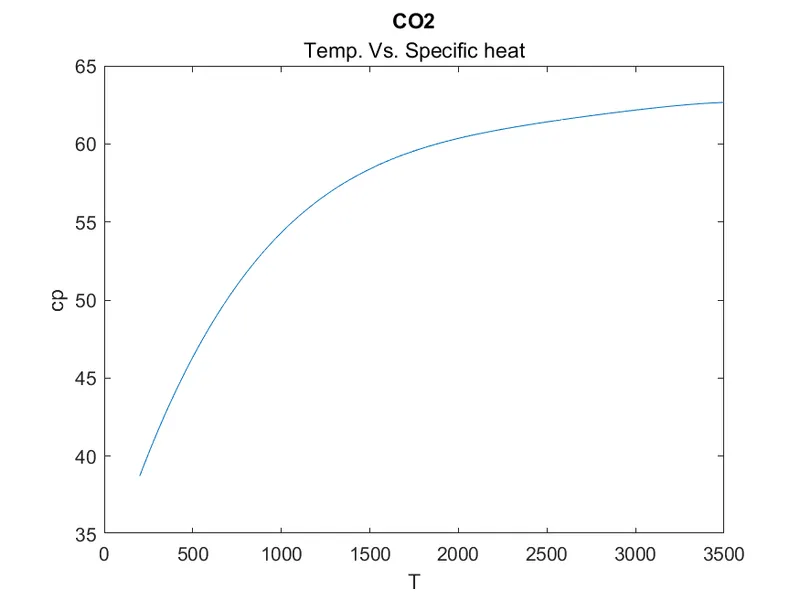
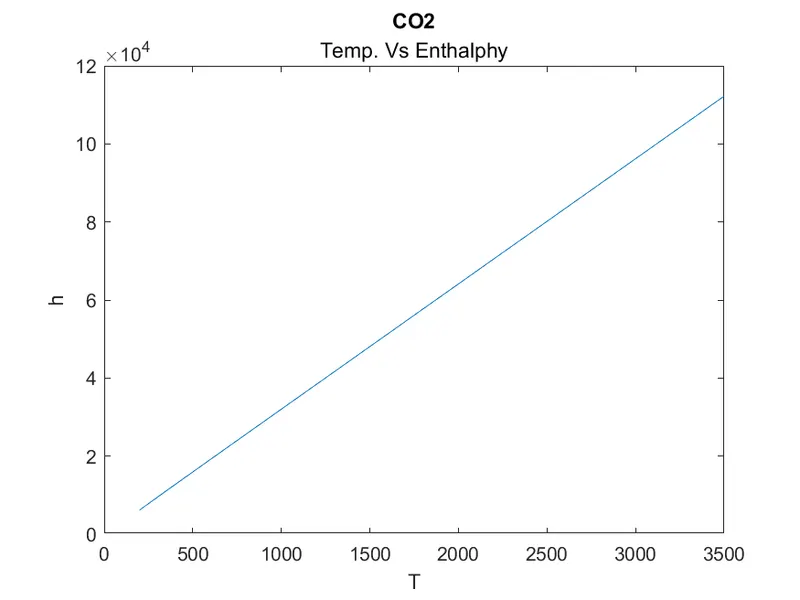
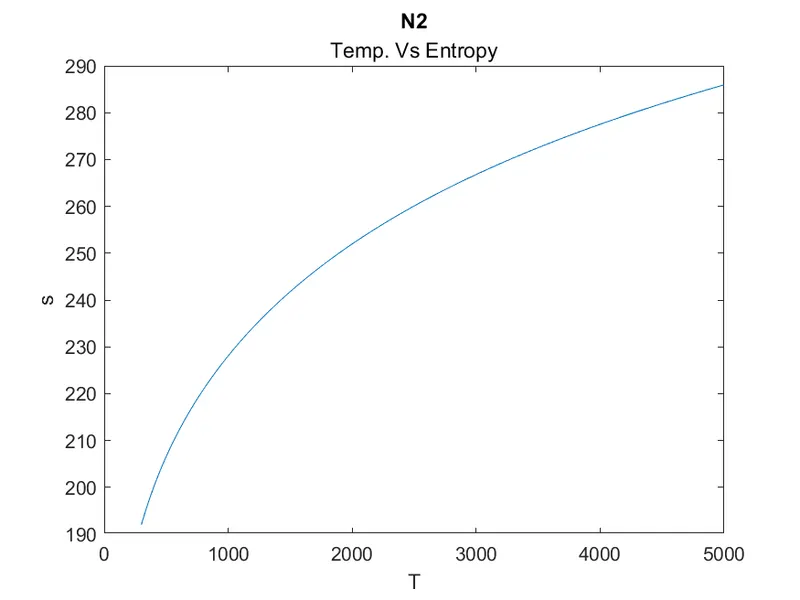
3) Plot the Cp, Enthalpy and Entropy for the local temperature range (low temperature : high temperature) specific for each species.
4) Save the plots as images with appropriate names and dump them in separate folders for each species with suitable name. All these should be generated automatically.
Inputs-
"THERMO.dat" file
Theory-
1)Specific heat capacity(cp)- this is the amount of heat stored into one a unit mass to raise its temperature by 1 kelvin. its SI unit is j/kg.k
2)Enthalphy(h)= it is the total amount of heat contained in a body. its Si unit is joule
3)Entropy(s)=It is the change in heat energy with respect to temperature. its SI unit is joule/kelvin
4) universal gas constant (R)=8.314 j/k.mole
Program Script -
%% Main program Script

clear
close
clc
% Nasa File Parsing Project
% Recalling the themodynamic file
F1=fopen('THERMO.dat','r');

%Extracting the data
for i=1:5
    fgetl(F1)
end

for i=1:53
    a=fgetl(F1);
b=strsplit(a,' ');
species=b{1};

% Evaluting molecular weight
    molecular_weight= molecule(species);
    fprintf('molecular_weight of %s is %f: ',species,molecular_weight);

% Extracting the Local temperatures

Low_temp=str2double(b{end-3});
High_temp=str2double(b{end-2});
Mid_temp=str2double(b{end-1});

%Extraction of Coefficient values
coeff= fgetl(F1);
pos=strfind(coeff,'E');
a1=str2double(coeff(1:pos(1)+3));
a2=str2double(coeff(pos(1)+4:(pos(2)+3)));
a3=str2double(coeff(pos(2)+4:(pos(3)+3)));
a4=str2double(coeff(pos(3)+4:(pos(4)+3)));
a5=str2double(coeff(pos(4)+4:(pos(5)+3)));

coeff2=fgetl(F1);
pos2=strfind(coeff2,'E');
a6=str2double(coeff2(1:pos2(1)+3));
a7=str2double(coeff2(pos2(1)+4:(pos2(2)+3)));
a8=str2double(coeff2(pos2(2)+4:(pos2(3)+3)));
a9=str2double(coeff2(pos2(3)+4:(pos2(4)+3)));
a10=str2double(coeff2(pos2(4)+4:(pos2(5)+3)));

coeff3=fgetl(F1);
pos3=strfind(coeff3,"E");
a11=str2double(coeff3(1:pos3(1)+3));
a12=str2double(coeff3(pos3(1)+4:(pos3(2)+3)));
a13=str2double(coeff3(pos3(2)+4:(pos3(3)+3)));
a14=str2double(coeff3(pos3(3)+4:(pos3(4)+3)));

%calculation of Specific heat(cp),enthalpy(H),entropy(s)
T=linspace(Low_temp,High_temp,500);% createing a temperature array
R=8.314;
[cp, h, s]= equation(a1,a2,a3,a4,a5,a6,a7,a8,a9,a10,a11,a12,a13,a14,R,T,Mid_temp);

%storing the plots in single directory
mkdir('Plots') % make new folder directory named as Plots
cd( 'C:\Users\91866\OneDrive\Desktop\rankine cycle\Plots') % Change directory
mkdir(species); %make new folder directory species
cd(species);%chage directory to species
figure(1)
plot(T,cp);
title(species,'Temp. Vs. Specific heat');
xlabel('T')
ylabel('cp')
figure(2)
plot(T,h);
title(species,'Temp. Vs Enthalphy')
xlabel('T')
ylabel('h')
figure(3)
plot(T,s);
title(species,'Temp. Vs Entropy')
xlabel('T')
ylabel('s')
saveas(figure(1),'Cp.png')
saveas(figure(2),'h.png')
saveas(figure(3),'s.png')
cd ..
cd ..
end

%%Function code to evaluate specific heat, enthalpy, entropy

function [cp, h, s] = equation(a1,a2,a3,a4,a5,a6,a7,a8,a9,a10,a11,a12,a13,a14,R,T,Mid_temp)
if T>=Mid_temp
        cp=R*(a8+(a9*T)+(a10*T.^2)+(a11*T.^3)+(a12*T.^4));
         h=R*T.*(a8+((a9*T)/2)+(a10*(T.^2)/3)+((a11*(T.^3)/4)+((a12*T.^4)/5)+(a13./T)));
         s=R*(a8.*log(T)+(a9*T)+((a10*T.^2)/2)+((a11*T.^3)/3)+((a12*T.^4)/4)+a14);
else
       cp=R*(a1+(a2*T)+(a3*T.^2)+(a4*T.^3)+(a5*T.^4));
         h=R*T.*(a1)+((a2)*T/2)+(a3*(T.^2)/3)+((a4*(T.^3)/4)+((a5*T.^4)/5)+(a6./T));
         s=R*(a1.*log(T)+(a2*T)+((a3*T.^2)/2)+((a4*T.^3)/3)+((a5*T.^4)/4)+a7);
end


%%Function code to evaluate the molecular weight of species


function [molecular_weight] = molecule(species)
constituents = {'H', 'C', 'N', 'O', 'A', 'S'};
atomic_weight = [1 12 14 16 40 32];
% Species=input(species);
molecular_weight = 0;
for i = 1:length(species)
    for j = 1:length(constituents)
        if strcmp(species(i),constituents(j))
            molecular_weight = molecular_weight + atomic_weight(j);
            u = j;
        end

    n = str2double(species(i));
    if n > 1
        molecular_weight = molecular_weight + atomic_weight(u)*(n-1);
    end
    end
end

%%
% output plots
1) Plots for o2
2) Plot for CO2
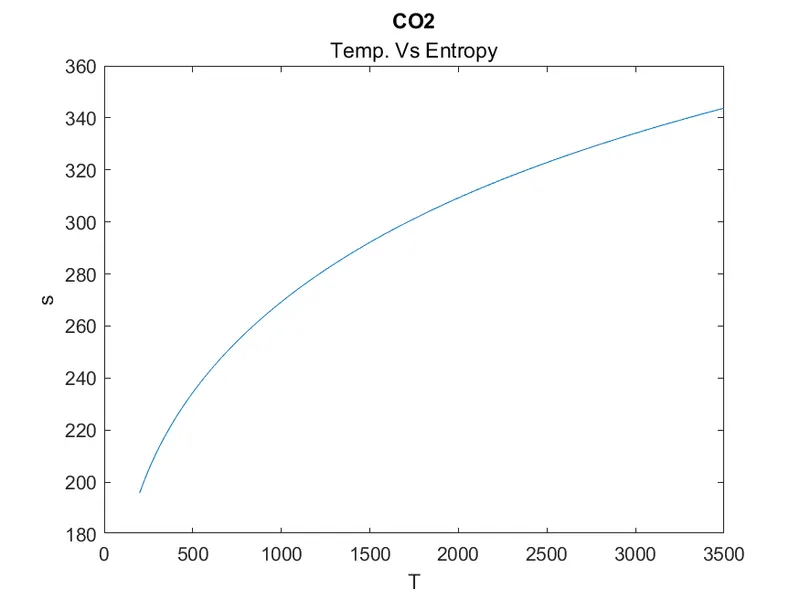
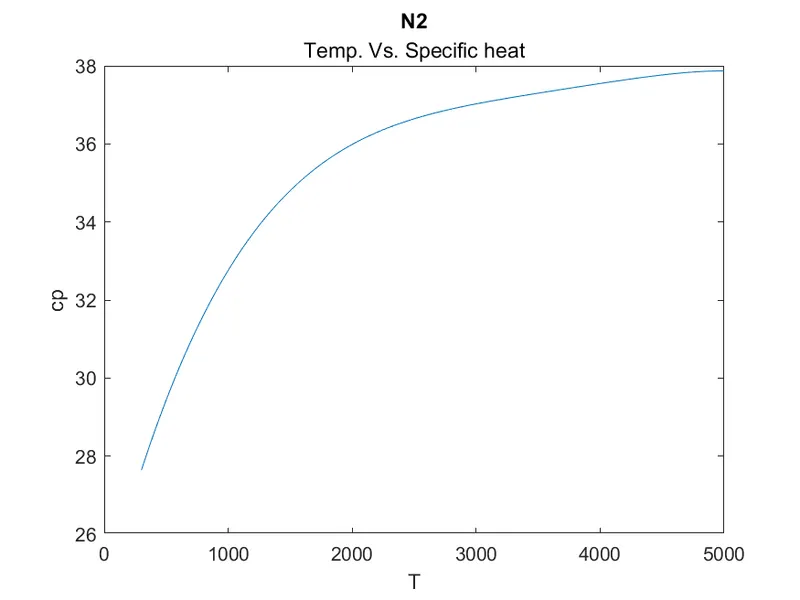
3) plots for N2
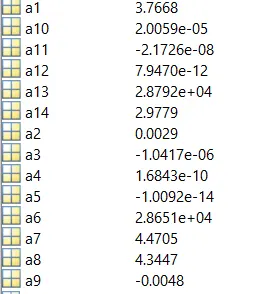
%%Coefficients
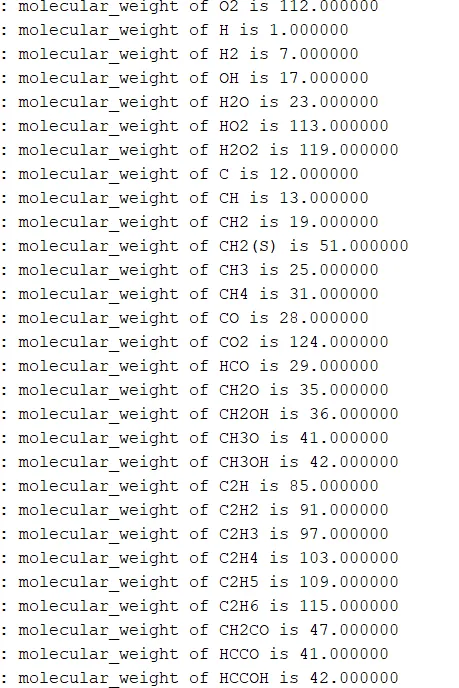
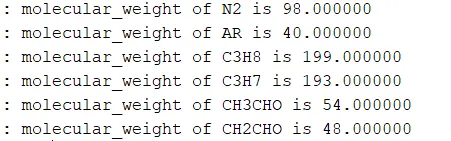
Molecular weight of species
% Directory
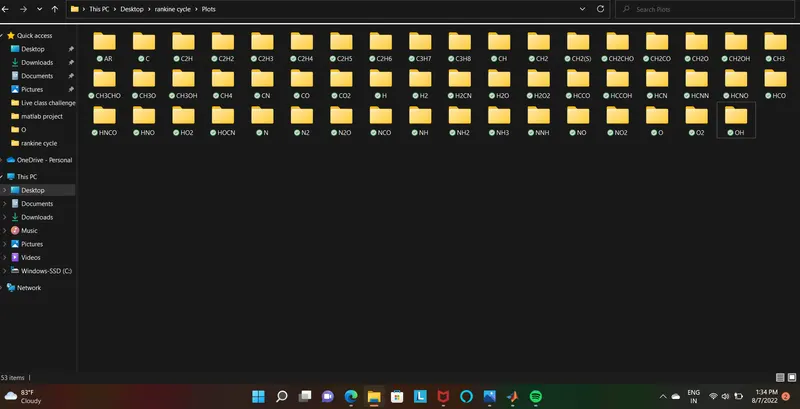
%% Explanation of the program script
line1-clear all is used to clear the previos stored variables
line 2-closes the previously open plots
line 3-clears the command window
line 6-we have used the 'fopen()' command to recall the external data file "THERMO.dat' file
line 9-line 11- for loop to read first 5 lines of the data file by useing "fgetl() command
line 13-we have to cover the entire thermodynamic species here we have 53 species hence tofor loop executes for 53 times
line 14-line 16-we have to get the species name , so for doing so we have splited the line a and then by doing indexing we got the species value.
line 19-Function used to calculate molecular weight.
line 20- print the calculated molecular weight in seperate line. by useing fprint f()
line 25-26-Indexing used for extracting low temp, mid tep, and high temp.
Line 29-line 50-Extracting coefficients(a1-a14)
line 53- Formulating the temperature array T
line 54-defining input value for R i.e universal gas constant
line 55- recalling the equation function to calculate cp,h &s for given conditions
line 58- created a directory to store all the plots in same folder plot function used is mkdir()
line 59-change the directory to the current directory by useing function cd
line 60-created a directory to store all the species in same folder plot function used is mkdir()
line 61-change the directory to the current directory by useing function cd
line 62-line76-plotting the graphs of T vs Cp;T vs h;T vs s;given titles labels to the graphs
line 77-79- saved all the plots in there respective folders.
end
%%Errors faced dureing programming
1.scripting the equation s.
error- invalid use of parenthesis
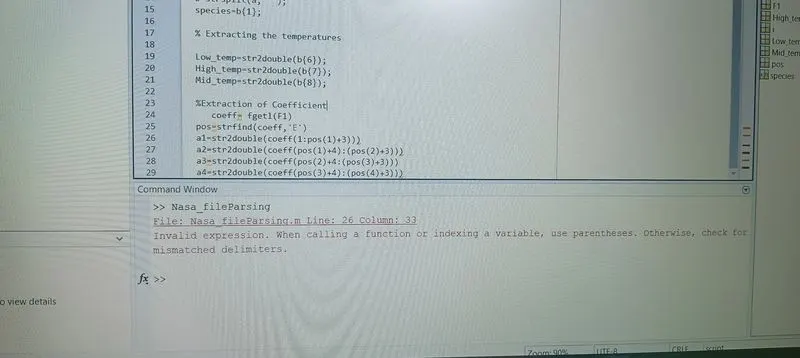
debug-removed '.' product
there were many errors occured dureing scripting , which were resolved after mentoring sessions.
%Conclusion
hence we have completed the NASA file parsing Project.