Week 3 - Solving second order ODEs using MATLAB.
AIM:
Solving second-order ODEs using MATLAB.
Challenge expectation:
- Write a program to solve the given ODE.
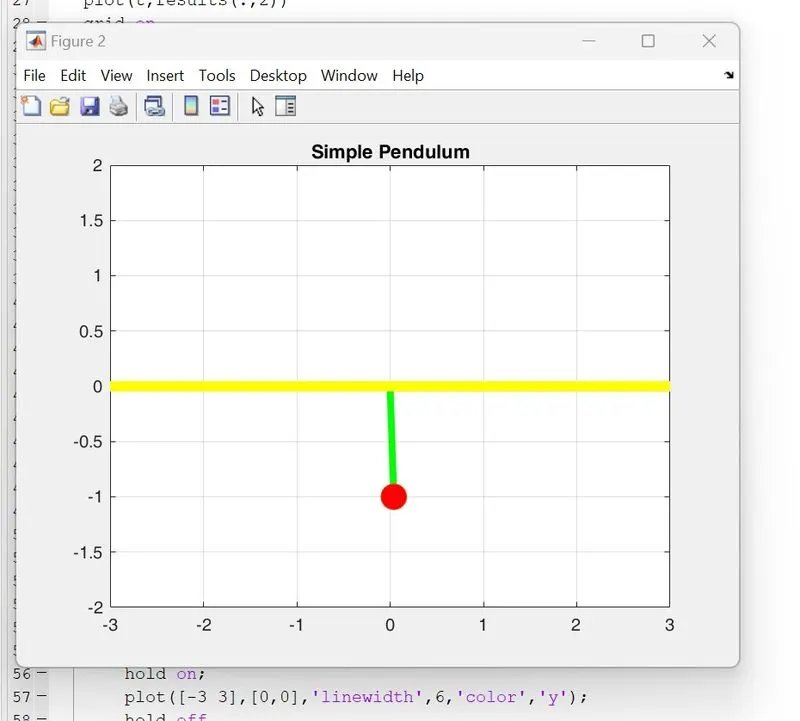
- To create an Animation file of a Pendulum motion.
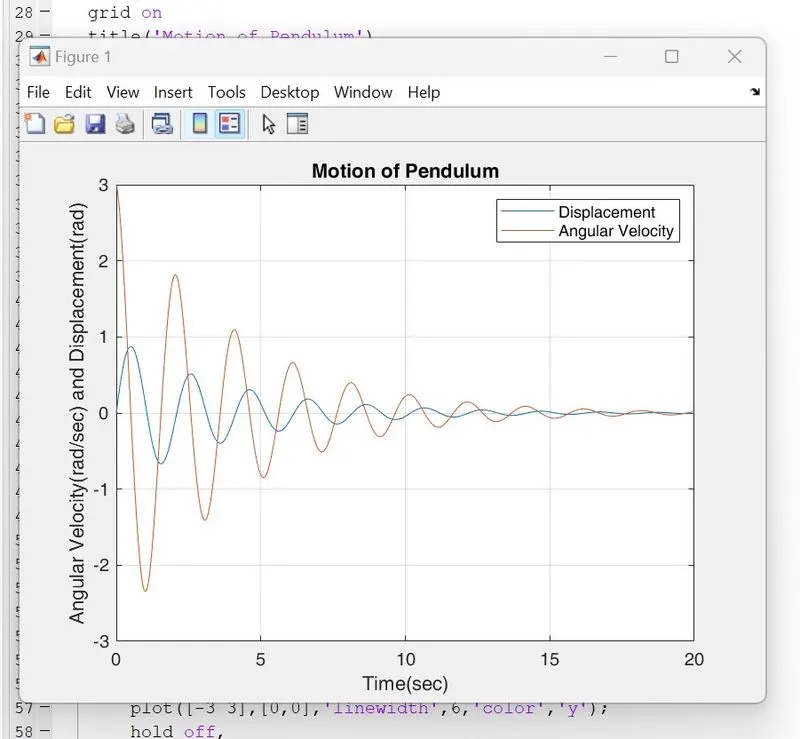
- To create a plot between Angular velocity and displacement.
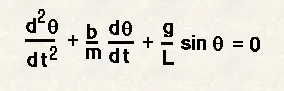
Solve this ODE :
CONCEPT:
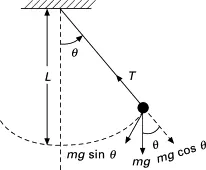
A simple pendulum is a mechanical arrangement that demonstrates periodic motion. The simple pendulum comprises a small bob of mass ‘m’ suspended by a thin string secured to a platform at its upper end of length L.
For small amplitudes, the period of such a pendulum can be approximated by:

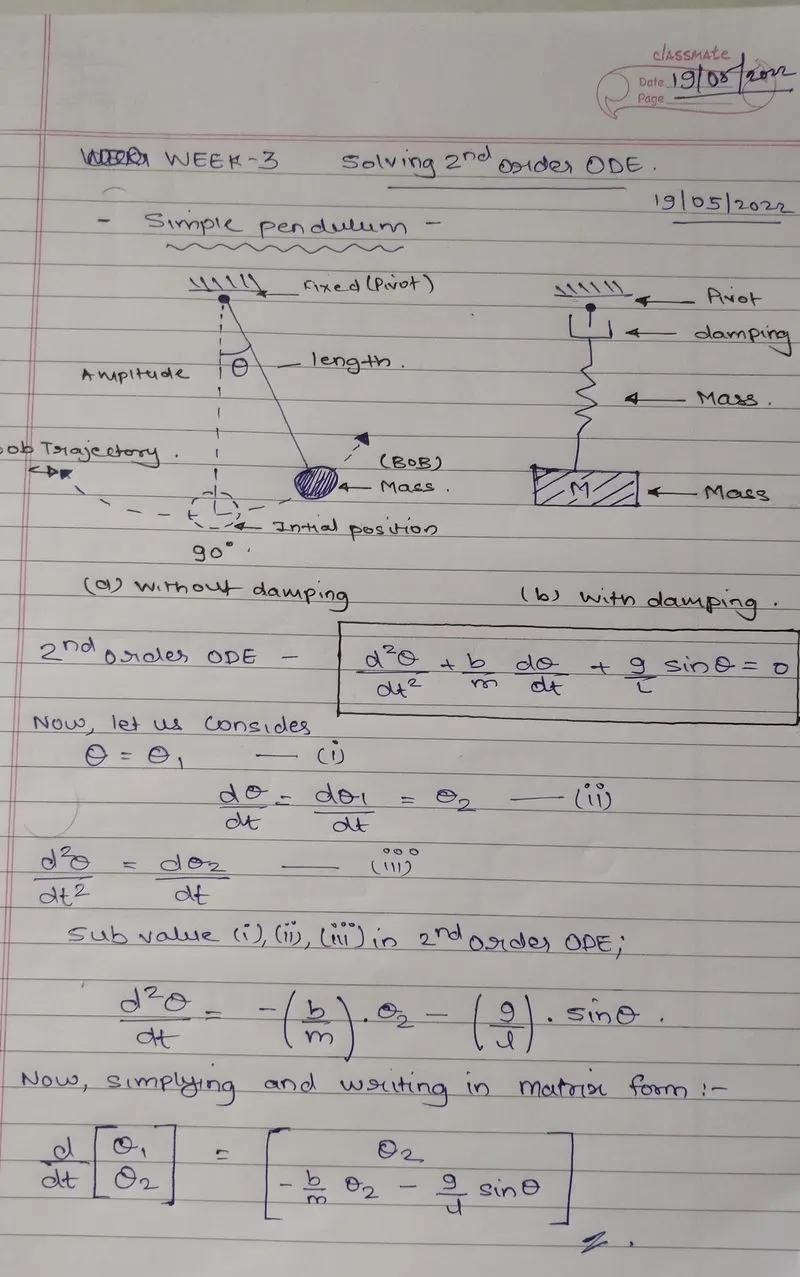
From the above equation with a damping factor, we know
b = damping co-efficient (N-m/s)
m = mass of the bob (kg)
g - the gravitational force
l = length of the string (m)
After simplifying the 2nd Order Equation now we can solve it in MATLAB using the ode45 solver and plot the required graph and make an animation of the pendulum.
PROCEDURE:
- Function code :
% Creating the Function to make code easier

function [dtheta_dt] = ode_func(t,theta,b,g,l,m)

theta1 = theta(1);
theta2 = theta(2);
dtheta1_dt = theta2;
dtheta2_dt =  -(b/m)*theta2 - (g/l)*sin(theta1);
dtheta_dt = [dtheta1_dt; dtheta2_dt];
end- Main code :
%  Program for a simple pendulum with damping

clear all
close all
clc

% Input Variables
b = 0.05;
g = 9.81;
l = 1;
m = 0.1;

% Intial Condition
theta_0 = [0;3];

% Time points
t_span = linspace(0,20,500);


% Function to solve 2nd order ODE
[t, results] = ode45(@(t,theta) ode_func(t, theta, b,g,l,m),t_span, theta_0);

% Plotting Angular Velocity and displacement
figure(1)
plot(t,results(:,1))
hold on
plot(t,results(:,2))
grid on
title('Motion of Pendulum')
ylabel('Angular Velocity(rad/sec) and Displacement(rad)')
xlabel('Time(sec)')
legend ('Displacement','Angular Velocity')

angle = results(:,1);

% Counter command
ct = 1

for i = 1 : length(angle)
    omega = angle(i);
    figure(2)
    title('Motion of Pendulum')

    % Simple Pendulum At Fixed Side
    x0 = 0;
    y0 = 0;

    % Co-ordinates of bob
    x1 = 1*cos((3*pi/2)+omega);
    y1 = 1*sin((3*pi/2)+omega);

    % Plotting of Bob Motion
    plot([x0 x1],[y0 y1],'linewidth',4,'color','g');
    hold on;
    plot(x1,y1,'o','markers',15,'markerFaceColor','r');
    hold on;
    plot([-3 3],[0,0],'linewidth',6,'color','y');
    hold off,
    axis([-3 3 -2 2])
    grid on
    title('Simple Pendulum')
    pause(0.3)
    M(ct) = getframe(gcf);
    ct = ct+1;
end

% To create Animation of Simple Pendulum
movie(M)
videofile = VideoWriter('simple_pendulum.avi','Uncompressed AVI');
open(videofile)
writeVideo(videofile,M)
close(videofile)
CODE EXPLANATION:
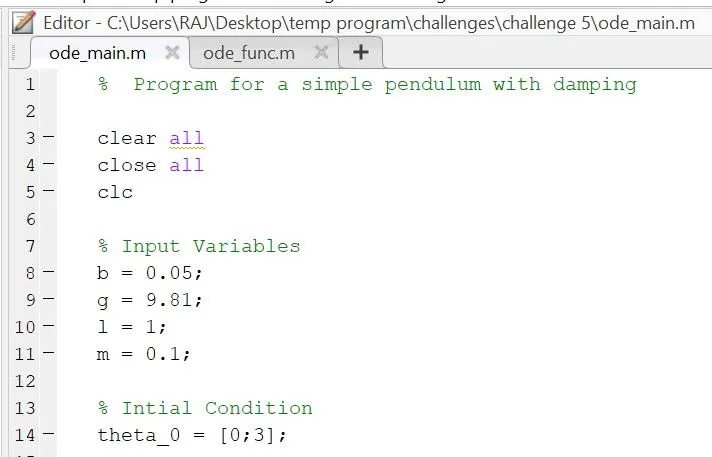
Line 1 to 5 - Giving comments and adding basic commands
clear all - To clear all the variables from the current workspace.
clc - Clear all the texts from the command window.
close all - Close all figures whose handles are visible.
Line 07 to 14 - Defining the user-defined inputs.
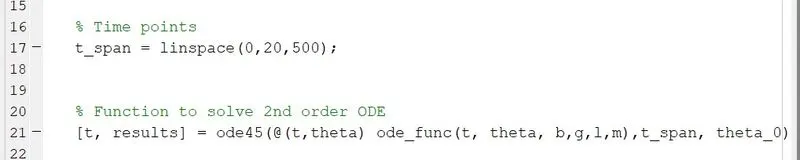
t_span - this command is used in the ode45 solver which specifies the timespan of the iterations.
linspace - The linspace function generates linearly spaced vectors.
Line 15 to 18 - Using the t_span command to add the intervals in between iterations.
Line 20 to 22 - Adding the function and using the ode45 solver we are solving the equation.
ode45 - is a function in MATLAB that solves an ordinary or partial differential equation using a numerical method.
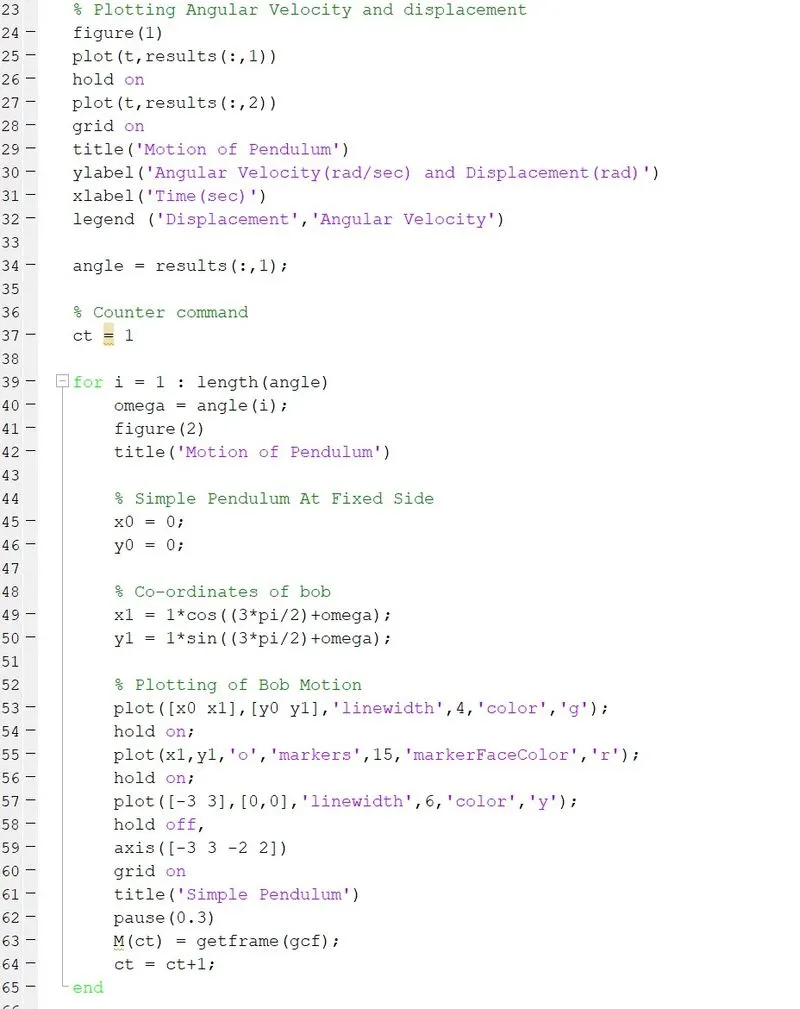
Line 23 to 32 - plotting a graph for angular velocity and displacement using various basic commands.
Line 36 to 38 - secondly a counter command a gave it the value 1.
Line 39 to 50 - for the loop to create the specified set points to keep the bob at different locations.
assigning the value of omega as angle (i) also defined the value of x0 and y0 points. and calculated the value of x1 and y1.
Line 52 to 65 - Now, plotting the graph in which first we gave the command to show the bob rod length and the bob by using basic commands like hold on, hold off and pause command to execute all commands simultaneously.
plot - This command is used to Plot Graph.
Linewidth - The line width command is given to the width of the line which is going to be plotted on a graph.
title - For giving title to the graph.
legend - It is used for indication of the line.
axis - For assigning axis to the plot.
pause - Command stops MATLAB execution temporarily.

line 66 to 72 - Creating a video file to store the animation.{movie(M)}
movie - Command used to make a movie.
videofile - main video file stores here.
close - Close command closes the file in the end.
.avi - Extension in which the video file gets saved.
VIDEO LINK:
https://drive.google.com/file/d/1TGAduU6eoOMoV7MV-lnNZyA4UtNqcMDm/view?usp=sharing
RESULTS:
ERRORS WHILE PROGRAMMING:
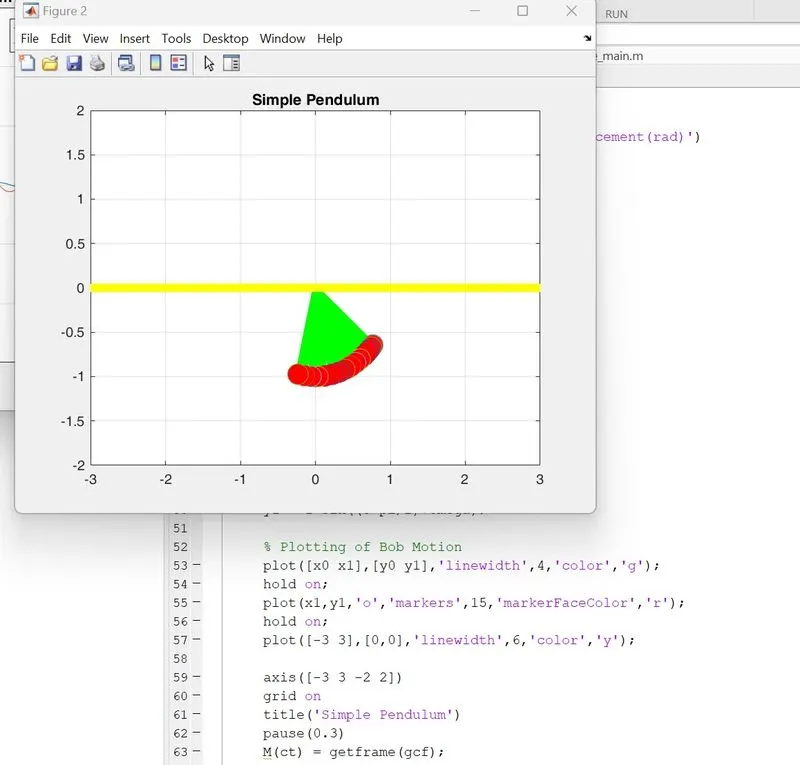
Forgot to add the 'hold off' command with allows the plot to clear the before axes while creating new plots.