Week 3 - Solving second order ODEs
Objective:
To write a MATLAB program to solve the second order Ordinary Differential Equation which represents the equation of motion of simple pendulum with damping.
Theory:
A simple pendulum is a mechanical arrangement that describes the periodic motion.The simple pendulum comprises a small bob of mass 'm' suspended by a thin string secured to a platform at its upper end of length L. The simple pendulum is a mechanical system that sways or moves in an oscillatory motion.
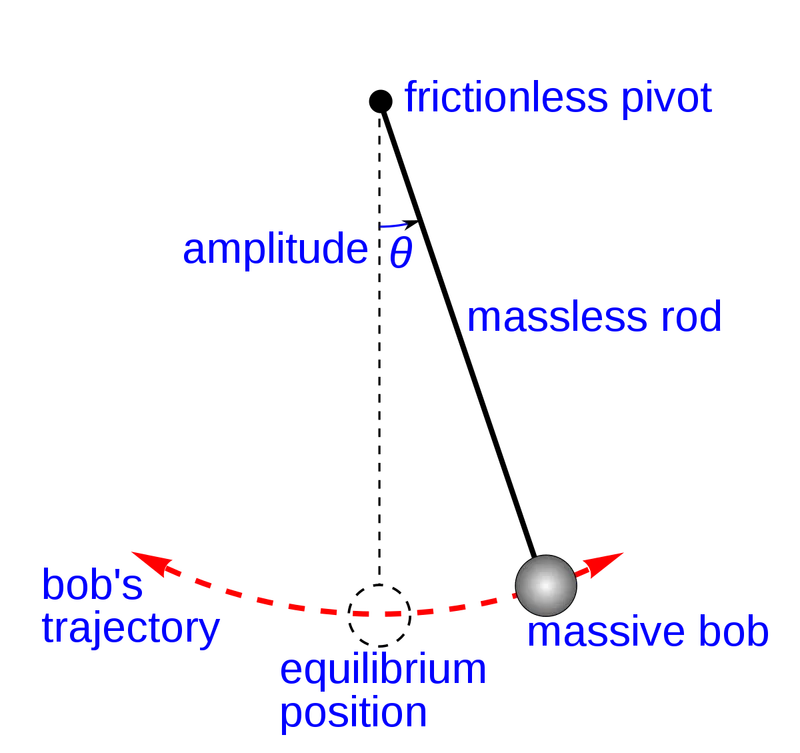
Ordinary Differential Equation is used to describe the transient behaviour of the system in Engineering. The way in which the pendulum moves depends on the Newton's Second law. We obtain a second order ODE that demonstrates the position of the bob with respect to time.
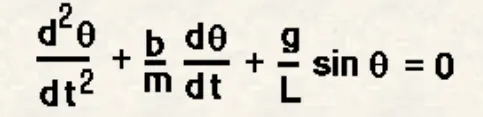
The above shown ODE describes the equation of a simple pendulum with damping. In this equation,
g = gravity (m/s^2)
L = length of simple pendulum (m)
b = damping coefficient
m = mass of the bob (kg)
Description:
MATLAB has an inbuilt function called "ode45" to solve Ordinary Differential Equation. We cannot solve the second order ODE in MATLAB directly. Inorder to solve using ode45 function, we have to break down the second order ODE to 2 first order ODEs.
In the experiment,
b = 0.05
m = 1 kg
g = 9.81 m/s^2
l = 1 m
Initial angular displacement = 0
Initial angular velocity = 3 rad/sec
MATLAB Program:
Function Program:
function [dtheta_dt]=ode_func(t,theta,b,g,l,m)

      theta1=theta(1);
      theta2=theta(2);
      dtheta1_dt=theta2;
      dtheta2_dt=-(b/m)*theta2 - (g/l)*sin(theta1);
      dtheta_dt = [dtheta1_dt;dtheta2_dt];
end
Main Program:
clear all
close all
clc

b = 0.05;
g = 9.81;
l = 1;
m = 1;

% Initial condition
theta_0 = [0;3];

% Time points
time_span = linspace(0,20,200);

% Solve ODE
[t,results] = ode45(@(t,theta) ode_func(t,theta,b,g,l,m),time_span,theta_0);

% Plotting
figure(1)
hold on
plot(t,results(:,1))
plot(t,results(:,2))
xlabel('Time')
grid on
legend('Angular displacement Vs Time','Angular Velocity Vs Time')

THETA= results(:,1);

ct=1;
for i=1:length(THETA)
    Theta= THETA(i)
    x0=0;
    y0=0;
    x1= l*sin(Theta);
    y1= -l*cos(Theta);

    figure(2)
    plot([x0 x1],[y0 y1],'linewidth',3,'color','b')
    hold on
    plot([-2 2],[0 0],'linewidth',2,'color','c')


    hold on
    plot(x1,y1,'marker','.','markersize',50)
    axis([-2.5 2.5 -2 2])
    M(ct)=getframe(gcf)
    ct=ct+1;
    hold off
end

% Animation of simple pendulum motion
movie(M)
videofile=VideoWriter('simple_pendulum.avi','Uncompressed AVI')
open(videofile)
writeVideo(videofile,M)
close(videofile)
Explanation:
linspace - This MATLAB function returns a row vector of 100 evenly spaced points between x1 and x2.
function - This MATLAB function declares function name, inputs, and outputs.
clear all - This MATLAB function removes all variables from the current workspace, releasing them from system memory.
close all - This MATLAB function closes the current figure.
clc - This MATLAB function clears all the text from the Command Window, resulting in a clear screen.
ode45 - This MATLAB function, where tspan = [t0 tf], integrates the system of differential equations y'=f(t,y) from t0 to tf with initial conditions y0.
hold on - This MATLAB function retains plots in the current axes so that new plots added to the axes do not delete existing plots.
plot - This MATLAB function creates a 2-D line plot of the data in Y versus the corresponding values in X.
xlabel - This MATLAB function labels the x-axis of the current axes or standalone visualization.
legend - This MATLAB function creates a legend with descriptive labels for each plotted data series.
grid on - This MATLAB function displays the major grid lines for the current axes returned by the gca command.
getframe - This MATLAB function captures the current axes as it appears on the screen as a movie frame.
hold off - This MATLAB function sets the hold state to off so that new plots added to the axes clear existing plots and reset all axes properties.
movie - This MATLAB function plays the movie frames in array M once.
videoWriter - Use a VideoWriter object to create a video file from an array or MATLAB movie.
open - This MATLAB function opens the file associated with v for writing.
writeVideo - This MATLAB function writes data from an array to the video file associated with v.
close - This MATLAB function closes the video file associated with v.
Results:
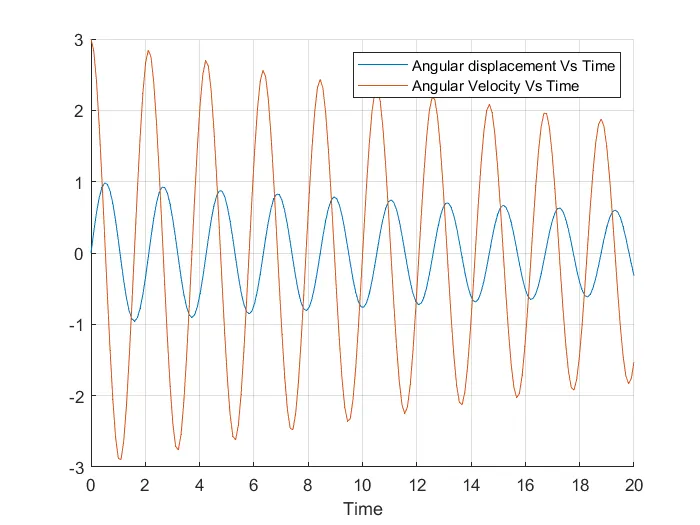
The graph plotted between 'Angular displacement Vs Time' and 'Angular velocity Vs Time' is shown below.
The youtube link for the animation showing the transient behaviour of simple pendulum is given below.