Project 1 - Parsing NASA thermodynamic data
Objective:
To write a code in MATLAB to parse the NASA thermodynamic data file and calculate the thermodynamic properties of various gas properties.
1.To write a function that extracts the 14 co-efficients and calculates the enthalpy, entropy and specific heats for all the species in the data file.
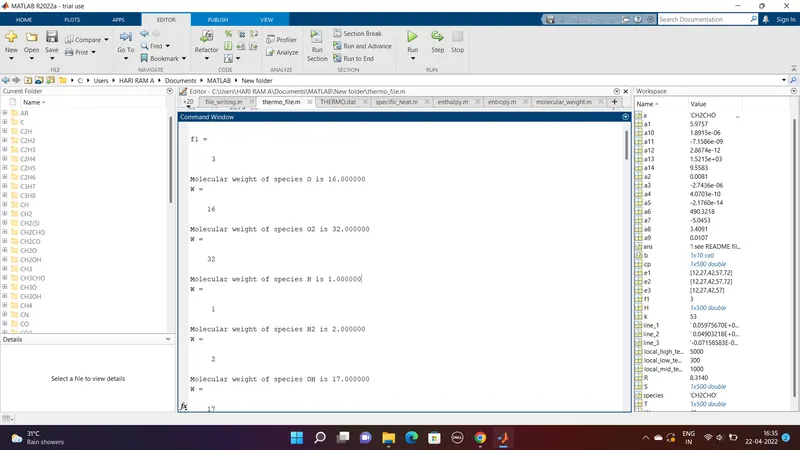
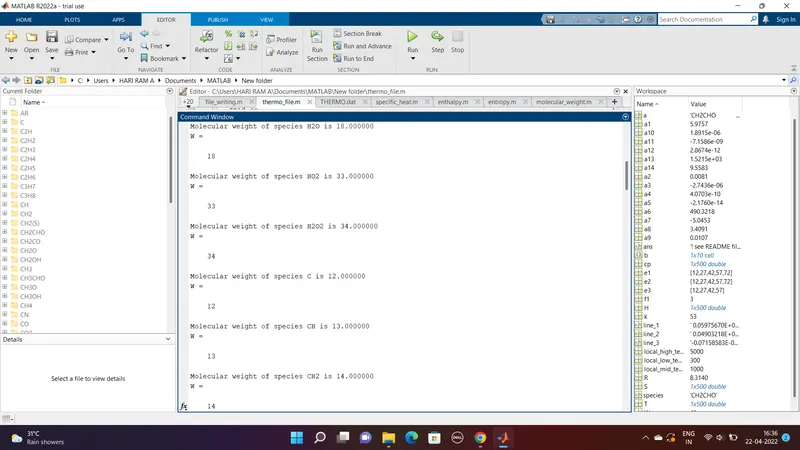
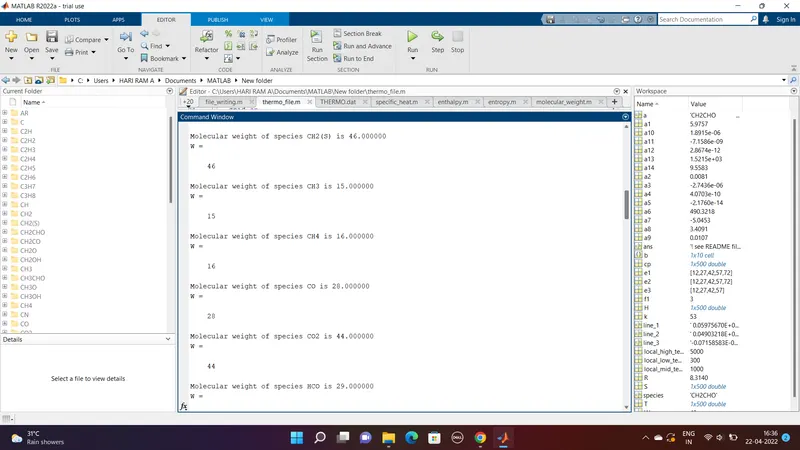
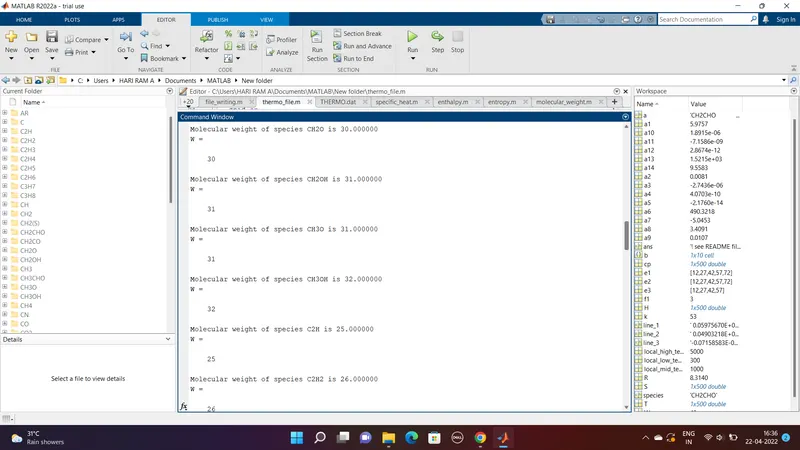
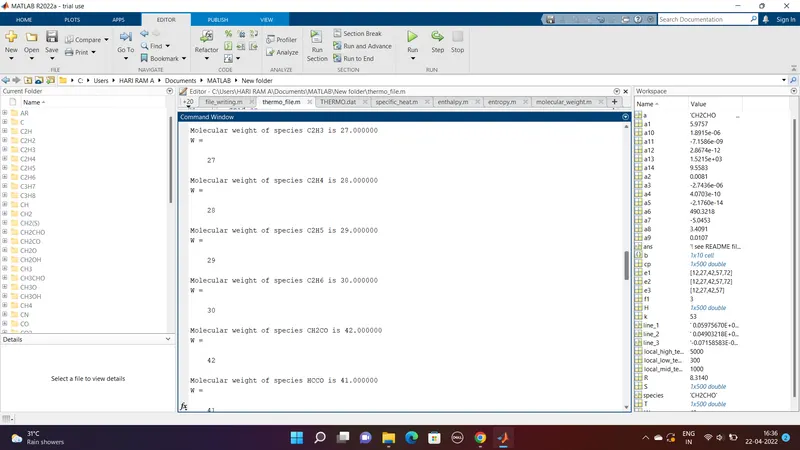
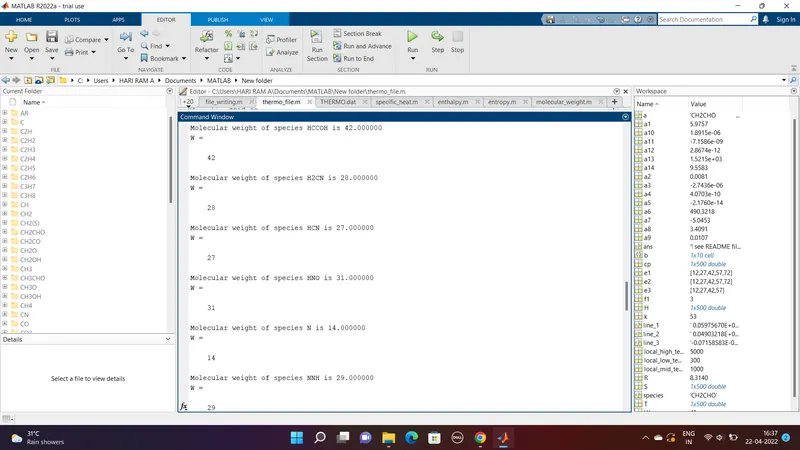
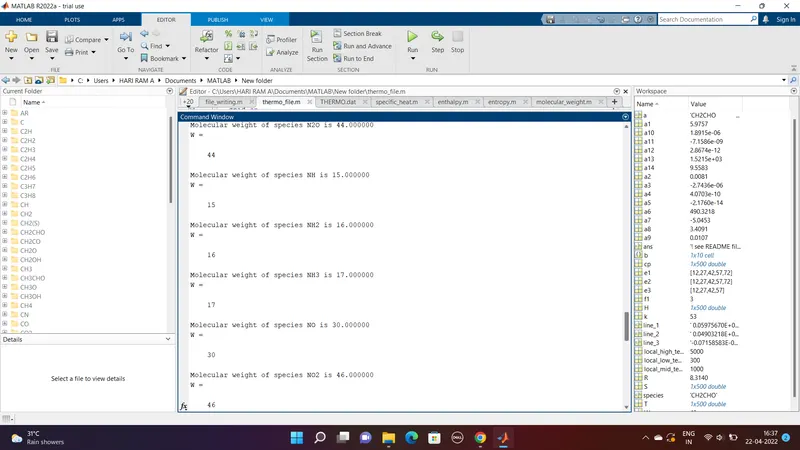
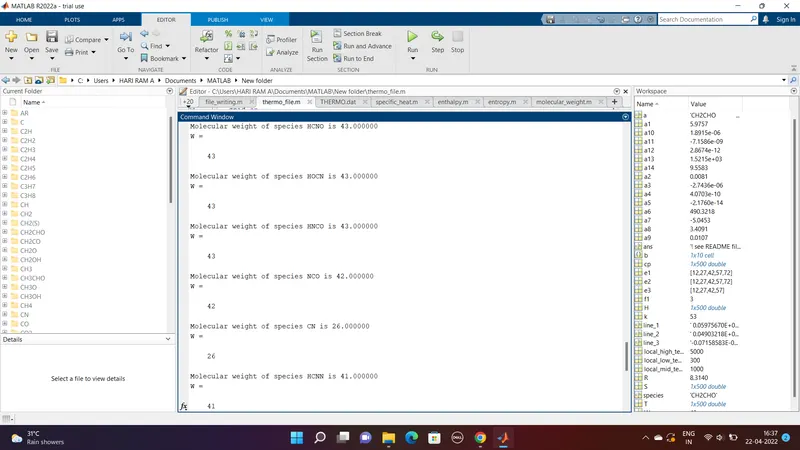
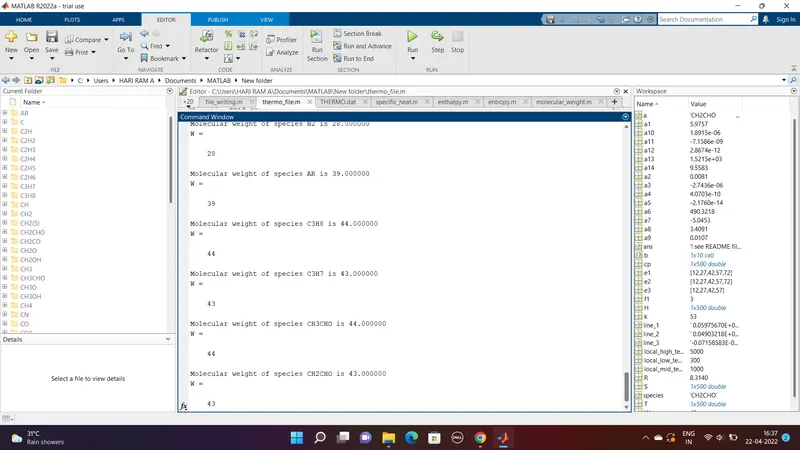
2. To calculate the molecular weight of each species and display it in command window.
3. Plot the Cp, Enthalpy and Entropy for the local temperature range (low temperature : high temperature) specific for each species.
4. Save the plots as images with appropriate names and dump them in separate folders for each species with suitable name. All these should be generated automatically.
Theory:
File parsing is the technique used to read information from a particular text file and how that information can be used in the computer program. It also means reading in a data stream and building a memory model of the content of that data.
NASA Thermodynamic file:
Thermo.dat file is a data file containing 14 coefficients for 53 different elements given by NASA. These coefficients are utilized to calculate the specific heat, enthalpy, entropy and molecular weight for a particular element.Each element has its own range of local temperature.
The NASA polynomials have the form:
Cp/R = a1 + (a2*T) + (a3*T^2) + (a4*T^3) + (a5*T^5)
H/RT = a1 + ((a2*T)/2) + (a3*T^2)/3) + ((a4*T^3)/4) + ((a5*T^4)/5) + (a6/T)
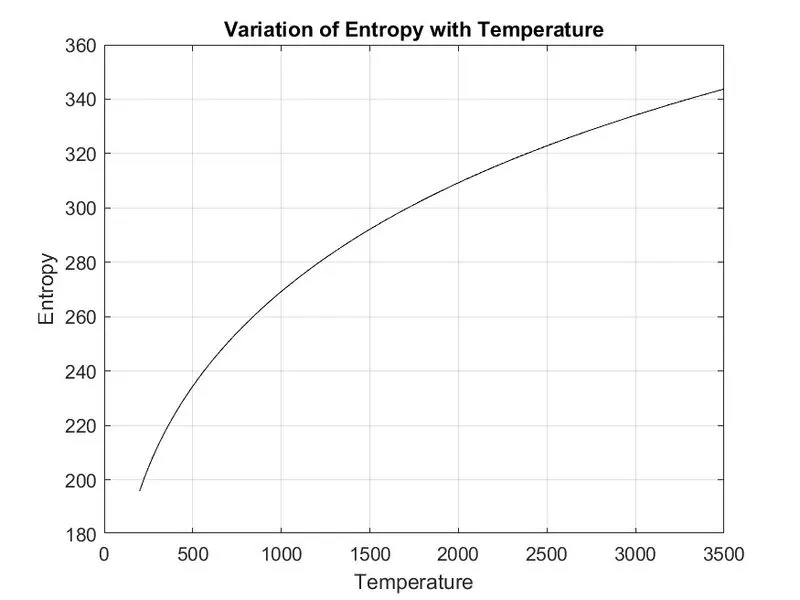
S/R = a1*lnT + a2*T + ((a3*T^2)/2) + ((a4*T^3)/3) + ((a5*T^4)/4) + a7
- Specific Heat:
It is the amount of energy that must be added, in the form of heat, to one unit of the mass of substance inorder to cause an increase of one unit in its temperature.
Cp = [a1 + (a2*T) + (a3*T^2) + (a4*T^3) + (a5*T^5)]*R
- Enthalpy:
Enthalpy is equal to the system's internal energy plus the product of its pressure and volume. It is the property of the thermodynamic system. The total enthalpy of a system cannot be measured directly because the internal energy contains components that are unknown, not easily accessible, or are not of interest in thermodynamics. In practice, a change in enthalpy is the preferred expression for measurements at constant pressure because it simplifies the description of energy transfer. When transfer of matter into or out of the system is also prevented and no electrical or shaft work is done, at constant pressure the enthalpy change equals the energy exchanged with the environment by heat.
H = [a1 + ((a2*T)/2) + (a3*T^2)/3) + ((a4*T^3)/4) + ((a5*T^4)/5) + (a6/T)]*R*T
- Entropy:
Entropy is a scientific concept as well as a measurable physical property that is most commonly associated with a state of disorder, randomness, or uncertainty. It is the measure of the system's thermal energy per unit temperature that is unavailable for doing useful work. The concept of entropy provides deep insight into the direction of spontaneous change for many everyday phenomena.
S =[( a1*lnT) + (a2*T) + ((a3*T^2)/2) + ((a4*T^3)/3) + ((a5*T^4)/4) + a7]*R
- Molecular Weight:
Molecular weight is a measure of the sum of the atomic weight values of the atoms in a molecule. Molecular weight is used in chemistry to determine stoichiometry in chemical reactions and equations. Different molecules of the same compound may have different molecular masses because they contain different isotopes of an element.
MATLAB Program:
Coding Functions:
1. Specific Heat:
function [cp] = specific_heat(a1,a2,a3,a4,a5,a8,a9,a10,a11,a12,local_mid_temp,R,T)

% Finding specific heat with low and high temperature variables
if T<=local_mid_temp

    cp = (a8 + (a9*T) + (a10*T.^2) + (a11*T.^3) + (a12*T.^4))*R;
else

    cp = (a1 + (a2*T) + (a3*T.^2) + (a4*T.^3) + (a5*T.^4))*R;
end
end
2. Enthalpy:
function [H] = enthalpy(a1,a2,a3,a4,a5,a6,a8,a9,a10,a11,a12,a13,T,R,local_mid_temp)

% Finding enthalpy with low and high temperature variables
if T<=local_mid_temp
    H = (a8 + ((a9*T)/2) + ((a10*T.^2)/3) + ((a11*T.^3)/4) + ((a12*T.^4)/5) + (a13./T))*R.*T;
else
    H = (a1 + ((a2*T)/2) + ((a3*T.^2)/3) + ((a4*T.^3)/4) + ((a5*T.^4)/5) + (a6./T))*R.*T;

end
end
3. Entropy:
function [S] = entropy(a1,a2,a3,a4,a5,a7,a8,a9,a10,a11,a12,a14,T,R,local_mid_temp)

% Finding entropy with low and high temperature variables
if T<=local_mid_temp
    S = (a8*log(T) + (a9*T) + ((a10*T.^2)/2) + ((a11*T.^3)/3) + ((a12*T.^4)/4) + a14)*R;
else
    S = (a1*log(T) + (a2*T) + ((a3*T.^2)/2) + ((a4*T.^3)/3) + ((a5*T.^4)/4) + a7)*R;
end
end
4. Molecular Weight:
function [W] = molecular_weight(species)
   Atomic_names = ['H','O','C','N','S','A'];
   Atomic_weights = [1,16,12,14,32,39];
   W = 0;

   for i = 1:length(species)
       for j = 1:length(Atomic_names)
           if species(i)==Atomic_names(j)
               W = W + Atomic_weights(j);
               position=j;
           end
       end
       n = str2double(species(i));
       if n>1
           W = W + Atomic_weights(position)*(n-1);
       end
   end
   fprintf('Molecular weight of species %s is %f',species,W)
end
Explanation for Molecular weight function code:
We have to calculate the molecular weight of each species. So we are performing an operation to calculate molecular weight in the form of a function. Here almost 53 species are present in thermo.doc file. Each species are monoatomic, diatomic and polyatomic molecular compounds. So, in these there are several elements which are common on each species. The elements present in this file are H,O,C,N,S,Ar. So we are preparing a database for the operation in the form of a function. A character arrayis defined for the atoms and an array of atomic weights respective to character array is defined.Preparing a database means we are providing datas that should calculate molecualr weight of each species. The two different array we creating are one for the atomic names and the other is atomic weights. Atomic weights are arranged in the array in the order same as that of the atomic names. Initially setting the molecular weight to be zero. Performing the operation to calculate the molecular weight by creeating 2 for loop. Firstly, in the for loop, we are considering the length of species such that it will calculate the molecular weight of compounds as well as monoatomic species. Second for loop is based on the length of Atomic names.Then we are creating a if conditional statement such that the species atomic order should match with the atomic names such that it will go into the forward loop. If it does not matches , it will not go through the loop. That is the use of if statement there. We know, W= Molecular weight + atomic weight of each molecule. Providing the expression for W and noting down the position at which we are calculating the molecular weight. Ending the for loop succeeding by another expression such that in position of calculating, if there is any numerical value it will be in string array mode. Inorder to enter into the numerical claculation, it should be a whole number. So performing str2double command. Providing another if statement so that it will assign to value of n. If value of n is equal to 1, then we can calculate using the above conditions. If n>=1, then W= W+ atomic_weights(position)*(n-1). Closing the if loop and also the for loop so that next cyclical operations will be performed. At last we should print the molecular weight in the command window. So, fprintf is the command used to show the molecular weight in the particular command space.
Main Code:
% Program for extracting 14 coefficients and calculating Specififc heat,
% Enthalpy, Entropy, Molecular weight
clear all
close all
clc

% To open the file from folder
f1 = fopen('thermo.dat','r')

% Skip the first 5 lines
fgetl(f1);
fgetl(f1);
fgetl(f1);
fgetl(f1);
fgetl(f1);

for k=1:53
% To attach the line to a variable
a = fgetl(f1);
% Splitting the line on basis of space
b = strsplit(a,' ');
% Loading the species name to particular variable
species = b{1};
% Obtaining the position and values of local temperature ranges
local_low_temp = str2double(b{end-3});
local_high_temp = str2double(b{end-2});
local_mid_temp = str2double(b{end-1});
% Load the next line to extract values
line_1 = fgetl(f1);
% splitting the datas on the basis of position of exponential 'E'
e1 = strfind(line_1,'E');
% Loading each coefficient to each variables
a1 = str2double(line_1(1:e1(1)+3));
a2 = str2double(line_1(e1(1)+4:e1(2)+3));
a3 = str2double(line_1(e1(2)+4:e1(3)+3));
a4 = str2double(line_1(e1(3)+4:e1(4)+3));
a5 = str2double(line_1(e1(4)+4:e1(5)+3));
% Moving to next line in the thermo.dat
line_2 = fgetl(f1);
e2 = strfind(line_2,'E');
a6 = str2double(line_2(1:e2(1)+3));
a7 = str2double(line_2(e2(1)+4:e2(2)+3));
a8 = str2double(line_2(e2(2)+4:e2(3)+3));
a9 = str2double(line_2(e2(3)+4:e2(4)+3));
a10 = str2double(line_2(e2(4)+4:e2(5)+3));
% Moving to next line in the thermo.dat
line_3 = fgetl(f1);
e3 = strfind(line_3,'E');
a11 = str2double(line_3(1:e3(1)+3));
a12 = str2double(line_3(e3(1)+4:e3(2)+3));
a13 = str2double(line_3(e3(2)+4:e3(3)+3));
a14 = str2double(line_3(e3(3)+4:e3(4)+3));
% Creating a temporary array to load temperaatures
T = linspace(local_low_temp,local_high_temp,500);
% Universal gas constant
R = 8.314;
% To calculate specific heat,enthalpy, entropy by calling the respective function
cp = specific_heat(a1,a2,a3,a4,a5,a8,a9,a10,a11,a12,local_mid_temp,R,T);
H = enthalpy(a1,a2,a3,a4,a5,a6,a8,a9,a10,a11,a12,a13,T,R,local_mid_temp);
S = entropy(a1,a2,a3,a4,a5,a7,a8,a9,a10,a11,a12,a14,T,R,local_mid_temp);
% Loading the plot for T Vs cp to figure(1)
figure(1)
plot(T,cp,'color','r')
xlabel('Temperature')
ylabel('Specific Heat')
title('Variation of Specific heat with Temperature')
grid on
% Loading the plot for T Vs cp to figure(2)
figure(2)
plot(T,H,'color','b')
xlabel('Temperature')
ylabel('Enthalpy')
title('Variation of Enthalpy with Temperature')
grid on
% Loading the plot for T Vs cp to figure(3)
figure(3)
plot(T,S,'color','k')
xlabel('Temperature')
ylabel('Entropy')
title('Variation of Entropy with Temperature')
grid on
% Making a new folder named as same as the species
mkdir(species)
% Changing the directory
cd(species)
% Saving the plot in the respective species folder
saveas(figure(1),'cp Vs T.jpg')
saveas(figure(2),'H Vs T.jpg')
saveas(figure(3),'S Vs T.jpg')
% Retruning to back folder
cd ..
% To calculate molecular weight
W = molecular_weight(species)
endExplanation:
clear all - This MATLAB function removes all variables from the current workspace, releasing them from system memory.
close all - This MATLAB function closes the current figure.
clc - This MATLAB function clears all the text from the Command Window, resulting in a clear screen.
for - This MATLAB function executes a group of statements in a loop for a specified number of times.
if - This MATLAB function evaluates an expression, and executes a group of statements when the expression is true.
fopen - This MATLAB function opens the file, filename, for binary read access, and returns an integer file identifier equal to or greater than 3.
fgetl - This MATLAB function returns the next line of the specified file, removing the newline characters.
strsplit - This MATLAB function splits str at whitespace into C.
str2double - This MATLAB function converts the text in str to double precision values.
strfind - This MATLAB function searches str for occurrences of pat.
linspace - This MATLAB function returns a row vector of 100 evenly spaced points between x1 and x2.
plot - This MATLAB function creates a 2-D line plot of the data in Y versus the corresponding values in X.
xlabel - This MATLAB function labels the x-axis of the current axes or standalone visualization.
ylabel - This MATLAB function labels the y-axis of the current axes or standalone visualization.
mkdir - This MATLAB function creates the folder folderName.
cd - This MATLAB function displays the current folder.
cd.. - This MATLAB function returns the existing current folder to oldfolder.
saveas - This MATLAB function saves the figure or Simulink block diagram specified by fig to file filename.
Results:
Plots Obtained:
- Plots for species O2
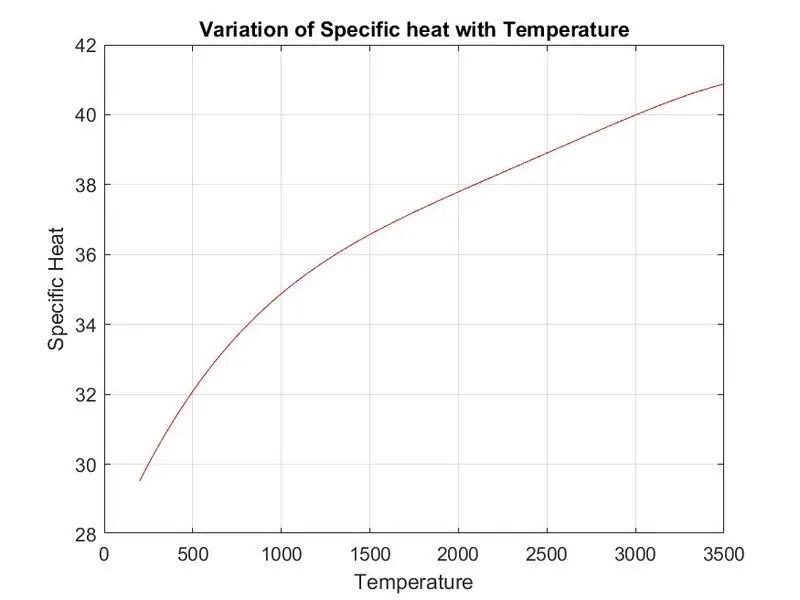
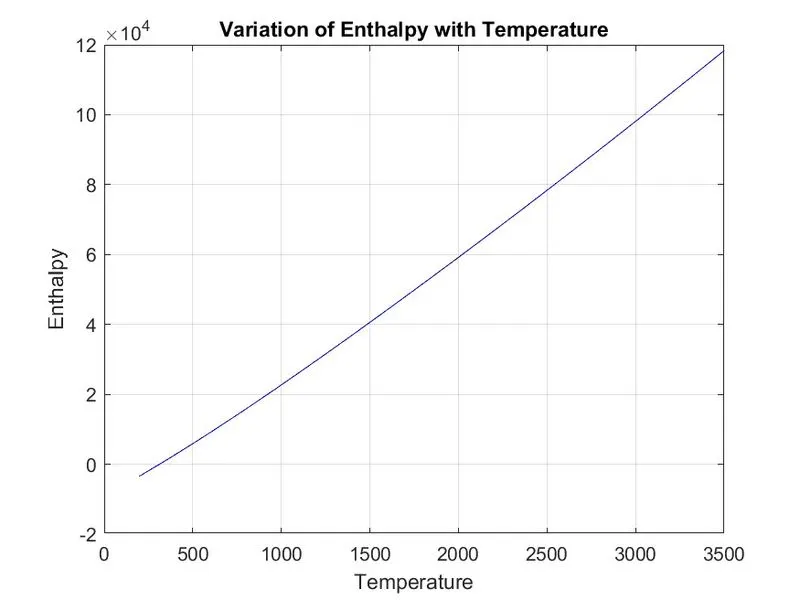
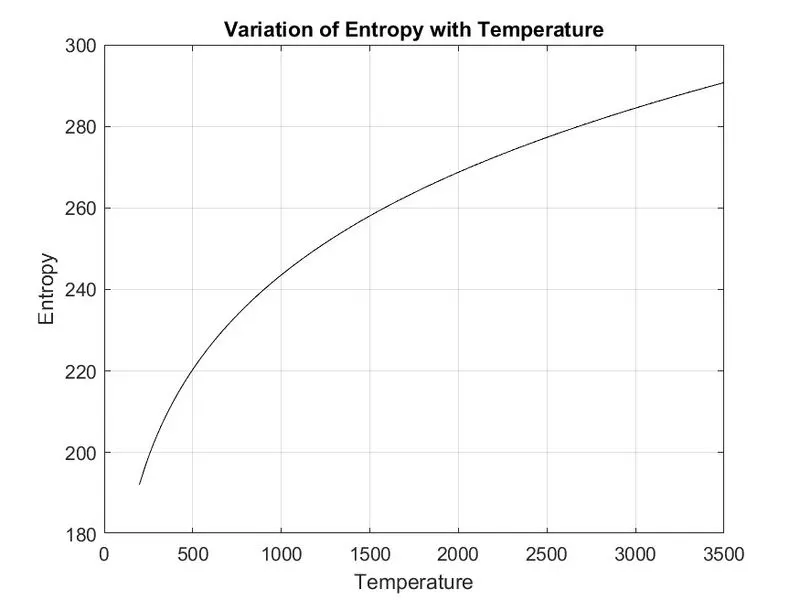
- Plots for species N2
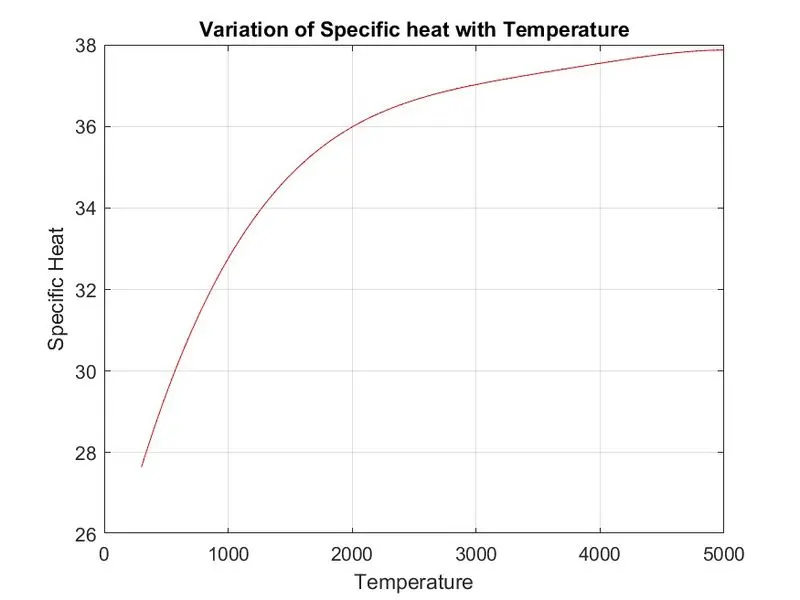
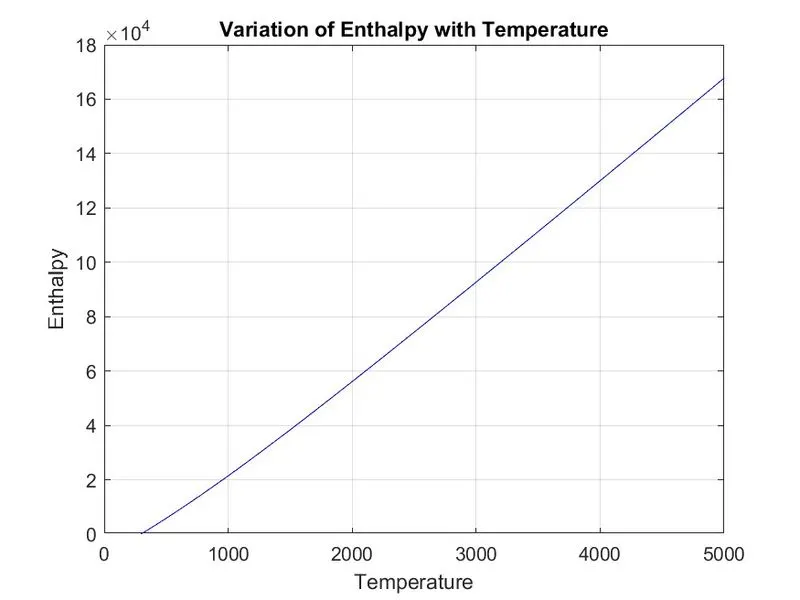
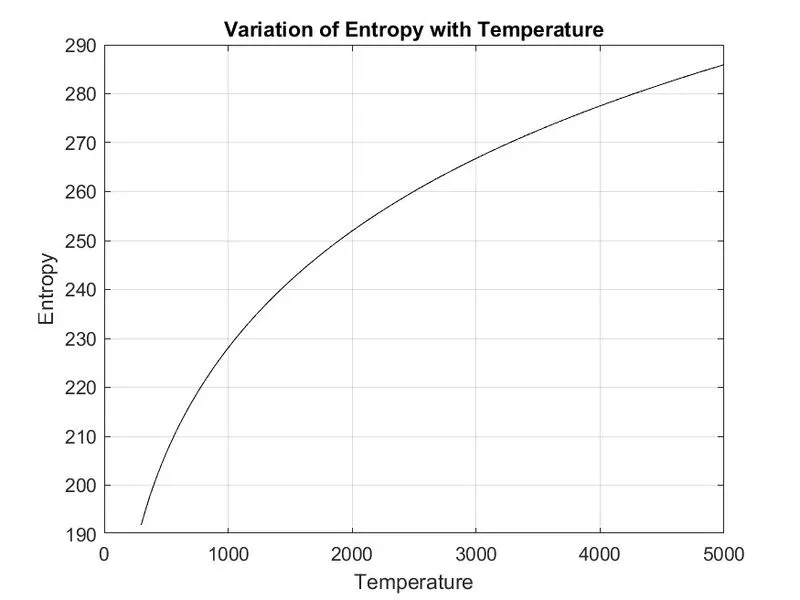
- Plots for species CO2
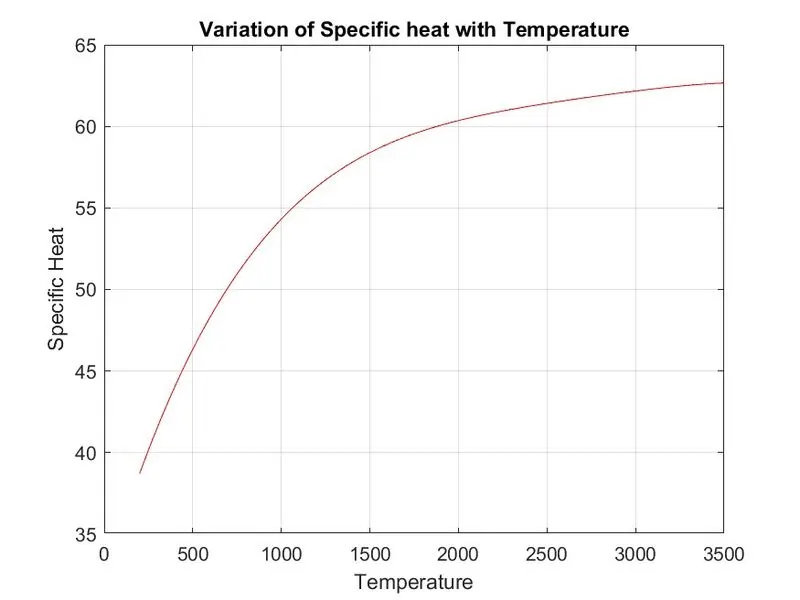
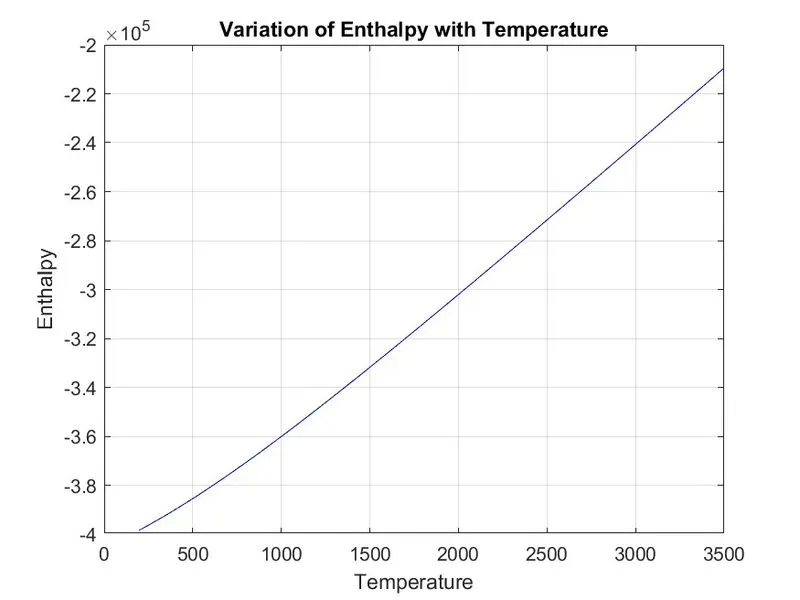
The molecular weight of all species as displayed in the command window is shown below.
The folder in which all the species plots are saved is shown below.