Week 3 - Pitot tube
- Pitot tube
- Aim - To perform simulation on the pitot tube.
- Objective- To simulate flow on the pitot tube .
- To do a literature review of pitot-static tube. Also establish a relationship between Total (stagnation) pressure and static pressure.
- Calculate total and static pressure and find the percentage of velocity error.
- Literature Review
- Basically, pitot tubes are used in wind tunnel experiments and in airplanes to measure flow velocity.
- It is a thin tube pierced with two holes.
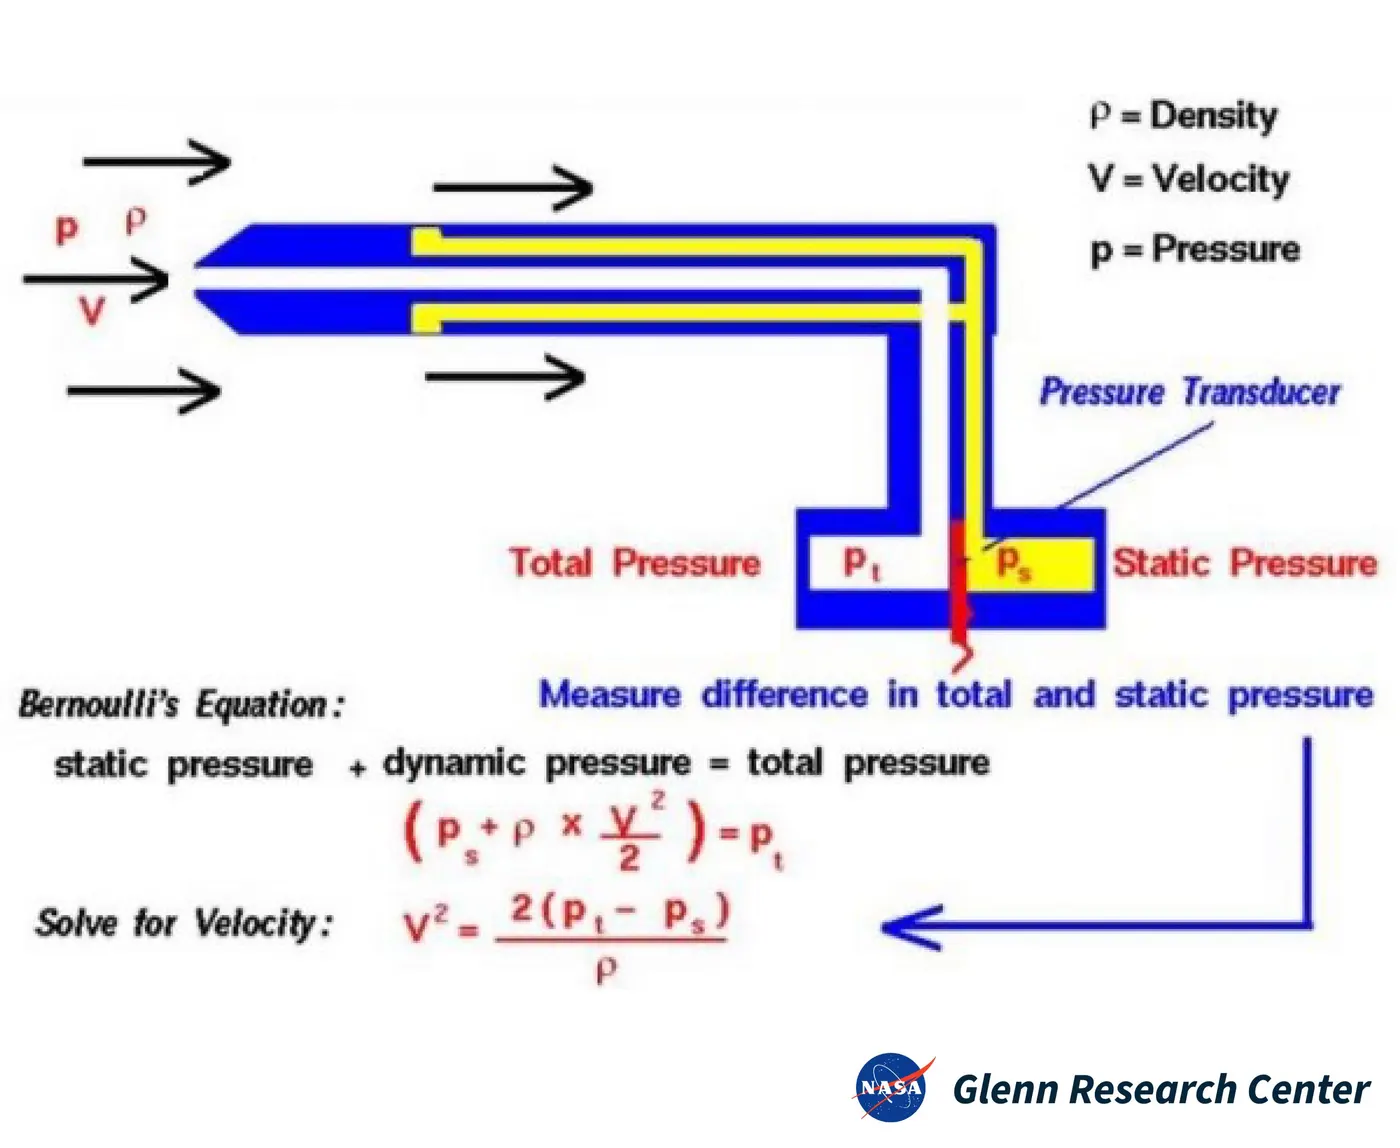
- The front hole is located in the airflow to measure called stagnation pressure. Side ports measure static pressure.
- By measuring the difference between these pressures, you can get the dynamic pressure, which can be used to calculate velocity.
- If the speed is low, the pressure difference is small and difficult to measure accurately with a sensor.
- Instrument errors can be larger than measurement errors! Pitot tubes therefore do not work very well at very low speeds.
- If the speed is very high (supersonic), the assumptions of Bernoulli's equation are violated and the measurement is again erroneous.
- Shock waves appear at the front of the tube, which changes the total pressure.
- Shock wave correction can be applied so that we can use pitot tubes for high speed aircraft.
- If the pipe is clogged or crushed, the pressure developed at the sensor is not the total pressure of the external flow and the static pressure. The sensor output is then used to calculate the velocity which is not the actual flow velocity. Several years ago, icing problems were reported with aircraft pitot-static probes. The probe output is used as part of the autopilot and flight control system. The solution to the icing problem is to install heaters on the probes to ensure that the probes are not blocked by icing.
- The relation between the Static pressure Total pressure and the velocity of the fluid is as follows
- Advantages
- Simple and economical to install and remove.
- Has no moving parts to help minimize frictional losses.
- Small and inexpensive
- Has much lower pressure loss.
- Disadvantages
- Any foreign matter in the stream will alter the accurate reading.
- Its accuracy is not very good.
- Its low accessibility.
- Its sensitivity is low.
- It performs better in high speed flow.
- Changes in speed curve cause large changes in readings.
- It cannot be used for dirty fluids.
- Its sensitivity is based on the disturbance flow.
- Working Principle
- Pitot tubes are cylinders open at one end and closed at the other. The liquid flowing through the pipe enters the pitot tube and stays there.
- The other part inside the pitot tube is filled with hydrostatic fluid. A septum separates the two chambers.
- The measurement of the dynamic pressure is given by the difference in level between the liquid in the pipe and the free surface.
- The measurement of shock and static pressure connected to the correct differential pressure gauge determines the flow rate and therefore the flow rate.
- Procedure
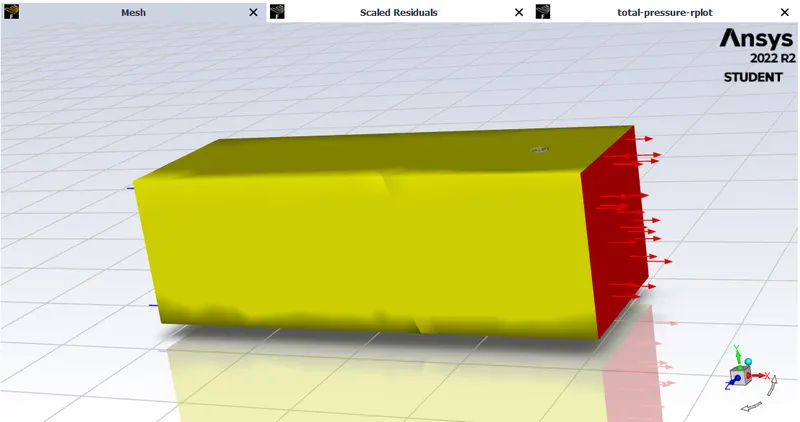
- Mesh Geometry imported in setup
- Results
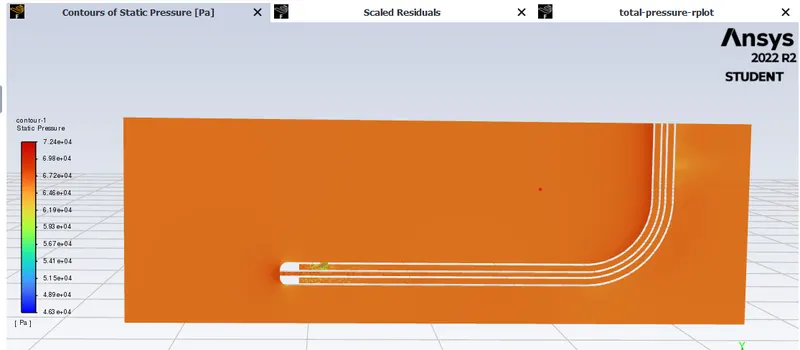
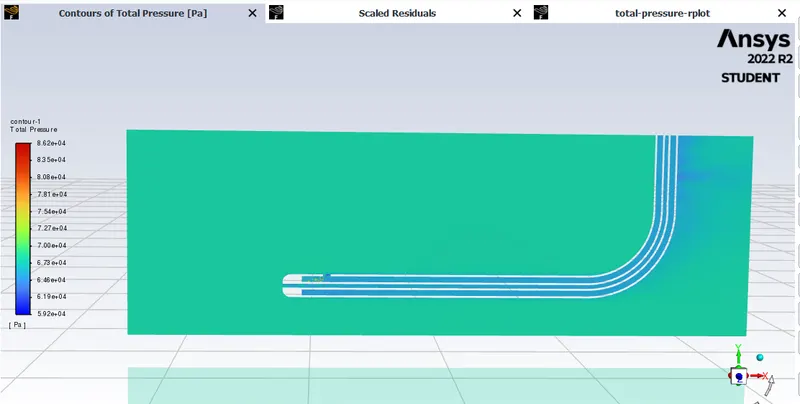
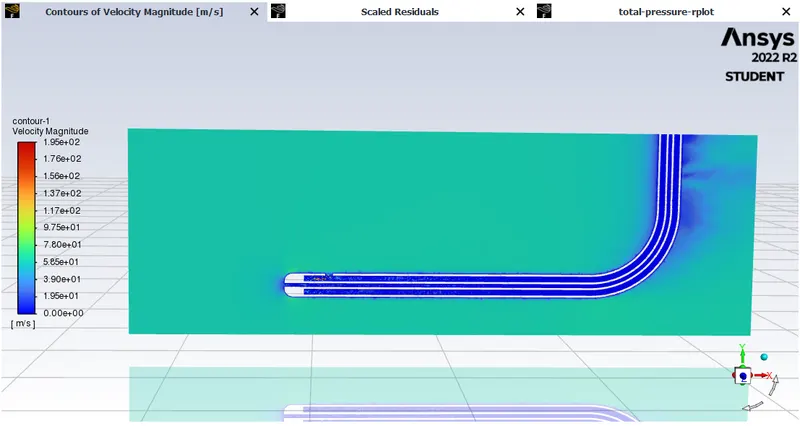
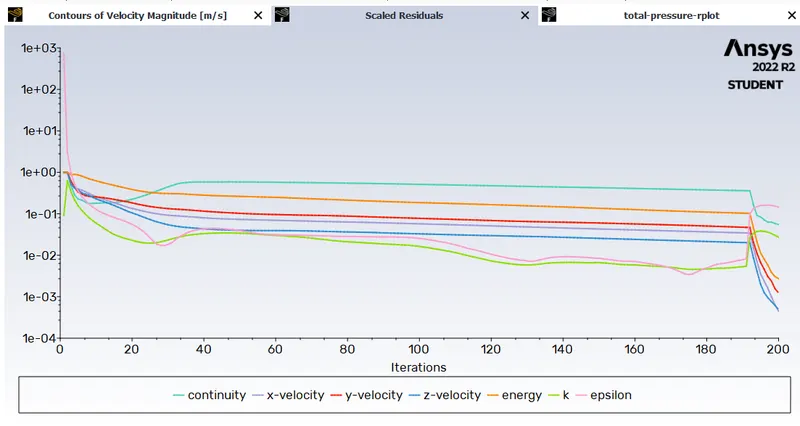
- Plots for velocity (62 m/s)Gauge Pressure (65780 pa):
- Static Pressure:
- Total pressure
- Velocity contour
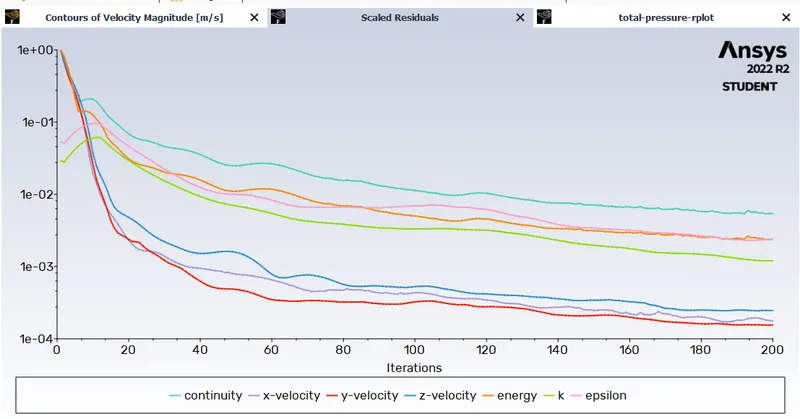
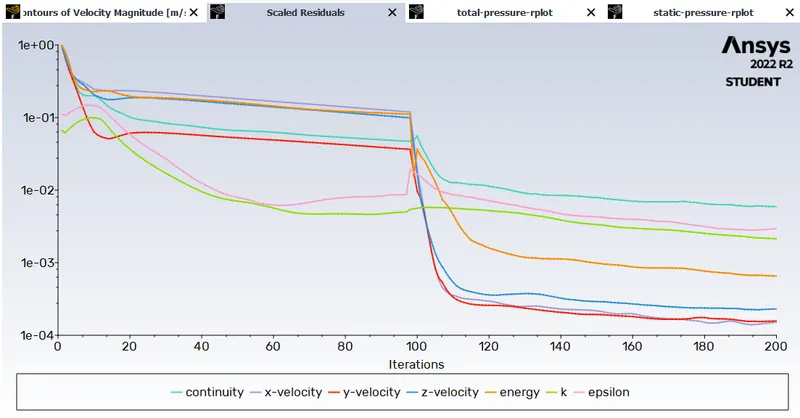
- Residuals
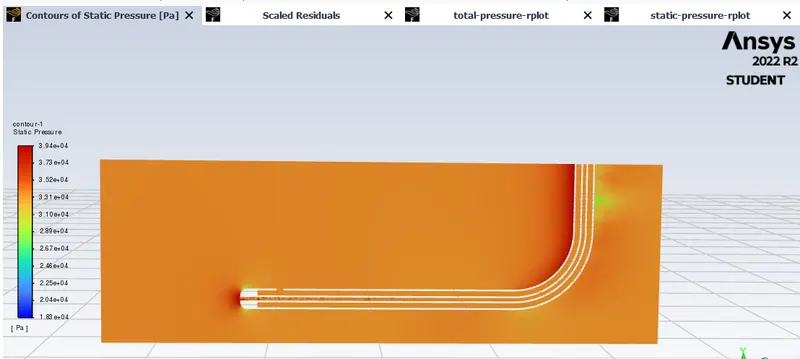
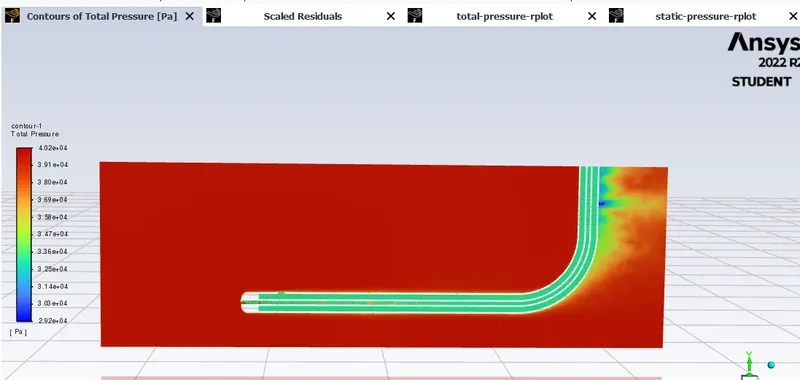
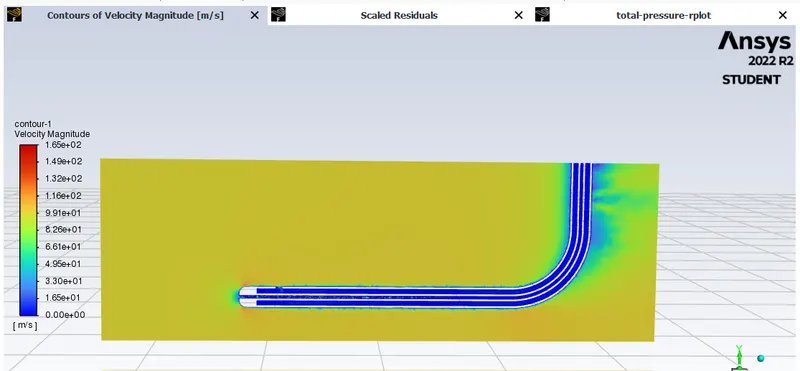
- Plots for velocity (100 m/s)Gauge Pressure (33287 pa):
- Static pressure
- Total pressure
- Velocity contour
- Residuals
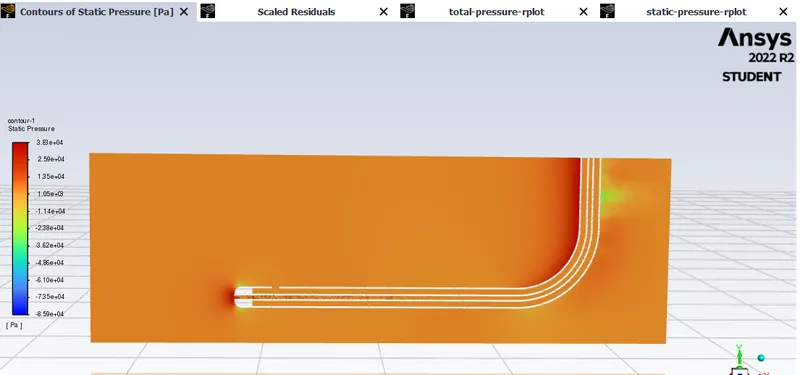
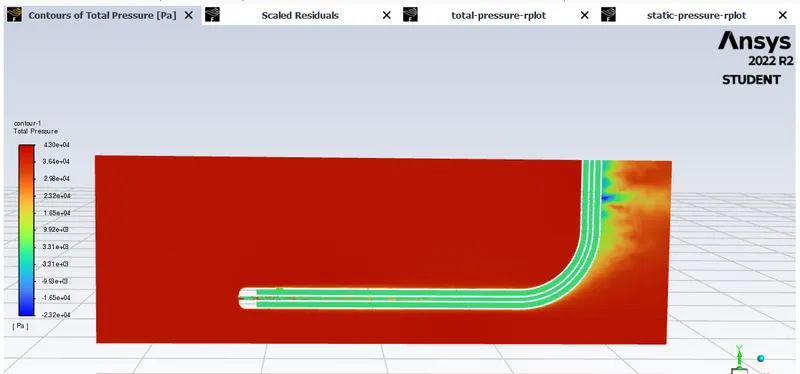
- Plots for velocity (240 m/s)Gauge Pressure (2817 pa):
- Static pressure
- Total pressure
- Velocity contour
- Stepwise Explaination
- Enter the mesh model
- In the fluid parameters to define the boundary conditions, enter the inlet velocity and pressure at the inlet boundary, and enter the same pressure for the outlet, because the pressure drop caused by the Pitot tube is very weak.
- Selects laminar flow in the viscous model.
- The creates an XY center plane for the pitot tube onto which the desired profile is projected.
- defines the ratios required for static and total pressure in static and total pressure lines, respectively.
- The desired contour is also defined.
- Velocity is calculated using the relationship between static pressure, total pressure, and velocity.
- Calculates the percentage error between the analyzed speed and the actual speed.
- Observations
Stagnation pressure = static pressure + dynamic pressure

Solving that for flow velocity gives

where
 is the flow velocity;
 is the stagnation or total pressure;
 is the static pressure;
 is the fluid density.
|
Velocity(m/s) |
Gauge Pressure (Pa) |
Static Pressure |
Total pressure |
Flow velocity |
% Error |
|
240 |
-2817 |
-2541 |
33043 |
222 |
8.10% |
|
100 |
33287 |
33287 |
39284 |
98 |
2.04% |
|
62 |
65780 |
65752 |
68099 |
61.90 |
0.16% |

 |
= | percent error |
 |
= | actual value observed |
 |
= | expected value |
- Conclusion
- Pitot tube simulations were run at different speeds to predict the static and total pressure at the outlet.
- The variation in error is small and within an acceptable range.
- Compared actual and analytical results for velocities by calculating errors
- Measure velocities using total and static pressures
- Very small percentage errors from given velocity boundary conditions
- Complete simulation with fairly accurate results .
- Completion of a literature review on pitot tubes.