Week 3: Flow over a backward facing step
Aim:
To simulate the turbulent flow of air in a backward-facing step for different base grid sizes and draw suitable conclusions
Theory:
The separated flow generated as fluid passes over a backward-facing step is of interest for a variety of reasons. First, separated flows produced by an abrupt change in the geometry are of great importance in many engineering applications. Also, the backward-facing step is an extreme example of separated flows that occur in aerodynamic devices such as high-lift airfoils at large angles of attack. In these flows, separation may be created by a strong adverse pressure gradient rather than a geometric perturbation, but the flow topology is similar. Secondly, from a fundamental perspective, there is a strong interest in understanding instability and transition to turbulence in non-parallel open flows. Hence, transition mechanisms in parallel flows such as plane channels and pipes have received substantial attention.
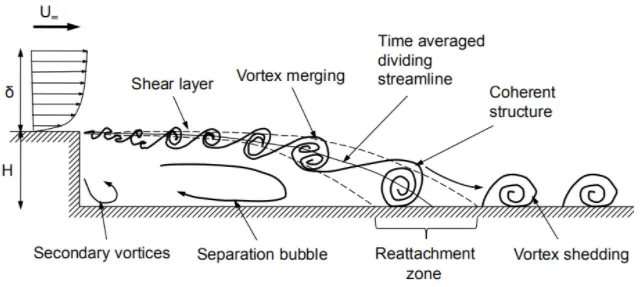
The general characteristics of the backward-facing step flow begin with an upstream boundary layer separating at the step edge due to the adverse pressure gradient that develops into a thin shear layer. The size of the shear layer increases downstream. It consists of many vortices and further vortices start merging together to form larger vortices. The shear layer becomes the shear zone when the size of the shear layer increases due to vortices, coherent structures. Finally, the separated flow attaches with the bottom of the BFS when a favorable pressure gradient is obtained. The point of reattachment is known as the reattachment point. The distance between the wall of the step and the reattachment point is known as the reattachment length. The location of the reattachment point is unsteady due to the inherent oscillatory motion of the shear layer. Hence, the reattachment zone is formed in which the reattachment point can present. The turbulent structures in the shear layer entrain irrotational fluid outside the shear zone. This creates low-velocity circulation between the step wall and the shear zone. This leads to the formation of the recirculation zone. The recirculation zone is mainly comprised of a primary vortex in the center and a secondary vortex adjacent to the corner of the step.
Geometry:
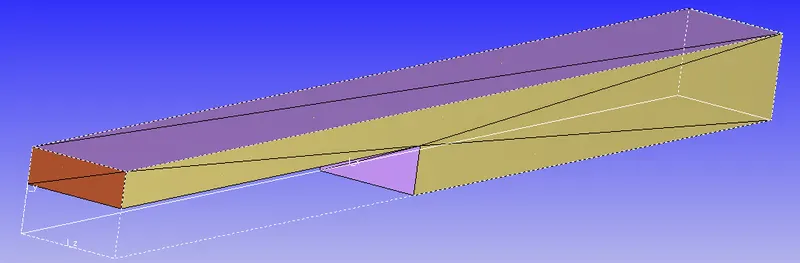
The length of the backward-facing channel is 0.272m, and the dimensions of the inlet and outlet are 0.01m and 0.02m respectively. Since we are performing a 2D simulation on the given backward-facing step, the length of the channel in the z-direction is not important. The faces of the geometry are given different names(inlet, outlet, front_2d, back_2d, and top_bottom) so that the boundary conditions can be provided easily.
Case setup:
1. Mesh sizes
Mesh element sizes in x, y, and z-directions:
case1: 2e-3m
case2: 1.5e-3m
case3: 1e-3m
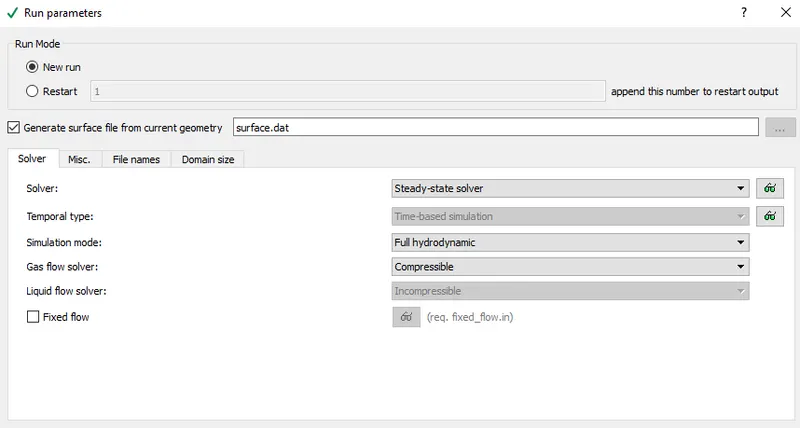
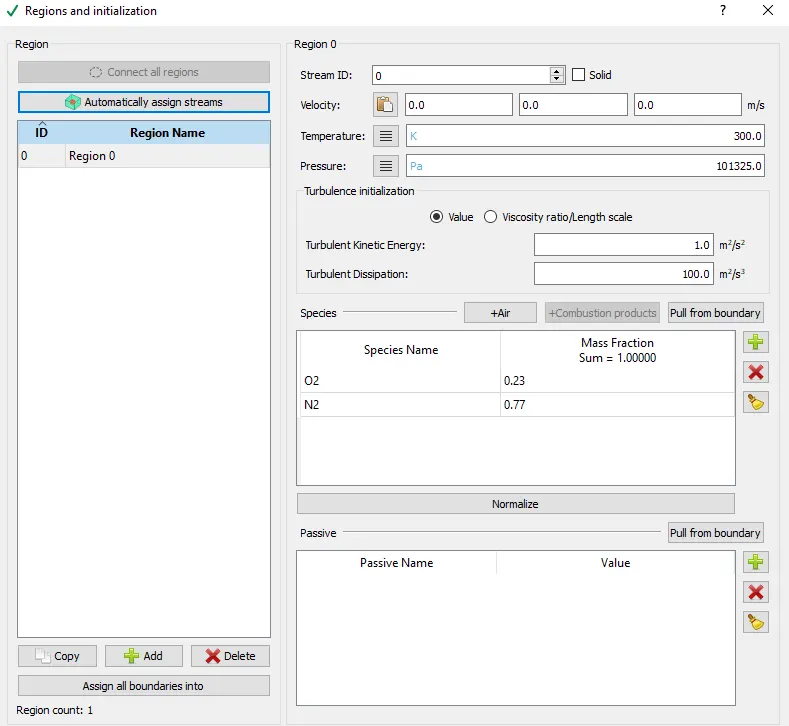
2. Type of simulation: Steady-state simulation with zero reactions and only air(77% N2, 23% O2) as the medium of flow.
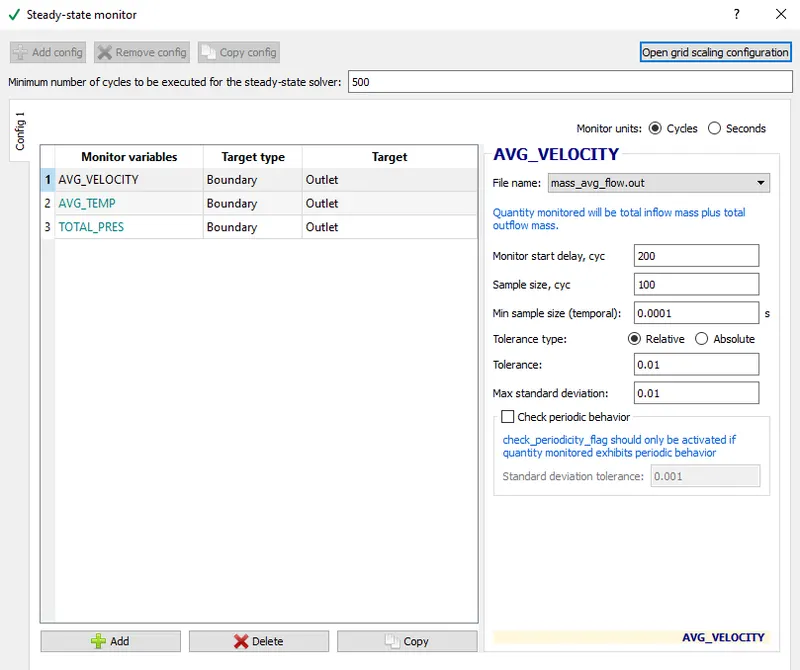
3. Steady-state monitor properties:
a) Average velocity at the outlet
b) Average mass flow rate at the outlet
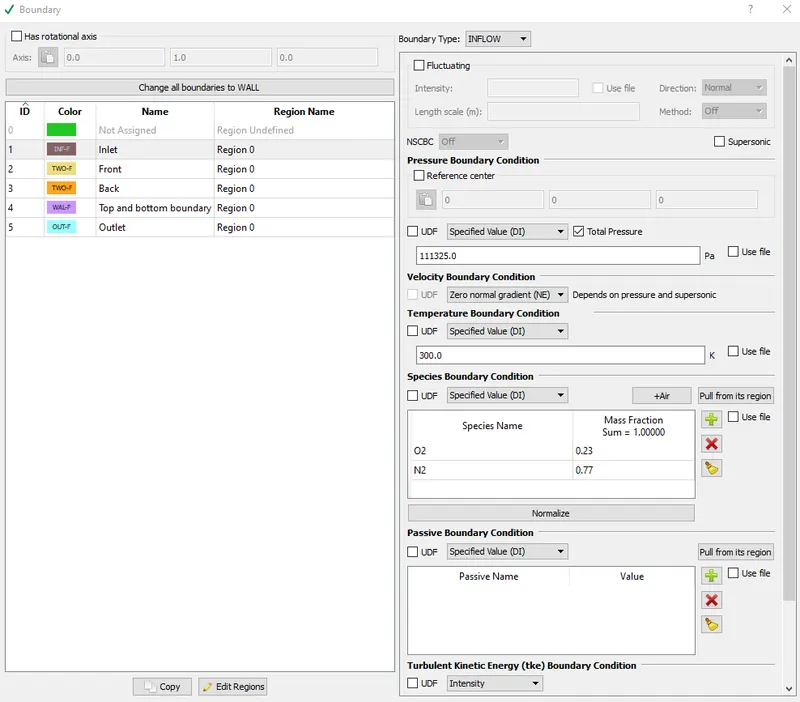
4. Boundaries:
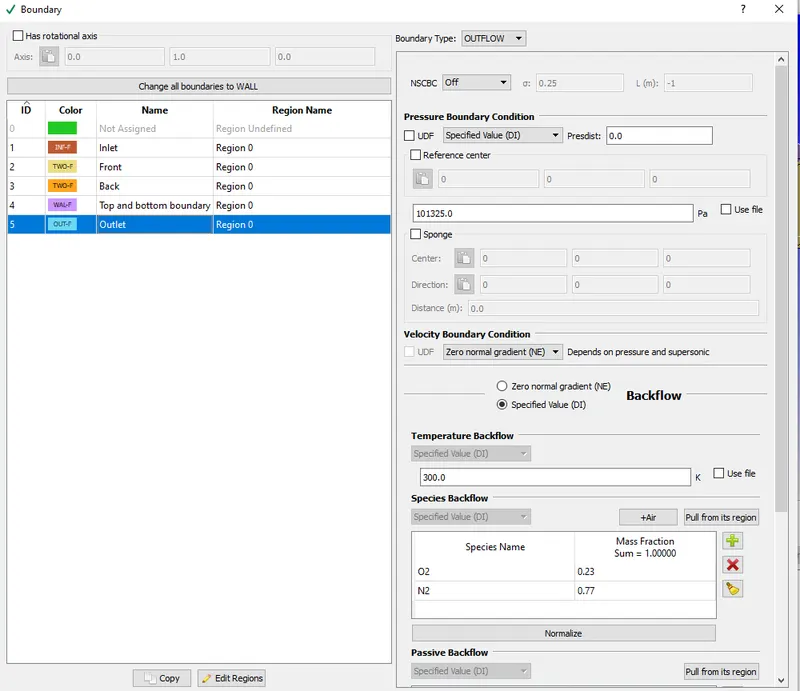
Inlet: Inflow boundary condition with pressure inlet (111325Pa).
Outlet: Outflow boundary condition with pressure outlet (101325Pa).
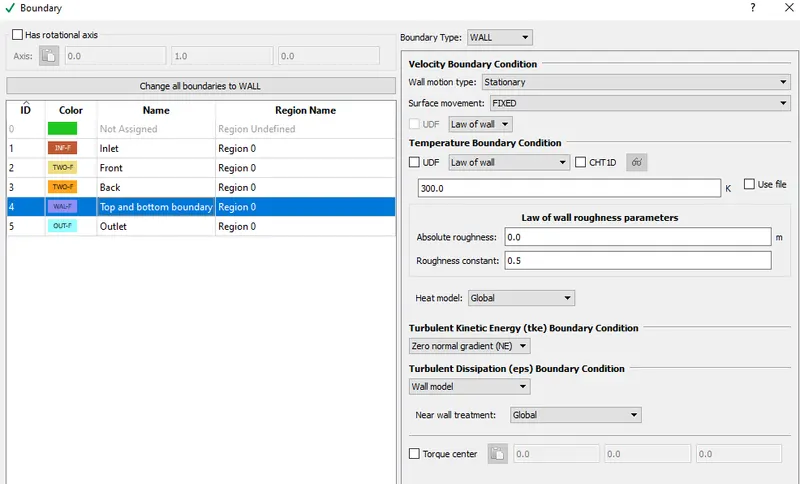
Top and Bottom: Stationary, no-slip wall.
Front and Back: 2D faces.
Pressure difference between the inlet and outlet= 10000Pa
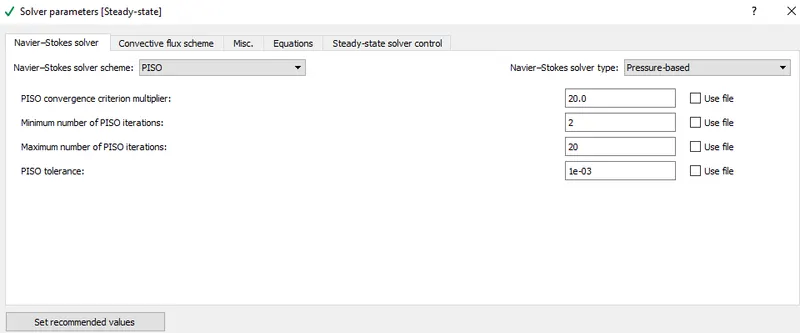
5. Solver properties:
Details: 2 minimum iterations and 20 max iterations per cycle. Tolerance = 0.001
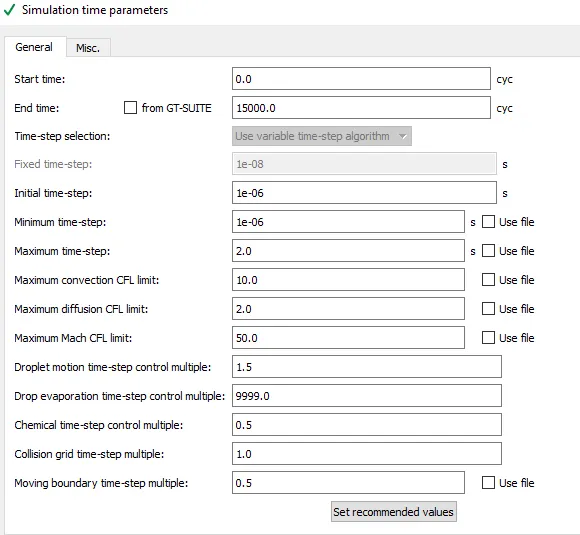
Minimum Cycles = 0
Maximum Cycles = 15000
Minimum time step = 1e-9 sec
Maximum time step = 1 sec
Maximum convection CFL limit(final stage)= 0.5
6.Turbulence model:
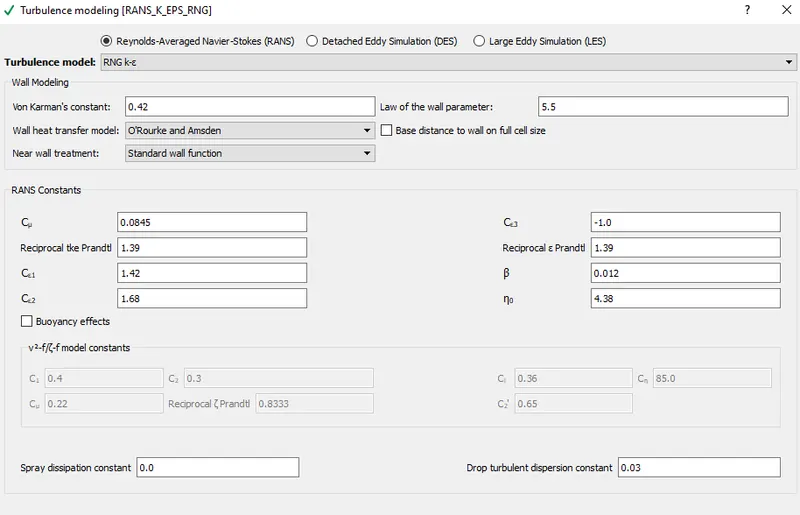
RNG K-epsilon turbulence model
Run Parameters
Steady state monitor
Simulation time parameters
Solver Parameters
Boundary conditions
Regions and initialization
Turbulence Modelling
Results:
Case1: mesh grid size= 2e-3m
Mesh:

Velocity Contour:
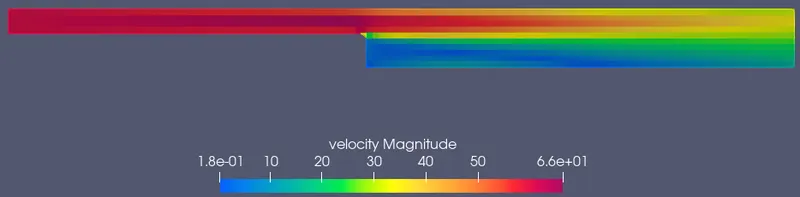
Pressure Contour:

Mass flow rate vs cycles:
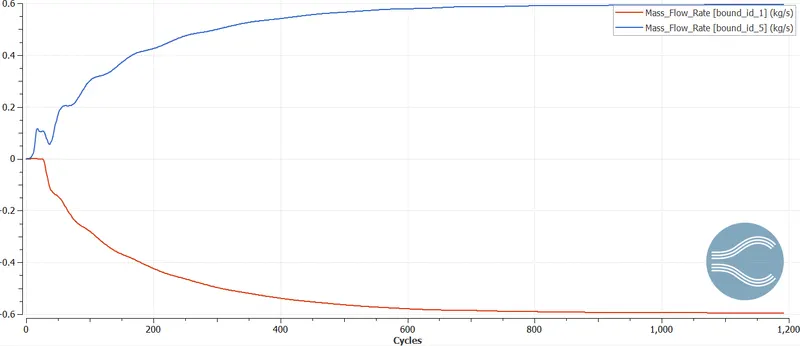
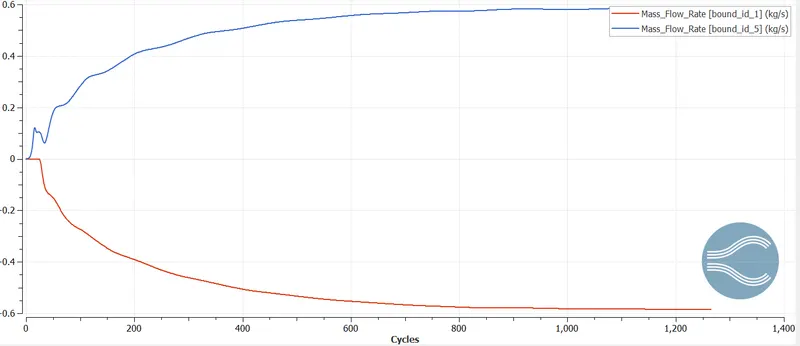
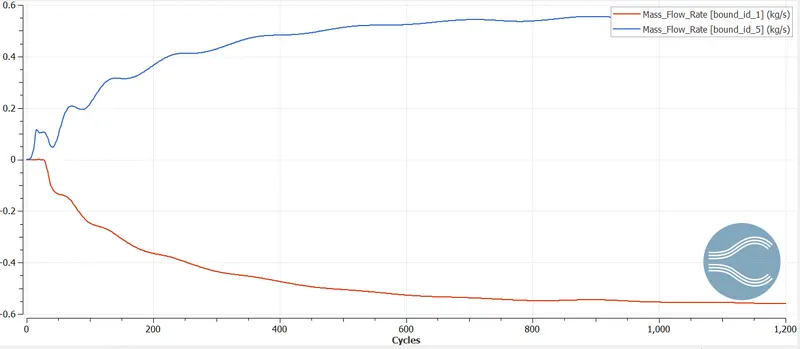
As the air enters the domain there is mass flow rate of 1.4 kg/s. When the air enters there is a negative sign, when the flow of direction is opposite to the normal. The opposite signs almost cancel each other to say that the mass has been conserved.
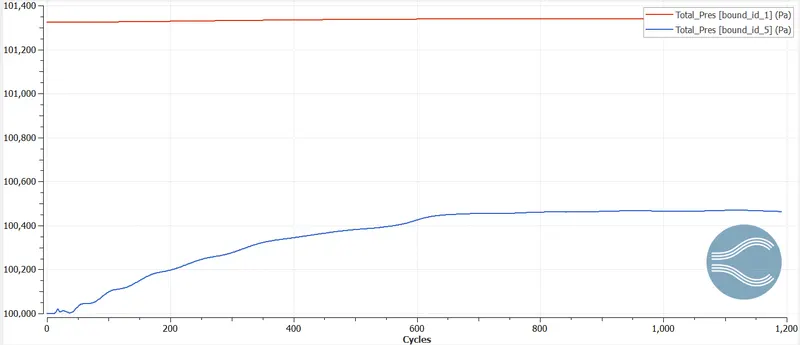
Pressure versus Cycles:
Velocity versus Cycles:
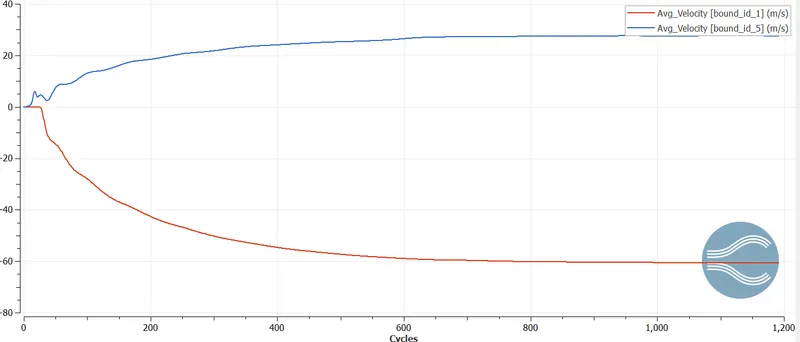
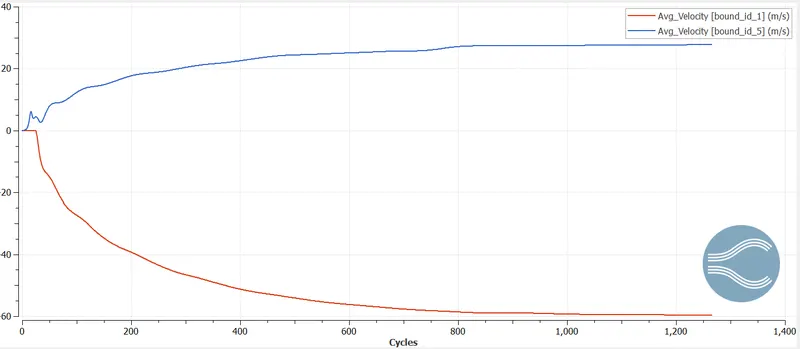
Inlet velocity approaches a value of -140 m/s, whereas outlet velocity takes a value of 70 m/s. The opposite signs gives a clear indication that momentum has been conserved. There is a difference in the value of the velocity as the area of cross section increases as the air flows from left to right.
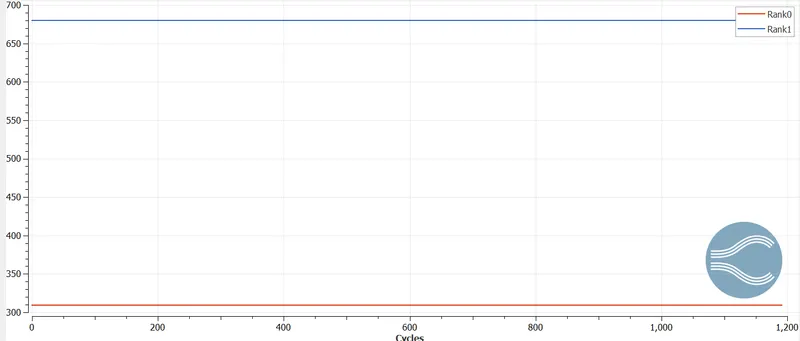
Cell Counts:
Case2: mesh grid size= 1.5e-3m
Mesh:

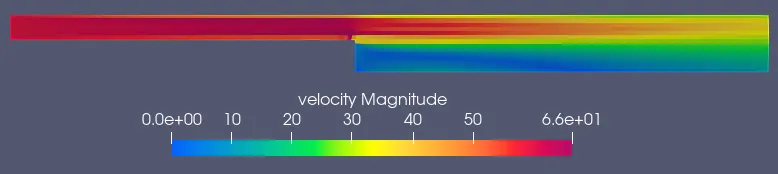
Velocity Contour:
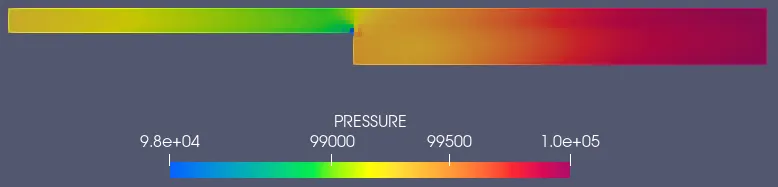
Pressure Contour:
Mass flow rate vs cycles:
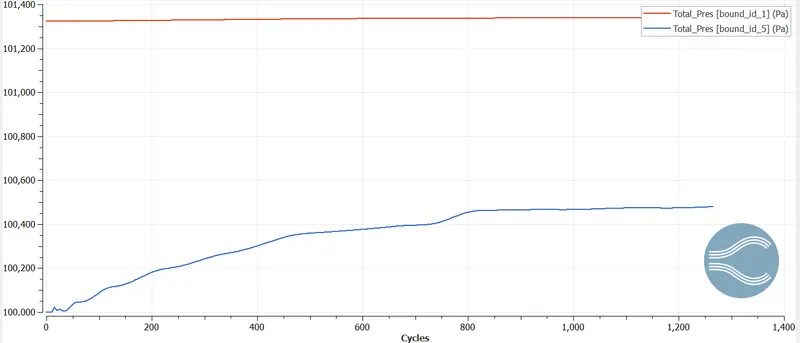
Pressure versus Cycles:
Velocity versus Cycles:
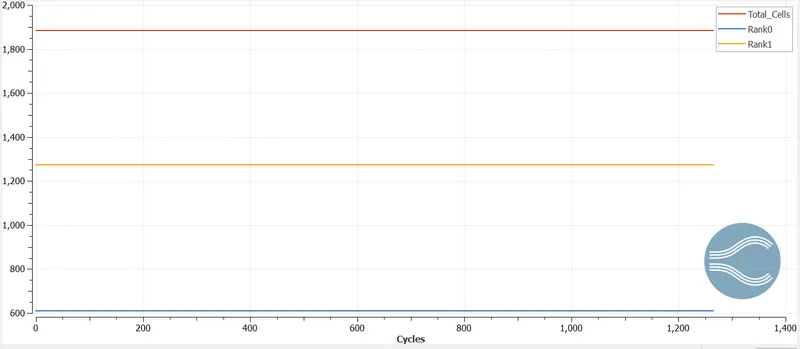
Cell Counts:
Case 3: mesh grid size= 1.e-3m
Mesh:

Velocity Contour:

Pressure Contour:

Mass flow rate vs cycles:
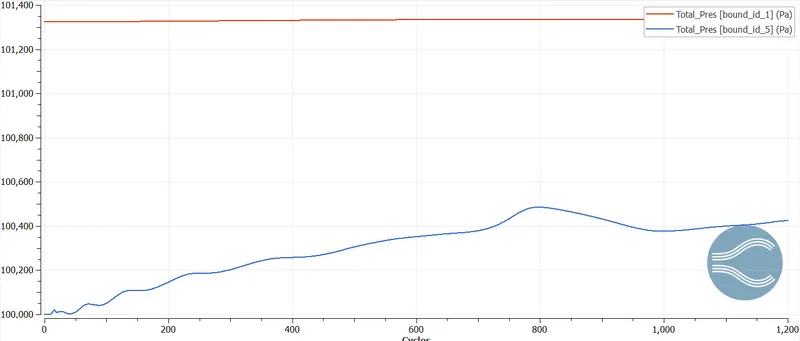
Pressure versus Cycles:
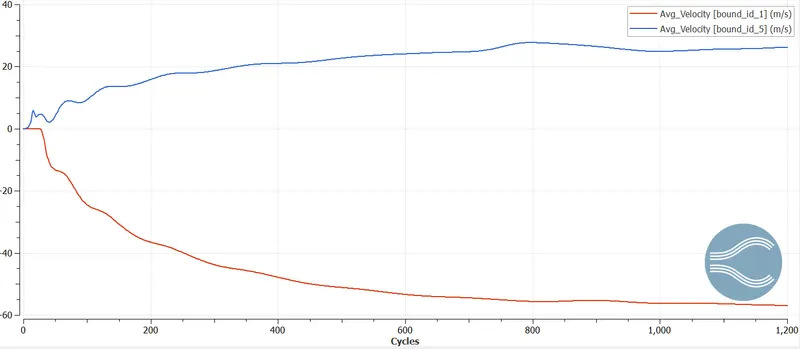
Velocity versus Cycles:
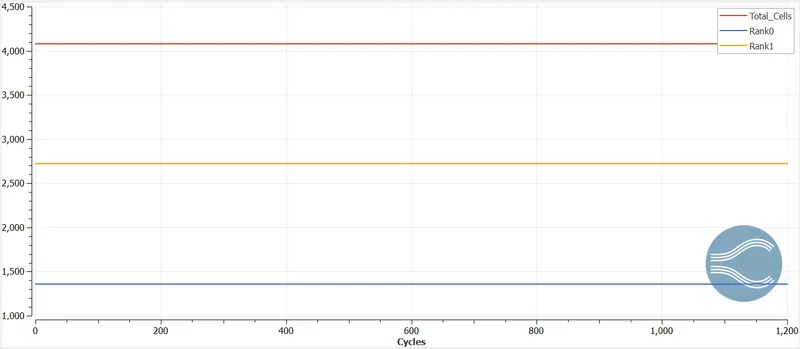
Cell Counts:
CONCLUSION
- Simulation was run with 3 different mesh sizes
- Flow variables were plotted against the number of cycles
- Contour plots gives us the distribution of the flow variables