Week 3 - External flow simulation over an Ahmed body.
Aim:
To study about the flow over the ahmed body for the inlet velocity of 25 m/s (i) for the parameters of velocity ,pressure through out the domain , lift coefficient and drag coefficient for body walls (ii)performing a Grid indepence test (iiii)for visualising a velocity vectors in the wake region.
Introduction:
In fluid mechanics, external flow is a flow that boundary layers develop freely, without constraints imposed by adjacent surfaces. It can be defined as the flow of a fluid around a body that is completely submerged in it. Examples include fluid motion over a flat plate (inclined or parallel to the free stream velocity) and flow over curved surfaces such as a sphere, cylinder, airfoil, or turbine blade, water flowing around submarines, and air flowing around a truck a 2000 paper analyzing the latter used computational fluid dynamics to model the three-dimensional flow structure and pressure distribution on the external surface of the truck. In a 2008 paper, external flow was said to be "arguably is the most common and best studied case in soft matter systems".
External flow utilized by great number of products by various industries such as filters, aerospace, automobile, construction, food and beverages etc
Present study belongs to one of that industry i.e., automobile industry. The study of three-dimensional flow around a ground vehicle has become a subject of significant importance in the automobile industry. Improving the fuel economy of vehicles is to reduce aerodynamic drag. Aerodynamic drag is proportional to the square of velocity, and hence the power needed to overcome drag is proportional to the cube of velocity. This means that there is a very strong relationship between the speed that a vehicle is travelling and the proportion of the fuel used to overcome drag.
For passenger cars this means that aerodynamics is responsible for a much higher proportion of the fuel used in the highway cycle than the city cycle: 50% for highway; versus 20% for city. This means that if you make a 10% reduction in aerodynamic drag your highway fuel economy will improve by approximately 5%, and your city fuel economy by approximately 2%.
The drive cycle speeds are gradually increasing to better reflect the way we use our cars. For example the New European Drive Cycle (NEDC) has an average speed of 33.6kph, whereas the new Worldwide harmonized Light vehicles Test Procedures (WLTP) has a speed of 46.5kph, an increase of 38%. Aerodynamic drag reduces by optimizing the body shape parameters is the great option . Execution of good aerodynamic design under stylistic constraints requires an extensive understanding of the flow phenomena and, especially, how the aerodynamics are influenced by changes in body shape. The flow region which presents the major contribution to a car's drag is the wake flow behind the vehicle. The location at which the flow separates determines the size of the separation zone, and consequently the drag force. Clearly, a more exact simulation of the wake flow and of the separation process is essential for the accuracy of drag predictions.
Important Phenomena’s:
Flow separation:
Prandtl found that the computed pressure recovery could not achieved in actual diffusers. Reason figured out for flow separation and pressure drop, arise of boundary layer concept. Prandtl specifies a necessary condition (i) Increasing pressure in the streamwise direction (positive (or) adverse pressure gradient along the flow path) (ii) Viscosity Effects.Föttinger proved with an experimental investigation.
Among these two factors if any one of the factor goes missing will prevent the flow separation.
Condition
`(frac{del u}{del y})=0` at y=0
1.Where shear stress is directly proportional to strain rate in laminar boundary layer,Strain rate is zero will leads to absence of shear stress.
2.It leads to plot a Zero-velocity line might give a boundary for vortices.
3.Mixing in boundary layer takes place will gives rise to the movement against the adverse pressure gradient.
4.Decreased pressure gradients and increased rate of mixing will have same behaviour on turbulent boundary layer.
Downstream of flow separation gives rise to reverse flow.
Wake Flow:
Wake flow and jet flow is distinguised by the ratio of the frontal length of the obstacle to the frontal length ( distance between the two obstacles (or) the distance between the obstacle and the wall ),if the ratio is small,then wake flow present behind the obstacle or otherwise jet flow present behind the obstacle.
Extent of the wake depends on (i) type of flow (laminar or turbulent) (ii) Shape of the body.
Laminar wake flow:
The body surface will have some roughness,due to that the pressure increased at crests and decreased at troughs.These will disturbs the flow and gives rise to eddies.
Kirchoff’s theory assumption will have a constant pressure and velocity at certain point with the help of Helmholtz’s concept of surface of discontinuity.Applicable to high speed flow will cause cavitation.Eddies present in wake will have a less speed when compared to the freestream.As reynolds number increases surface of discontinuity fails (for flat plate,Re > 1600).on the flow over the cylinder or sphere, Due to surface discontinuity the votices will shed ,If shear layer on the top and bottom has breaks will lead to pressure less than ambient value(suction may cause).wakes behind the blunt body will represent the pressure decrease probably associated with the effect of compressiblity on the vortex street and will be seen to be reflected in a slow increase in the thickness of the wake.pressure drop reaches a minimum at the distance downstream equal to half of the trailing edge thickness.The existence of this low pressure 'trough' has been observed in a number of tests on the flow past bluff bodies and is believed to coincide with the point at which the vortices form. The value of the pressure coefficient in the trough appears to decrease with an increasing degree of bluffness of the section, and hence, presumably with increasing strength of the vortex street.
Near wake is immediately area behind dislocation ratio plays a signficant role to determine the stability and velocity fluctuations at the separation points will produce a vibrations will make fluctuating stress at the surfaces and generating sound and accoustic pressure pulse sources travel in a boundary layer and far wake has a negligible fluctuations wake energy and vorticity survival fraction plays a significant role to understand the decay . For example flow over the cylinder near wake vortex karman street.Rate of periodic shedding is an important wake flow.Frequency of fluctuations is proportional to the velocity of freestream and inversely proportional to width of obstacle,shape of the body.Increase in mach number will develops the trailing shocks by replacing the low pressure at troughs.Transition region occurs at M=0.975 will increases a shedding frequency
Turbulent wake flow:
The wake flow behind a flat plate or any other body becomes turbulent at Reynolds numbers larger than 10^6. Even for the case of flow in which the boundary layer remains laminar as far as the trailing edge, the wake flow tends to be turbulent because of the unsteadiness of flow due to the existence of an inflection point in the velocity profile. If the boundary layer on the surface of a solid body is turbulent before leaving the surface, then, of course,the wake is turbulent. The main characteristics of a turbulent wake become apparent when the velocity in a wake is smaller than that in the main stream,and when the turbulent friction is much larger than the laminar friction.The problem of the turbulent wake may be solved by boundary layer equations. For a boundary layer solution it is assumed that the thickness of the boundary layer is small compared to the body length, while the transverse velocity gradient is large. These assumptions hold for wake flow because the transverse wake region is small compared to the main flow length, and the transverse gradient is large. Therefore, a boundary layer type of solution can be applied for wake flow. Mathematically, turbulent wake-flow problems are more amenable to solution than those of turbulent flows along a wall since, due to absence of the wall, it is not necessary to consider the laminar sublayer. Furthermore, for wake-flow analysis, the pressure in a certain region apart from the body may be assumed constant, thus simplifying the analytical solution of wake flow. The shear stress may be formulated by using Prandtl's mixing length theory.
Ahmed Body and its importance:
Ground vehicles can be termed as bluff bodies moving in close vicinity of the road Surface.The shape of such vehicles evolved over the years under the constraints of aesthetics, operational safety, service accessibility etc. Effect of these design guidelines on aerodynamics was not of prime importance in the past.A key feature of flow field around a vehicle are regions of separated flows,it ehibits a complex kinematic macro structures.This congfiguration will generate essential features of flow field with lot of exception such as rotating wheels,rough underside and surface projections,engine and passenger compartment flow.Fore body has rounded to prevent separated flows, middle section has box shaped sharp edged body.rear end with the base slant variation from 0 to 40 degrees.An experiment is carried out with 210 pressure tap at fore body, 83 pressure taps about middle body and rear end has pressure tap from 430 to 450 for various angles.This Shows that pressure rich data for 5,12.5,30 degree is available.Contribution of drag by the pressure (75%- 85 %) and friction (25 % - 15 %) varies due to the rear slant angles.contribution of rear slant angle is more compared to front and rear faces.Rear slant angles less than 30 degrees would develop the three vortices such as top,bottom and edge.
A real-life automobile is very complex shape to model or to study experimentally. However, the simplified vehicle shape employed by Ahmed et al. (1984) generates fully three-dimensional regions of separated flow which may enable a better understanding of such flows. Ahmed's body is 1044 mm long (L), 288 mm high and 389 mm width. The slant part is 222 mm long, whatever the angle. The bottom surface of the Ahmed body is located at 50 mm above the ground. The flow around this body is strongly influenced by the angle of the rear slant surface, which indicates that the large portion of aerodynamic drag is generated by the development of three-dimensional vortex separation from the rear slant surface.
Cars are not fully flat slant rear surface.it has changed to undersurface has a similar influence on the wake structure.
importance of flow around the ahmed body,it is a Well-known CFD Benchmark for the external aerodynamics.The ahmed body is a generic car model first proposed by Ahmed in 1984.All ground vehicles termed as bluff body close to the road surface.The analyzed body is able to capture the essential features of the flow which characterize modern cars.Most importantly ,high quality test data are available.With the help of that computational codes can be validated.As well largest contributor drag is the rear slant base can be compared for the similar car's rear slant base of the flow field.
Formula:
1.Reynolds Number-`frac{rho*v*l}{mu}`
`rho`-Density of the fluid
`v-`Free stream velocity
`l-`Length of the ahmed body
`mu-`Kinematic viscosity
2.`Y+=frac{Y*U^**}{nu}`
`Y-`first cell height
`nu-`kinematic viscosity
`U^**-sqrt(frac{tau}{rho)`
`tau-0.5*cf*rho*v^2`
cf=`0.059*R^-0.2`
`R-REYNOLDS NUMBER`
3.`delta=frac{0.37*x}{R^0.2}`
`x-`length of ahmed body
4.Turbulent length scale-`0.4*delta`
`delta-`Boundary layer Thickness
Geometry:
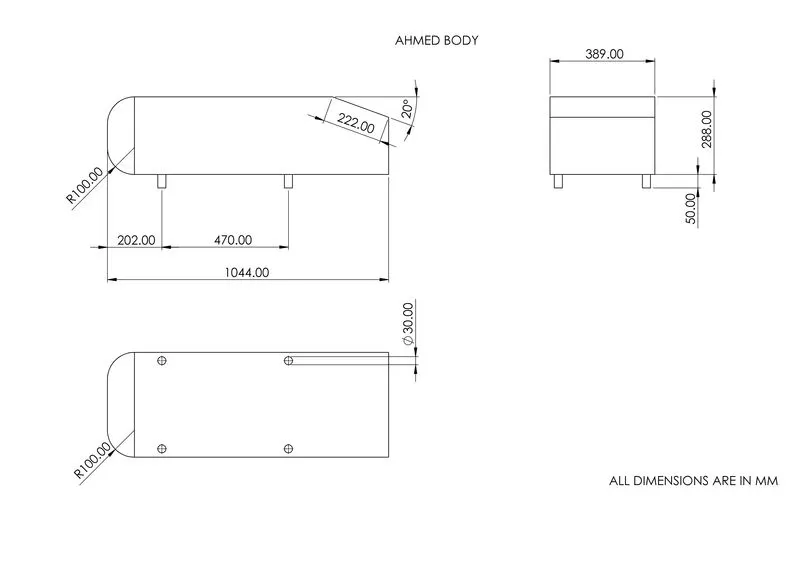
Above Depicted picture will give a information about the geometry parameters in the numerical values.
i.flow over ahmed body with the velocity of 40 m/s:
Present study needa unique velocity values such as 25m/s.But available resources for validation is for different velocity values due to this performing a simulation for validation case and present study done with the help of same physics except in velocity.After simulation of baseline mesh will allow to obtain a y+ values.It is clear that wall(back flat wall ) at the separated region is inbetween y+>5. if we take first cell height based upon that there is no advantage.if Y+ is inbetween 5 to 30 first cell in that region will leads error for RANS Turbulence modeling.
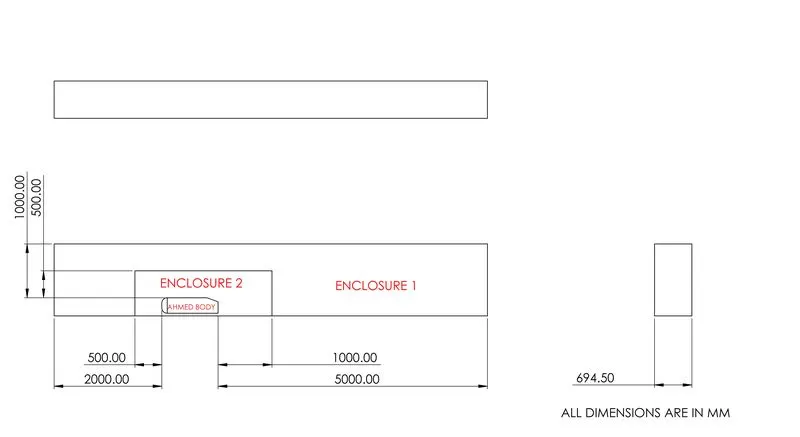
Geometry prepared to run the simulation.enclosure1 (Computational Domain) were created to capture the flow behaviour with the help of parameters using various numerical methods , algorithm etc..,
Enclosure2 is created to capture a flow parameters acurately with the help of finemesh.If we create a fine mesh thoughout computational domain processing power needs to be high.
Mesh Details:
Enclosure 1
Mesh element size-0.049 m
Y+ solution computed from ansys fluent,it is the distance from wall to the first cell centroid,where base mesh setup will presents a minimum Y+ value inbetween 5 to 30.No solvers will solve exactly in the transition region.so we choosen Y+=30, choosen Y+ will give half of the first cell height.
car walls-inflation layer-11,Boundary layer thickness-1.975e-2 m
Hexahedron structured mesh utilised for good accuracy.
Enclosure 2
Body Sizing mesh element size-0.0245 m
Leg face sizing mesh element size-0.0049 m
Solver :
Steady,incompressible solver has used
Reference value should should entered based upon the material properties such as air,length (represents by the ahmed body)-1.044 m
,Area(frontal area)-0.065741 `m^2`,velocity-40m/s.
Viscous model - `K-omega`SST model
`K-omega` SST model is one of the RANS Averaged model it offers for various situations like Adverse Pressure gradients,separated flows,turbulent heat transfer,mixed low and high Re problems,aerospace applications.This viscous model will solve y+>30 is just like wall functions with better accuracy.
Boundaries-
1.inlet velocity-40 m/s, inlet turbulent parameters-External flow over the cars ..,etc will have turbulence intensity of 1% .from it is assumed to be 0.25%,length scale is calculated as 0.0092 m
2.pressure outlet with same turbulent paramenters,
3.walls are symmetry (top,side),symmetry doesnot pass any information to the surrounding nodes
4.Walls of car is defined as no slip to develop a boundary layer.
5.Bottom wall is defined as no slip condition
Numerical algorithm - coupled has used
The Coupled approach forms a single large system of equations that solve for all of the unknowns (the fields) and includes all of the couplings between the unknowns (the multiphysics effects) at once, within a single iteration.
Gradient scheme - Least square cell based method.
This method estimate a gradient based upon a cell centroid values using a taylor series (restricted upto first order differentiation).Accuracy is better compared to nodal methods.This will shows a line approximation on the xy graphs.based upon the accuracy ansys fluent is kept as a default.But green guass cell based method really help the solver with faster computations.
Pressure spatial scheme-Second order
Second order scheme cannot able to use at mixture or VOF physics.It is also works on addition of the averaging the two cell centres and averaging the product of gradient and distance between node and cell centre for two cell centres.
Momentum,Turbulent kinetic energy,dissipation rate-second order upwind
When second-order accuracy is desired, quantities at cell faces are computed using a multidimensional linear reconstruction approach . In this approach, higher-order accuracy is achieved at cell faces through a Taylor series expansion of the cell-centered solution about the cell centroid.
Hybrid Initialisation
it solves laplace equation of velocity potential and pressure based on the boundary conditions specified.presents the initial values over the domain as gradually according to the specified boundary condition.
with the help of definitions option,getting result plots of drag coefficient and lift coefficient for the car walls
Autosave command used to save information for every 10 iterations
Present Study Plots and Comparisons
| Cell count | Rear Slant Angle (in degrees) | Coefficient of Drag (cd) | Coefficient of Lift (Cl) | |
| surabh et al.., | 2112223 | 20 | 0.261934 | 0.283622 |
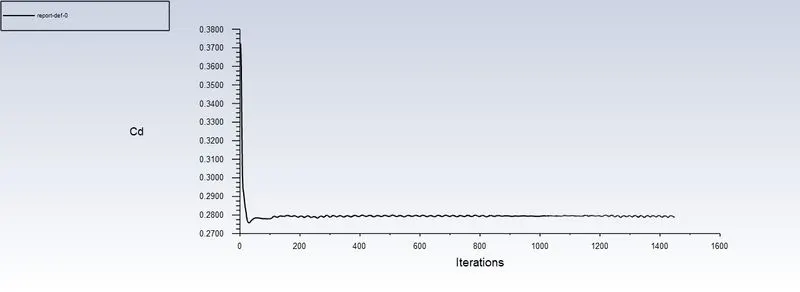
| Present Study | 2154807 | 20 | 0.2792 | 0.266 |
| Error | 6.59% | 6.62% |
Table 1-Comparision of present study with References
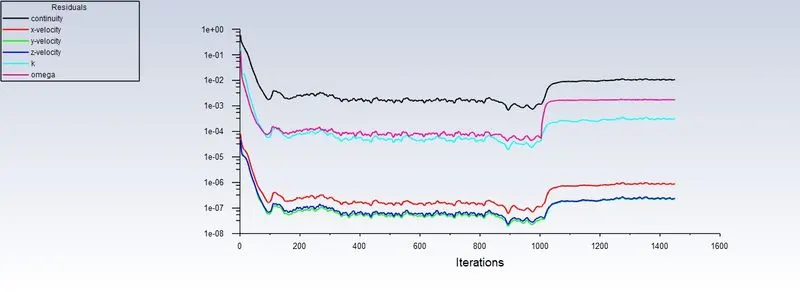
scaled resduals
Drag coefficient
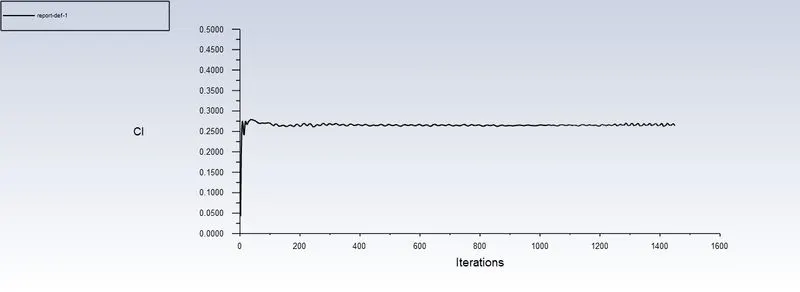
lift Coefficient
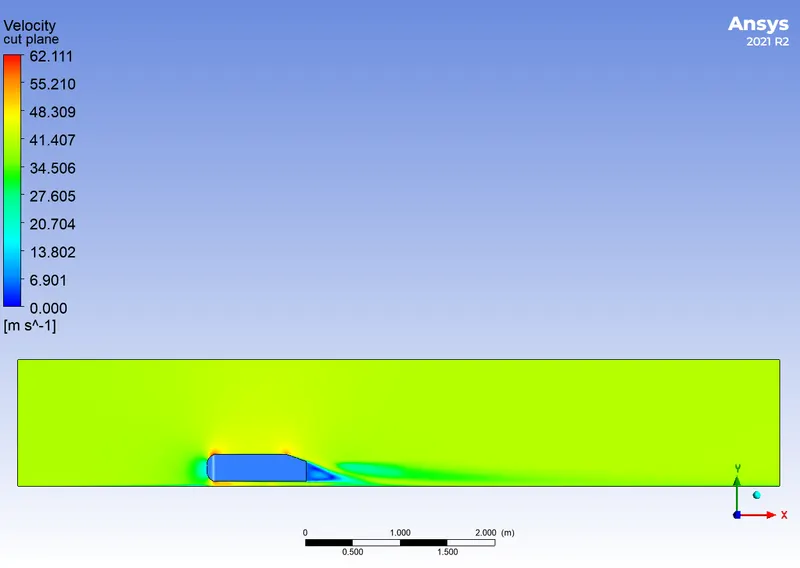
Velocity
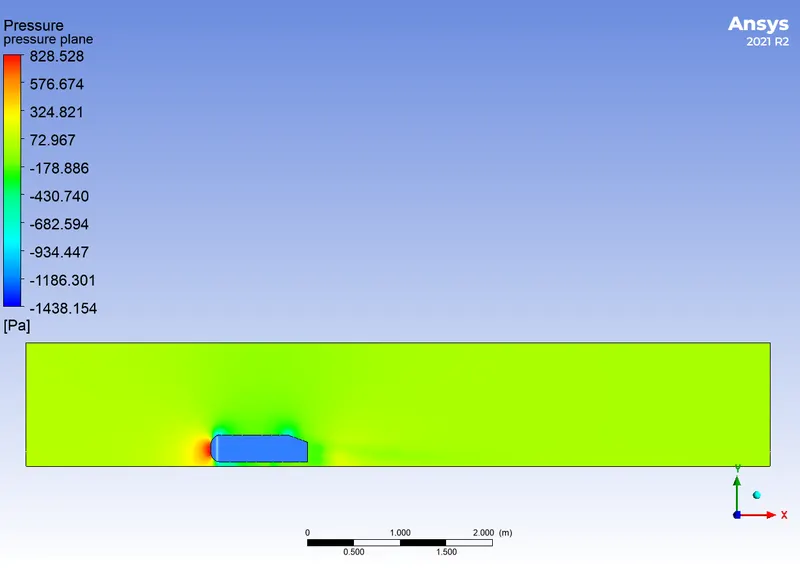
pressure
Interference:
Due to Mesh and solver and turbulence parameters and bottom wall of enclosure difference from reference paper would brought a error ~6% in both the quantities.
Mesh settings may different but the cell counts are nearer.
(ii)Flow over the ahmed body with the velocity of 25m/s
From the above simulation,changes are made for the velocity and mesh Sizes to perform grid independence study
Velocity-25 m/s
Mesh Size details:
Mesh Size 1
Global element size-0.1 m
Body sizing -0.05 m
face sizing-0.01 m
inflation layer -10 car walls
Total Thickness-0.02678 m
Mesh Size 2
Global element size-0.07 m
Body sizing -0.035 m
face sizing-0.007 m
inflation layer -10 car walls
total Thickness-0.02678 m
Mesh size 3
Global element size-0.049 m
Body sizing -0.0245 m
face sizing-0.0049 m
inflation layer -10 car walls
Thickness-0.02678 m
Mesh size 4
Global element size-0.0343 m
Body sizing -0.001715 m
face sizing-0.00343 m
inflation layer -10 car walls
Total Thickness-0.02678 m
Mesh size 5
Global element size-0.02401 m
Body sizing -0.013 m
face sizing-0.0002401 m
inflation layer -10 car walls
Total Thickness-0.02678 m
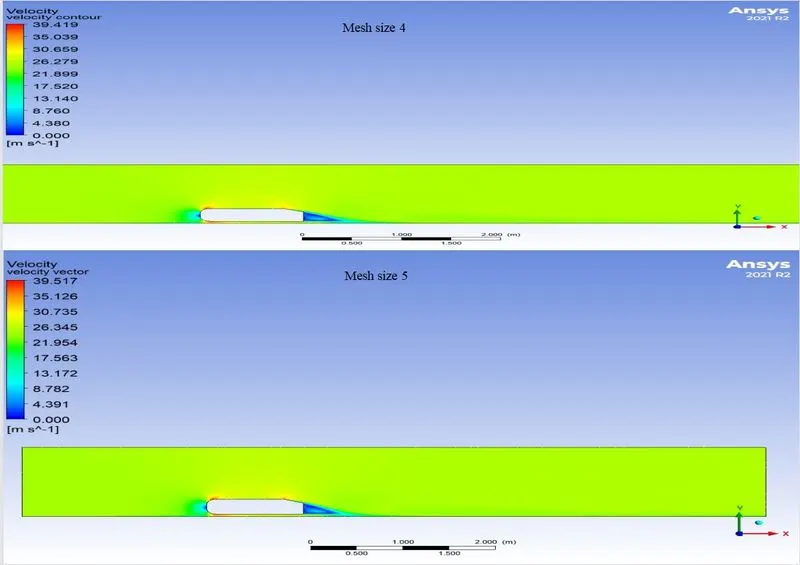
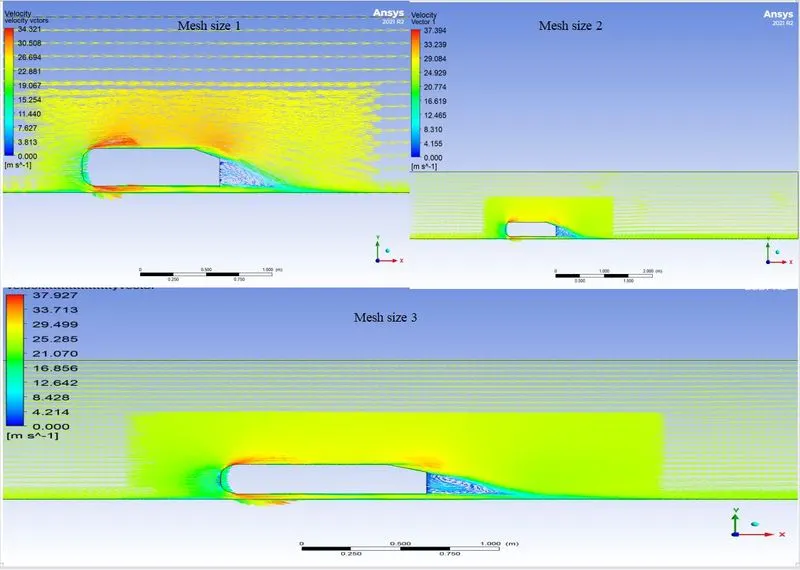
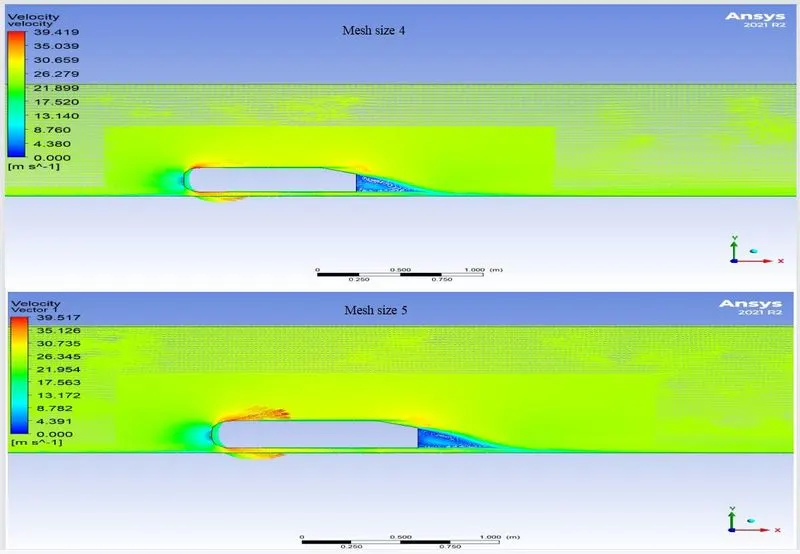
Plot:
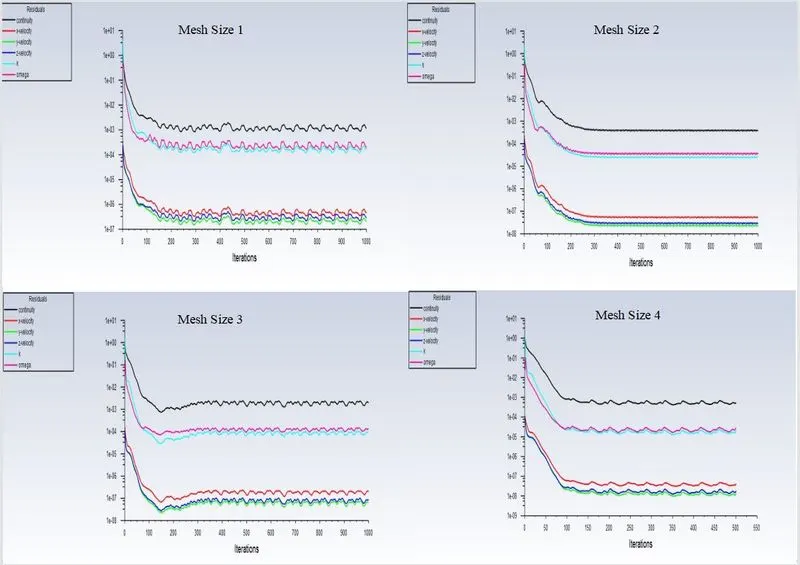
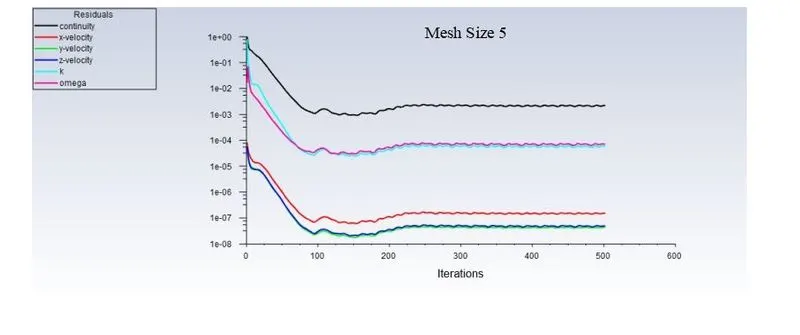
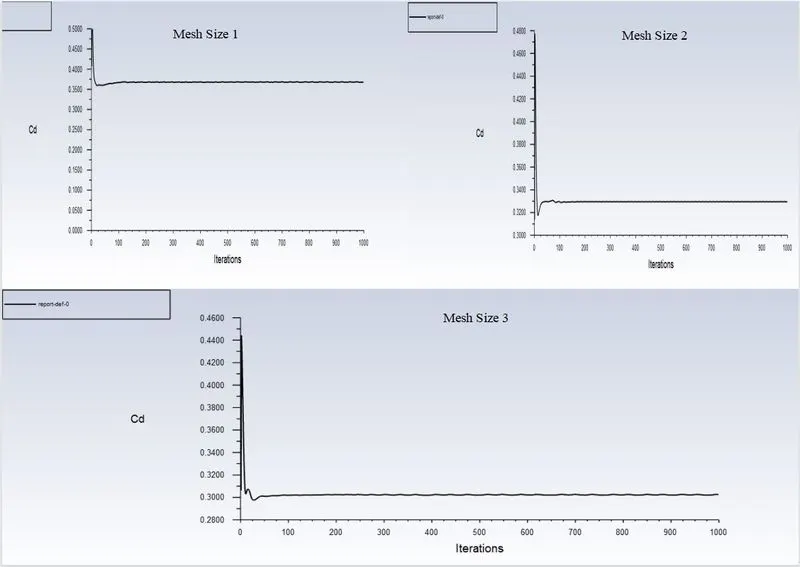
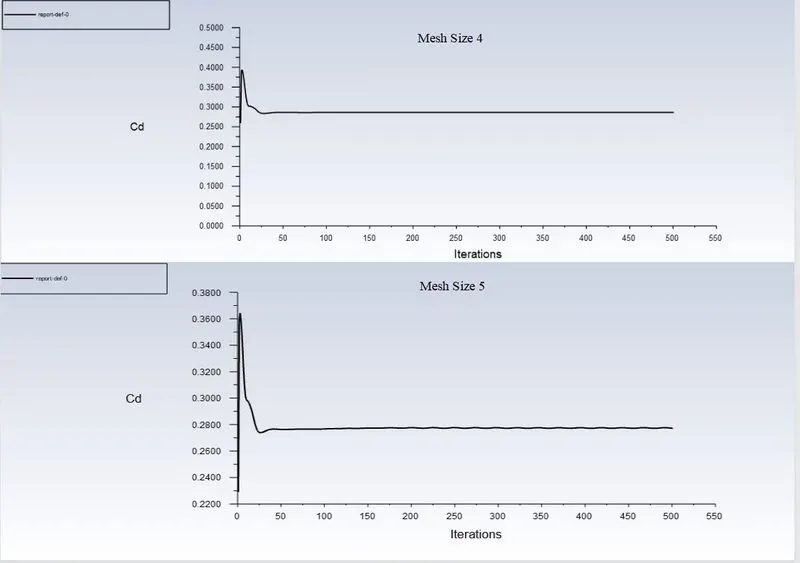
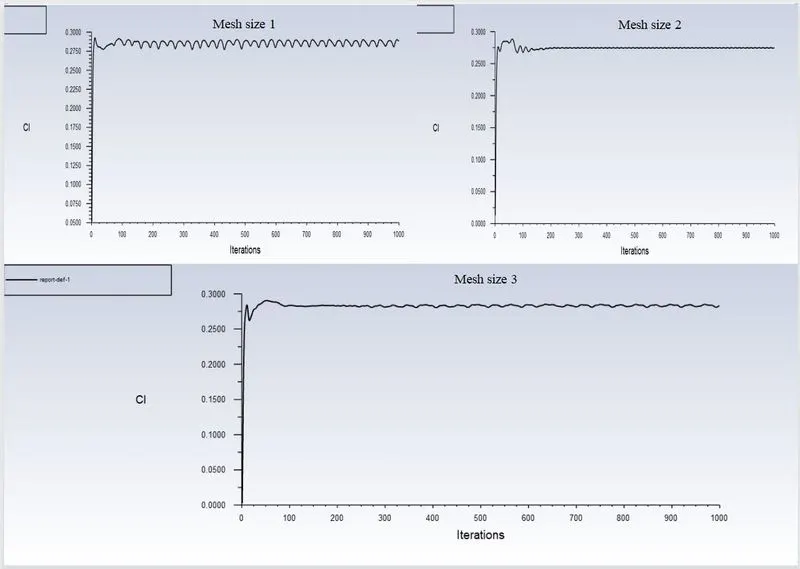
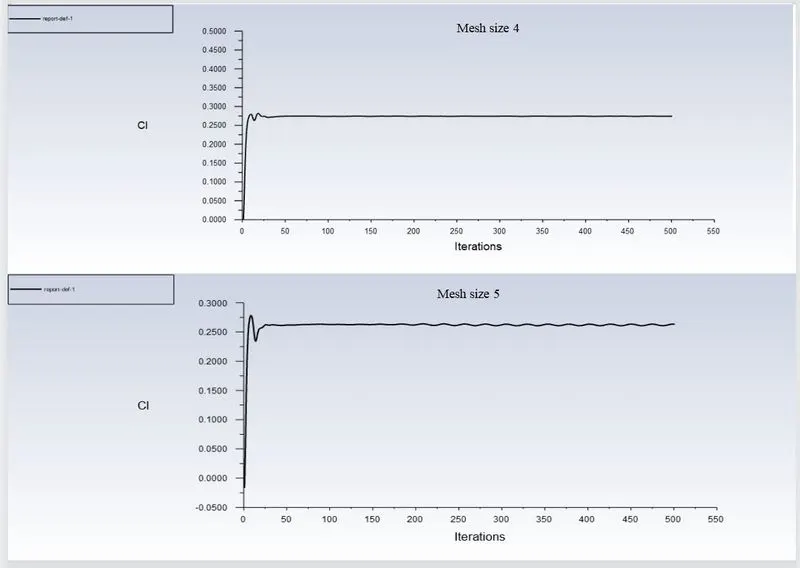
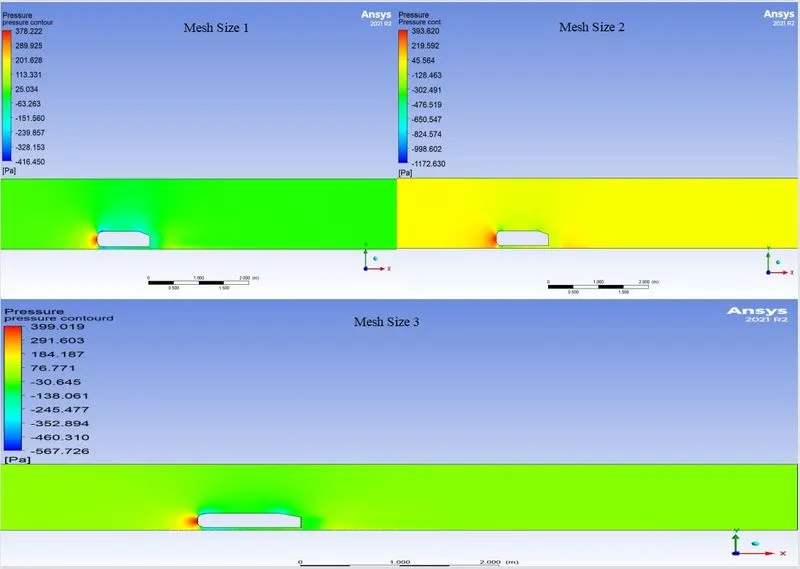
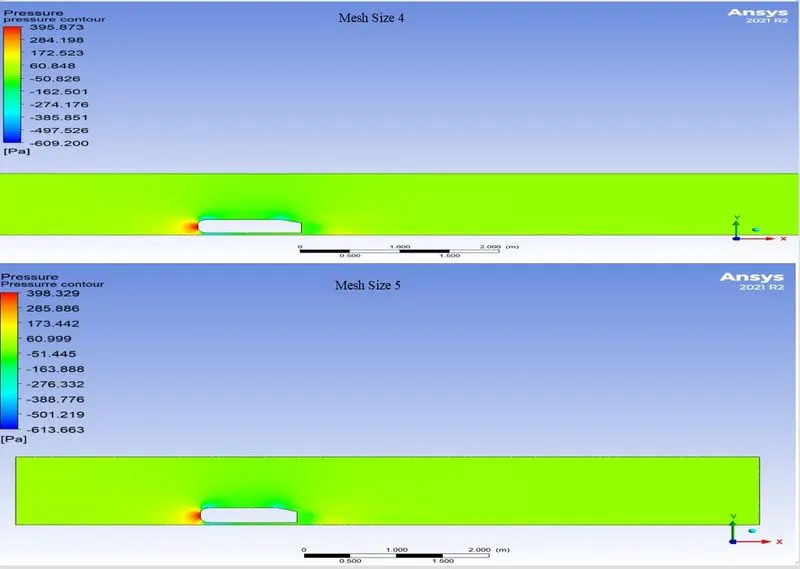
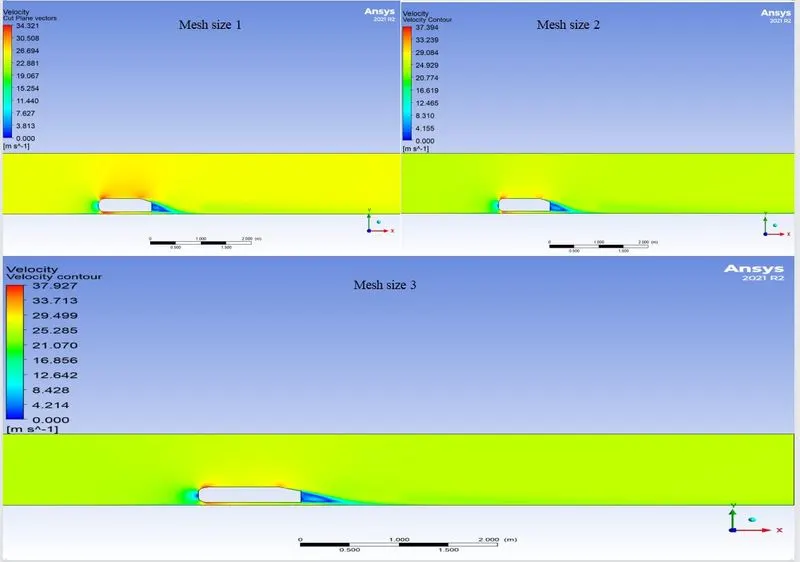
 \
\
Inference:
| Cell Count | Coefficient of Drag (Cd) | Coefficient of Lift (Cl) | Pressure at the Point [Pa] | Difference in Coefficient of Drag | Difference in Coefficient of Lift | Difference in pressure at a point | |
| Mesh Size 1 | 99491 | 0.368 | 0.285 | -15.731 | 33% | 8% | -43% |
| Mesh Size 2 | 241890 | 0.329 | 0.275 | -27.412 | 19% | 5% | -20% |
| Mesh Size 3 | 628061 | 0.302 | 0.283 | -34.223 | 9% | 8% | -2% |
| Mesh Size 4 | 1714591 | 0.286 | 0.274 | -34.906 | 3% | 4% | -5% |
| Mesh Size 5 | 3738766 | 0.277 | 0.263 | -36.744 |
Results are obtained by varying the mesh sizes for the particular external flow
Pressure obtained at a point in a wake region, point is placed exactly x=1.25 m,y=0.1 m,z=-0.08 m
For All these meshes with the element quality is greater than 70%.
1.As cell count increases the Drag coefficint decreases,lift coefficient decreases,pressure at the point decreases upto the certain mesh.
2. Difference in quantities of current mesh with the fine mesh calculated in percentages.
3.Mesh size 4 will tends to have a difference in all quantities less than or equal to 5%.
4.Mesh Size 4 is optimum to use those results.But the difference with experimental value of drag coefficient is about 13%
Conclusion
1.In order to explain the important phenomenon of boundary–layer separation,an accelerated flow with pressure drop is present on the front ,on the back should be presence of a decelerated flow with pressure increase for inviscid flow. After setting the flow in motion, as long as the boundary layer remains very thin, an almost inviscid flow first forms. For a particle in the outer flow moving on the front curved part, pressure is transformed into kinetic energy, and moving from rear slant part and rear vertical part, kinetic energy is transformed into pressure and some kinetic energy is observed by middle rectangular shaped section by friction . A fluid particle directly at the wall in the boundary layer is also acted on by the same pressure distribution as in the outer flow, since this is imposed on the boundary layer. Because of the strong friction forces in the thin frictional layer, a boundary–layer particle loses so much of its kinetic energy that it cannot manage to get over the “pressure mountain or building up a pressure” from . Such a particle cannot make much headway into the region of increasing pressure from starting point of rear slant to rear vertical ending point. It comes to a standstill, and is pushed backwards into motion by the pressure distribution of the outer flow.(shortly after starting) the reversed motion has just begun at the trailing edge.the boundary layer has thickened and the start of the reversed motion has moved forward considerably.That a large vortex has formed from the backflow and this is even larger. This vortex then soon separates from the body and moves on downstream. This process changes the flow portrait at the back of the body fully and the pressure distribution is drastically changed compared to that of inviscid flow.As the pressure distribution , there is quite a strong negative pressure in the region filled with vortices. This negative pressure is the origin of the large form drag of the body.in wake region vortices will formed may lead conversion to dynamic pressure (or) kinetic energy.Due to that negative pressure may araises in wake region
2.Point of separation is really important for drag,as angle increases the drag decreases and wake area also decreases and in turbulent region reynolds number increases.At smaller angle ,then drag increases,wake region increases and in laminar region.Importance of point of separation for various parameters and it has condition for separating a flow.
3.In present study ,For rear slant angle of 20 degrees to validate the case setup,initially Ansys Fluent has ran with velocity of 40 m/s and it as validated with the drag and lift coefficient with the difference of 6%.After that grid indendence test has done by changing a velocity of 25 m/s for various mesh size,from that Mesh size 4 and mesh size 5 has a diference for lift,drag coefficient,pressure at the point has less than or equal to 5%.And comparison of mesh size 4 drag coefficient with experimental value produces a difference about 13%
References:
1.Saurabh Banga , Md. Zunaid, Naushad Ahmad Ansari, Sagar Sharma,Rohit Singh Dungriyal,"An CFD Simulation of Flow around External Vehicle: Ahmed Body",IOSR Journal of Mechanical and Civil Engineering (IOSR-JMCE) ,e-ISSN: 2278-1684,p-ISSN: 2320-334X, Volume 12, Issue 4 Ver. III (Jul. - Aug. 2015), PP 87-94,www.iosrjournals.org ,DOI: 10.9790/1684-12438794.
2.S.R. Ahmed,G. Ramm and G.Faltin,"Some Salient Features Of The Time-Averaged Ground Vehicle Wake".
3.https://help.sim-flow.com/validation/ahmed-body
4.Boundary-Layer Theory,Klaus Gersten,Springer Publications
5.Separation of flow by Paul K.Chang,Pergamon Press.
6.Applied Computational Fluid Dynamics and Turbulence Modeling Practical Tools, Tips and Techniques by Sal Rodriguez,Springer publications
7.FLUID MECHANICS-FUNDAMENTALS AND APPLICATIONS by John M. Cimbala,yunus a. çengel,MCGRAWHILL publications.