Week 3 - External flow simulation over an Ahmed body.
Aim:-
To external flow simulation over an Ahmed body.
Objective:-
The objective of this project is to determine the aerodynamic forces on the Ahmed body such as drag and lift coefficient and to perform the grid independence test.
The expected results will include
1. Velocity and pressure contours.
2. The drag coefficient plot for a refined case. ( For a velocity of 25m/sec, the drag coefficient should be around 0.33).
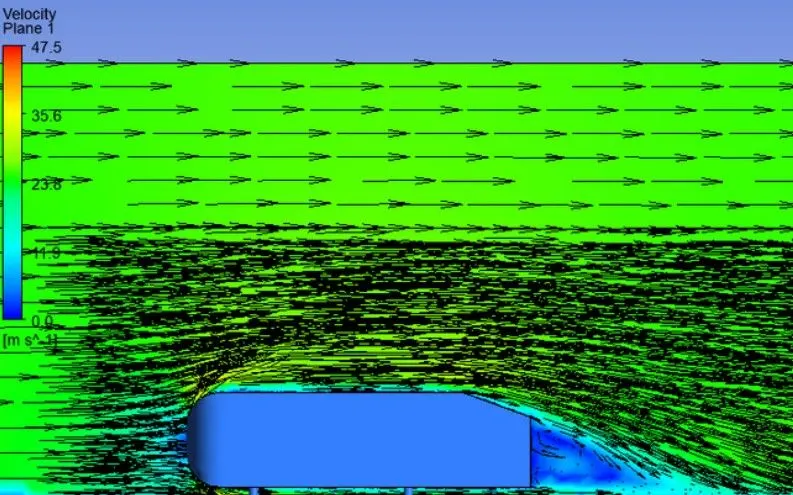
3. The vector plot clearly showing the wake region.
4. Perform the grid independence test and provide the values of drag and lift with each case.
Abstract :-
Ahmed body: The Ahmed body was first created by S.R. Ahmed. It is an important benchmark for aerodynamic simulation tools. It will be clearly shown in the sketch below that it has a length of 1.044 meters, the height of 0.288 meters and the width of 0.389 meters. It also has a 50 millimeter cylindrical legs attached to the bottom of the body and the rear surface which has a slant that falls of at 35 degrees.
The flow for the model is turbulent which is based on velocity and body length. For the default mesh size in ANSYS-FLUENT we will use k-ε">k−ε model and for the later stage k-ω">k−ωSST model is used.
Importance of Ahmed body :-
The drag force is an important factor considering fuel consumption. As the drag force increases the fuel consumption also increases which in turn becomes expensive for the car owners. As the burning of fossil fuels becomes an issue, the manufacturers are pressing for fuel-efficient cars. One of the main factors considering the car is fuel-efficient or not is the car's geometry.
Complex shaped cars are very challenging to model and its difficult to quantify the aerodynamic drag computationally. The Ahmed body is a benchmark model widely used in the automotive industry for validating simulation tools.
Negative pressure in the wake region
The wake is a broad region of low-pressure turbulent air that forms behind a moving object when the air moving over it is split at the rear end. This helps create pressure drag, which has an impact on how well a vehicle performs.
When the vehicle is moving at a certain speed, the fluid applies a viscous force to it for as long as it is in the viscous sublayer of the boundary. Negative pressure is created in the area around the wake of the vehicle when the fluid reaches the rear of the vehicle and separates from the body surface. Depending on the geometry of the car and the Reynolds number, the fluid will move differently around the vehicles.
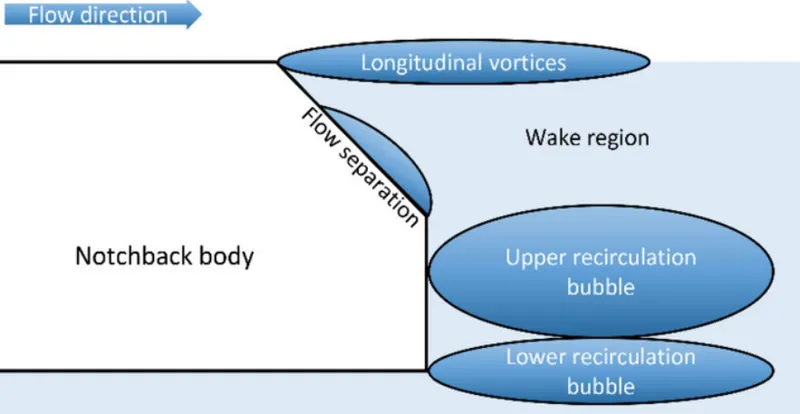
Significance of point of separation
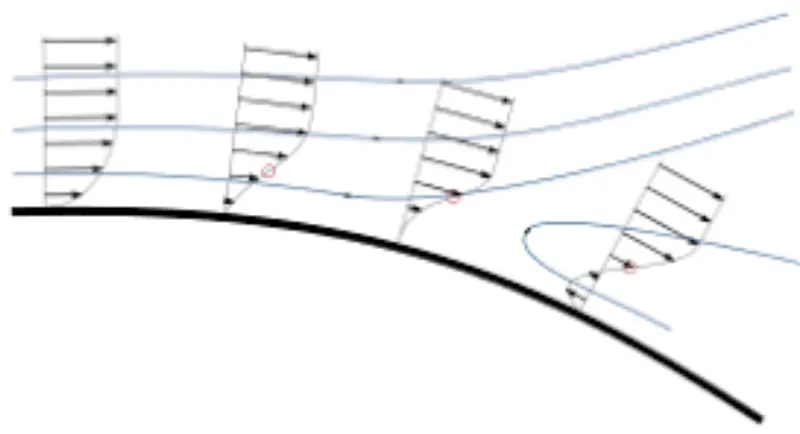
When there is a surface discontinuity or an area of negative pressure gradient, the point of separation will happen (a sharp end or rear portion of the car).
The viscous force will increase as the flow attaches to the vehicle's body, increasing pressure and slowing down flow before the vehicle's rear end. As soon as the air encounters the sharp turn, the velocity decreases, creating the wake region's negative pressure region.
The above illustration demonstrates how the flow detaches from the boundary layer at the point of turning and then reattaches to it after passing through a region of recirculation.
procedure :-
Ahmed's body is loaded into the Spaceclaim.
A single enclosure is drawn across Ahmed's body.
Now the geometry is loaded for meshing.
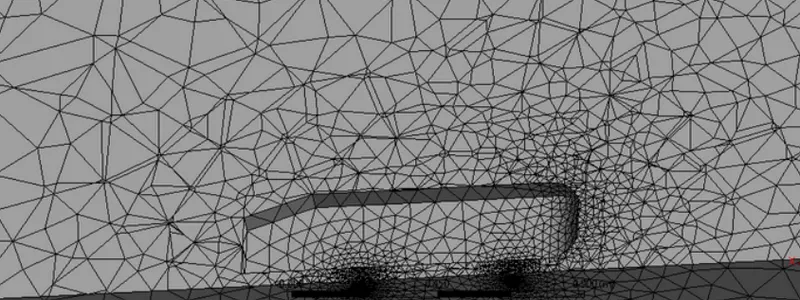
A baseline simulation is set up with the default element size of Ansys (413.6 millimeters).
A named selection is created for the enclosure viz; inlet, outlet, symmetry.
To create the named selection for the car the enclosure faces are hidden and box select is selected from the meshing toolbar and (car wall) name is given to it.
Ansys Fluent window is opened and the geometry is loaded.
Steady-state, the density-based solver is selected.
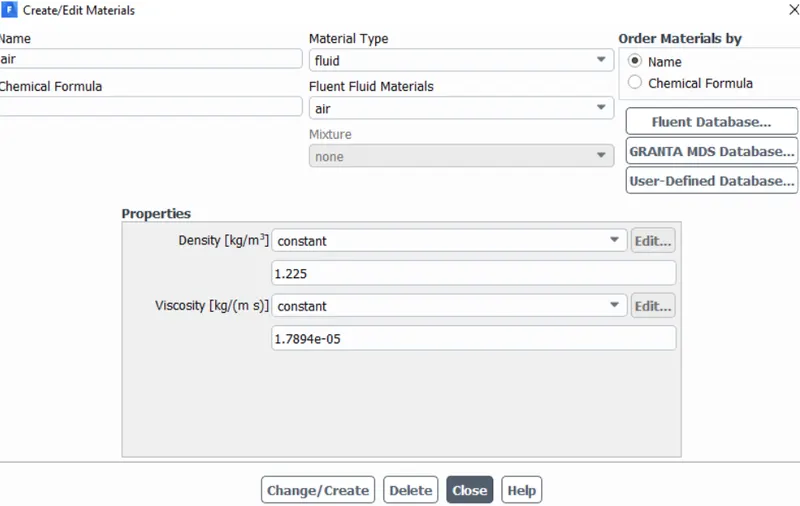
Reference values are updated as per the prescribed conditions.
In the inlet boundary condition, inlet velocity is 25 msec">msec and 300">300 K">K temperature are set.
Drag-coefficient plot and lift-coefficient plot is created by setting the reference as (car walls).
Hybrid initialization is selected.
The solution is initialized by hitting t=0">t=0.
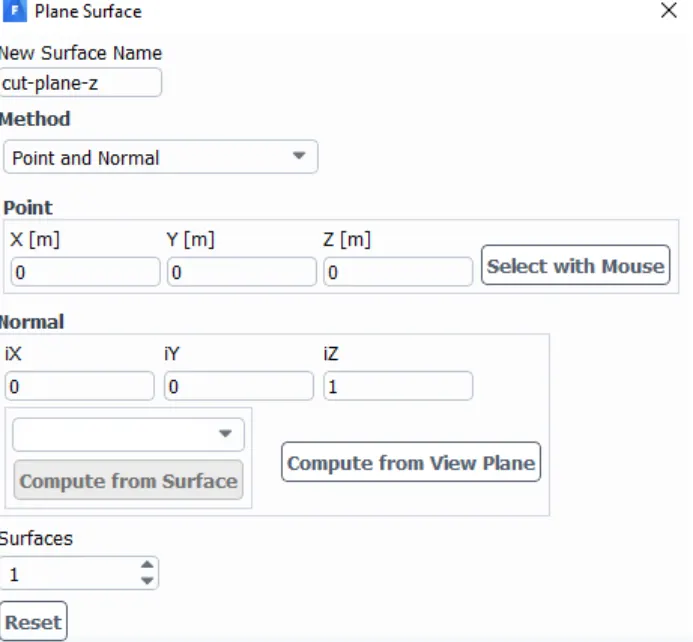
The cut-plane-z is created along Ahmed's body.
The velocity contour, pressure contour is created along the cut-plane-z.
The animation video is created for the velocity contour.
The simulation is executed for 1000 iteration
Simulation with a finer mesh using k-ω">k−ωSST">SST.
The first simulation ran successfully.
The geometry is loaded into the SpaceClaim.
The region of local refinement is created along Ahmed's body.
As the body is perfectly symmetric, the simulation is executed by considering the only half body. This is the best practice where we can save on the number of cells and get the results faster as well.
The geometry is loaded for meshing. The multizone method is selected for the outer enclosure to provide hexahedral mesh which provides accurate results in simulation.
The element size for the first enclosure will vary as (100mm, 90mm, 80mm), the element size for the second enclosure will vary as (50mm, 45mm, 40mm), the element size of the leg of Ahmed's body will be 5mm, the first layer thickness, inflation layer, and the maximum thickness will be varied accordingly to imitate the experimental results.
The rest procedure is the same as above, the necessary contour plot and graphs have been uploaded respectively.
Ahmed body model
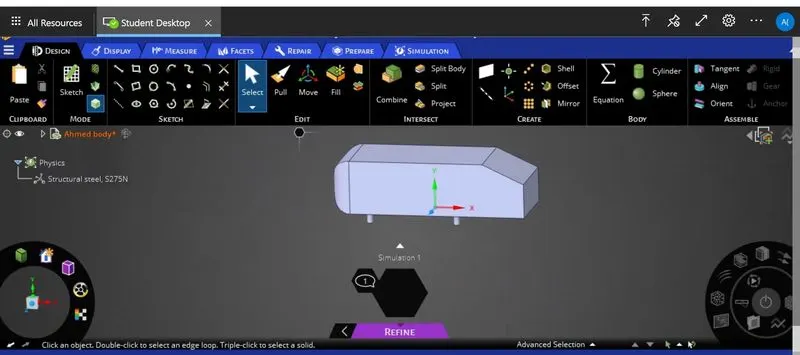
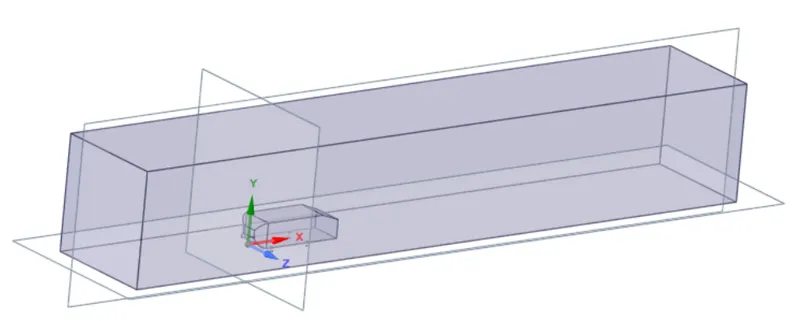
Creating an enclosure across Ahmed body
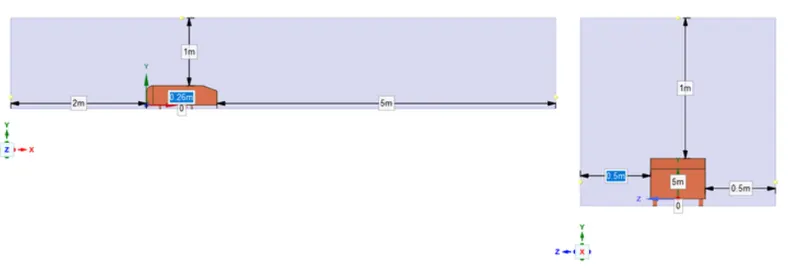
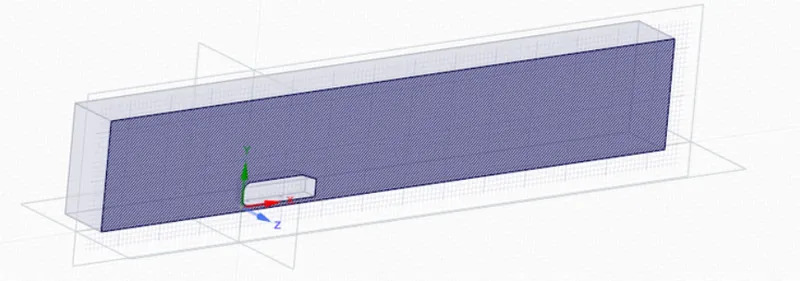
Creating a plane section on the origin
Simulating with a default mesh size of Ansys-Fluent
Creating named selection to set up physics and boundary conditions.
Inlet boundary condition (velocity inlet).
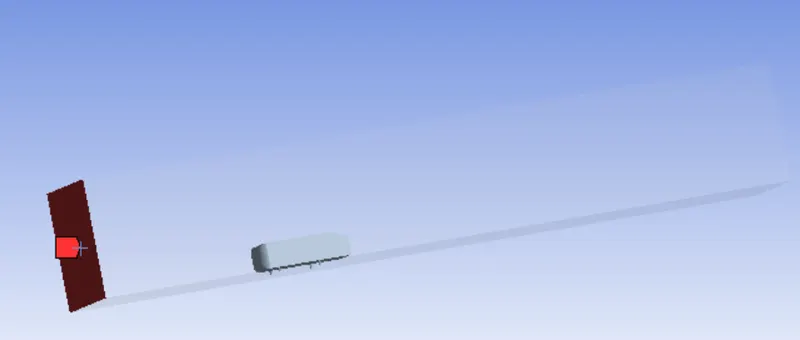
Outlet boundary condition (pressure outlet)
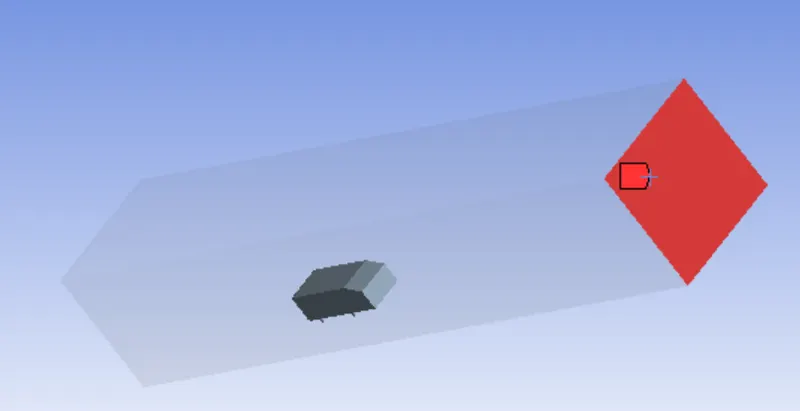
Thus the mesh is created inside Ahmed's body which is not good for simulation because the flow outside Ahmed's body is taken into account. It can be fixed by going back to Spaceclaim, one of the copies should be suppressed for physics.
Simulation procedure
Setting up of physics
Creating a cut plane to see the velocity change along Ahmed's body
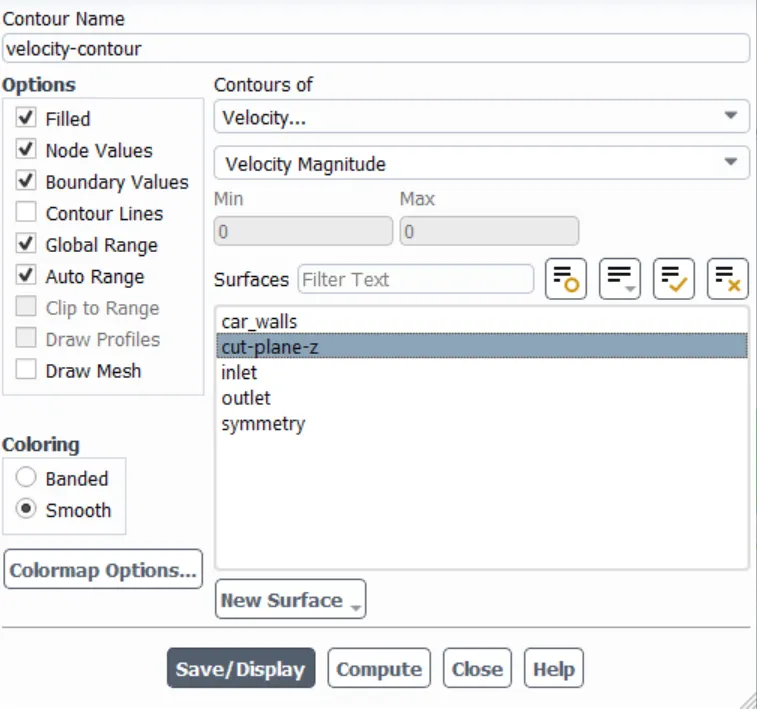
Results
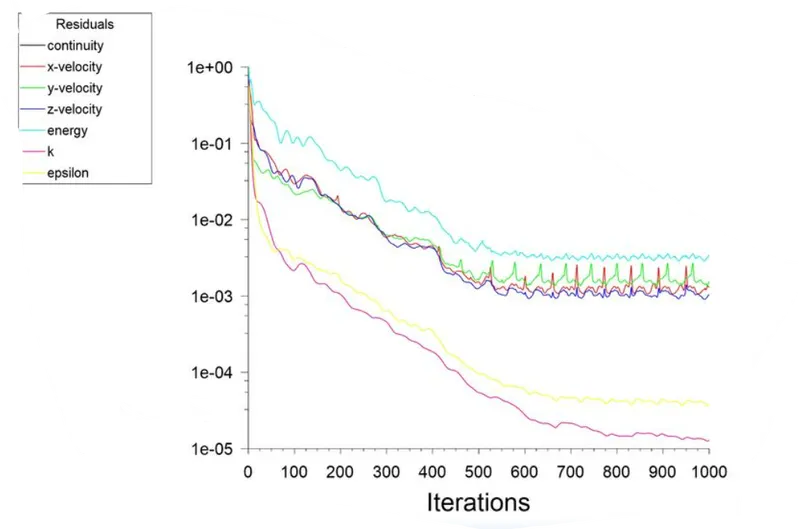
Residual plot
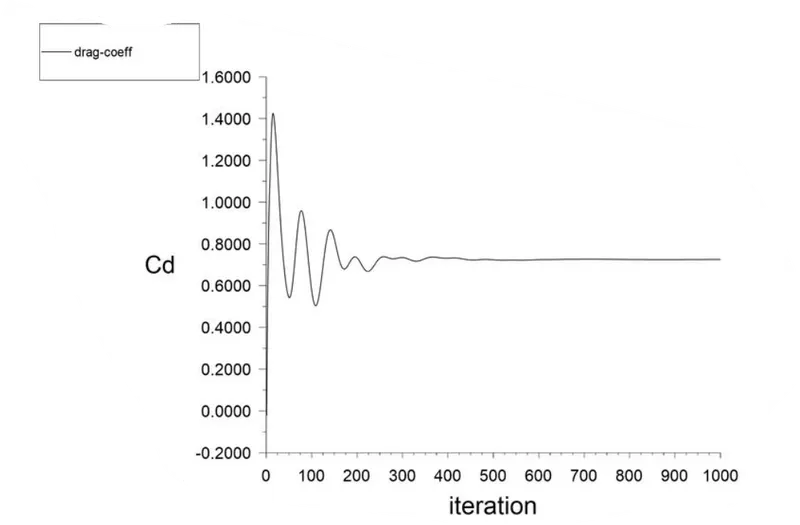
Drag-coefficient plot
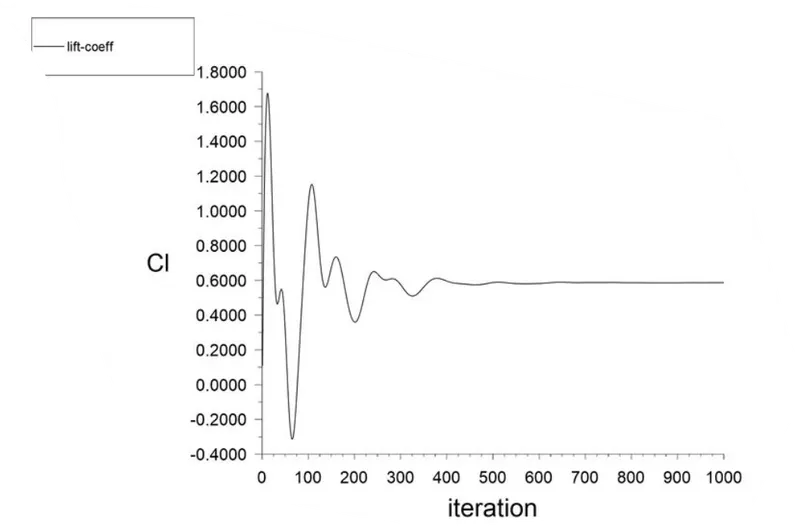
Lift-coefficient plot
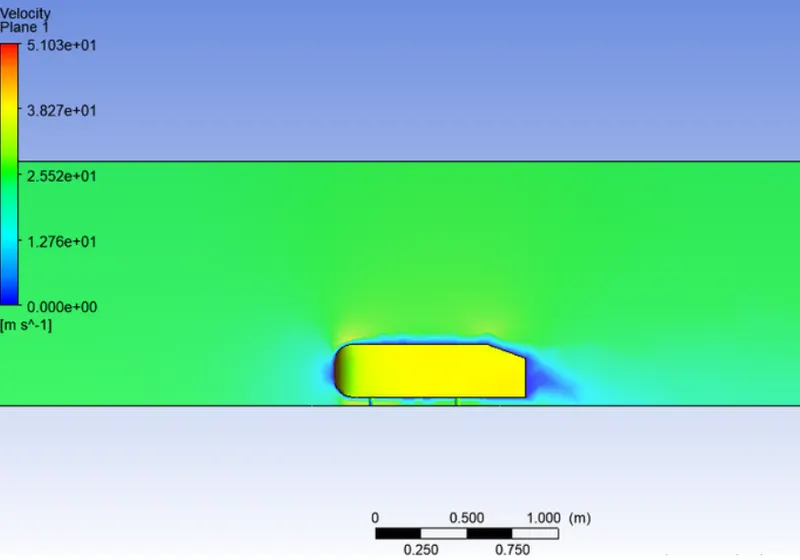
Velocity contour
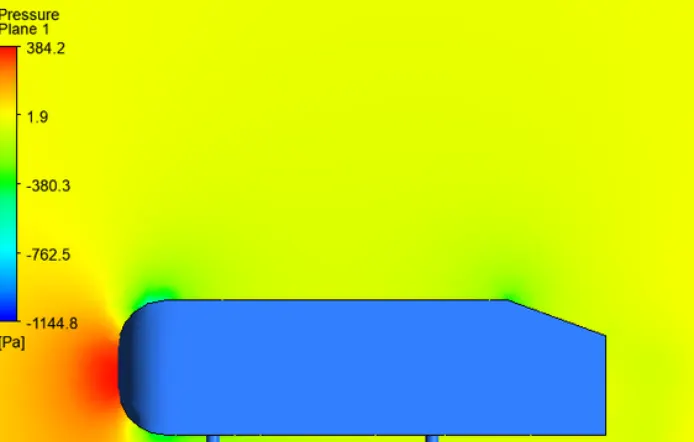
Pressure contour
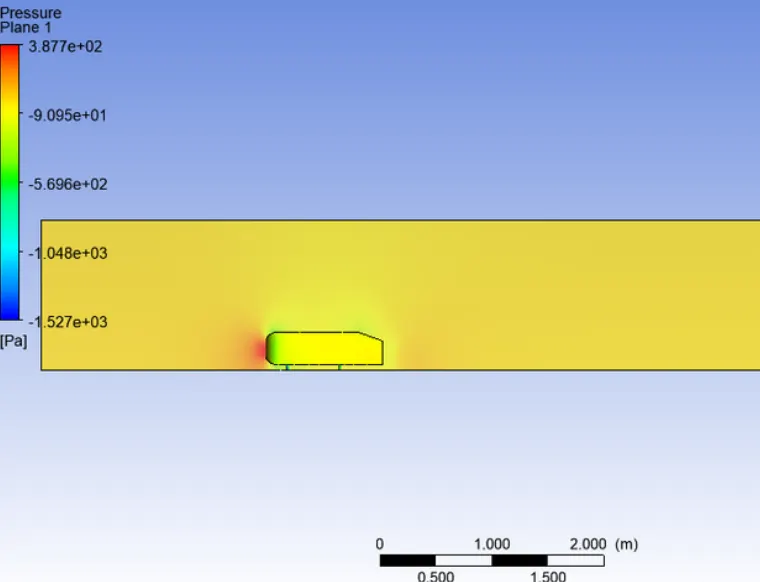
It can be inferred from the following figure that the results of the base simulation are distorted and do not capture the turbulent flow behind the body perfectly. This simulation captures the wake length, high velocity, low-velocity areas which can be used to further refine the mesh value around the Ahmed body and add a local refinement around
Case 2:-
The drag coefficient plot for a refined case. ( For velocity of 25m/sec, the drag coefficient should be around 0.33).
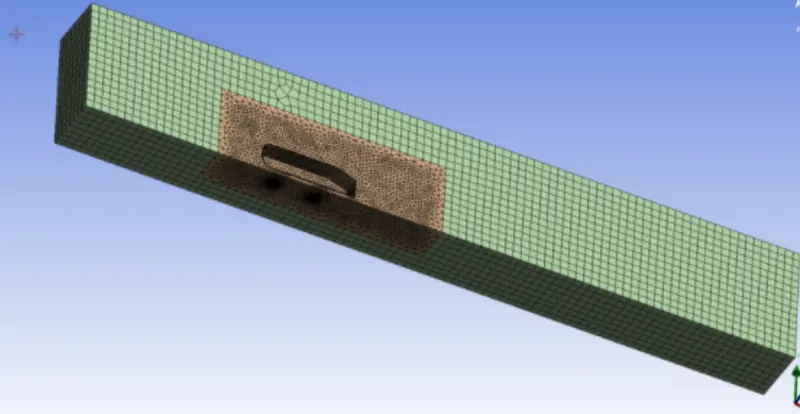
Velocity and pressure plot:
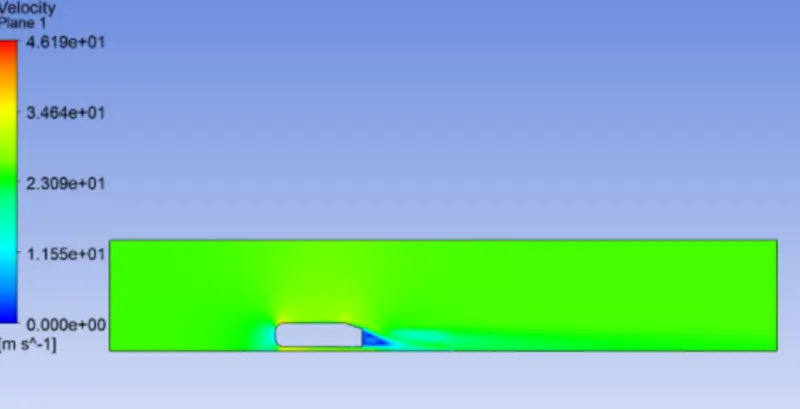
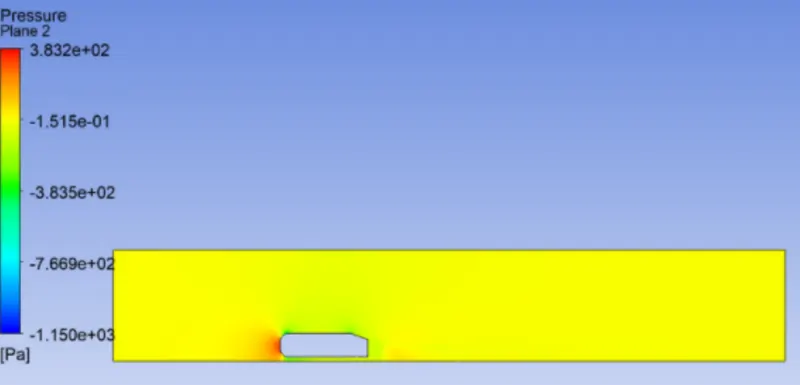
Wake region
Conclusion:-
1. High pressure is formed at the frontal area of the Ahmed body due to the loss of kinetic energy of the air.
2. The adverse pressure gradient is created near the wake regions because of the flow separation which is occurring because of the geometry of the model. As a result flow separation alters the pressure gradient which in turn affects the drag and lift coefficients.
3. In order to reduce the size of the wake region, detachment of the fluid should be farther away from the body which can be achieved by an increase in the slant angle.
4. With the increase in mesh size, the numerical results approach closer to experimental results.
References:-