Week 3 - External flow simulation over an Ahmed body.
AIM:
- To perform the simulation of external flow over the given Ahmed Body using ANSYS FLUENT by considering the condition for velocity of 25 m/s in the question.
- To simulate and compare the results of external flow over the given Ahmed body geometry with base line meshing as well as fine meshing and to perform the grid independence test.
- To plot and study the velocity and pressure contours and of the same.
- To plot the vector plot of velocity and the plot of coefficient of drift and drag.
INTRODUCTION
- The Ahmed body is a generic car body (a simplified vehicle model). The airflow around the Ahmed body captures the essential flow features around an automobile and was first defined and characterized in the experimental work of Ahmed. Although it has a very simple shape, Ahmed body allows us to capture characteristic features that are relevant to bodies in the automobile industry. This model is also used to describe the turbulent flow field around a car-like geometry.
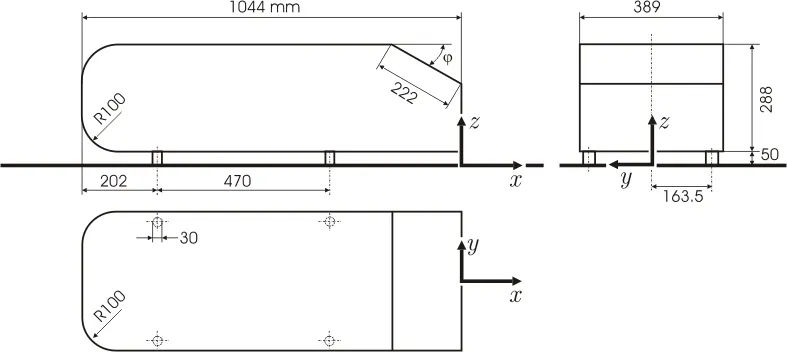
- Schematic diagram of the Ahmed body is shown in the figure below
| S.No. | Type | Application |
| a. | Notchback | Family car. the most streamlined shape. |
| b. | Fastback | Supercar, sports car. The wake area is small. |
| c. | Hatchback | Small family car. |
| d. | Squareback | station wagons, Sport Utility Vehicles (SUVs), vans and buses. The wake area for this type of design is large. |
Q.1. Describe Ahmed's body and its importance:
- The Ahmed model is simple and free from all kinds of accessories as well as wheels; nevertheless it can be used to study the aerodynamic behaviour of a road vehicle based on the main features such as the slanting surfaces. This model is primarily designed to study the effect the slant angle (α) at the end part of the model on the drag coefficient and vortices behind the vehicle.
Q2. Explain the reason for the negative pressure in the wake region.
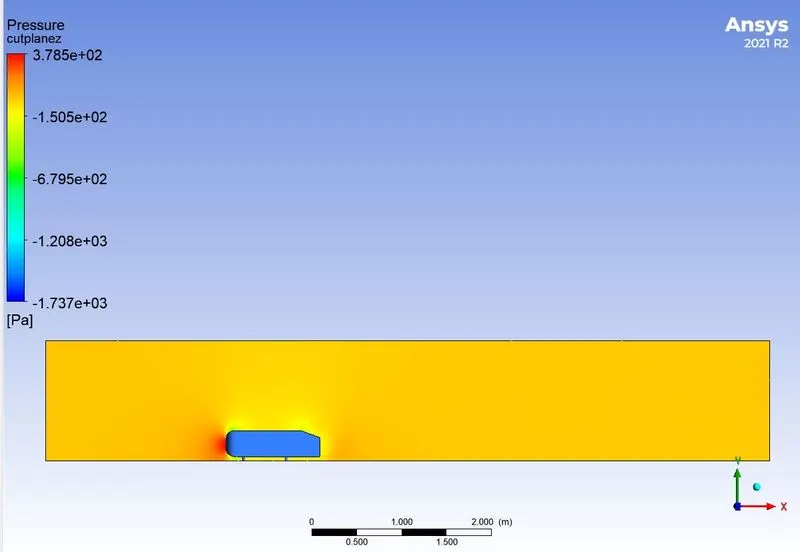
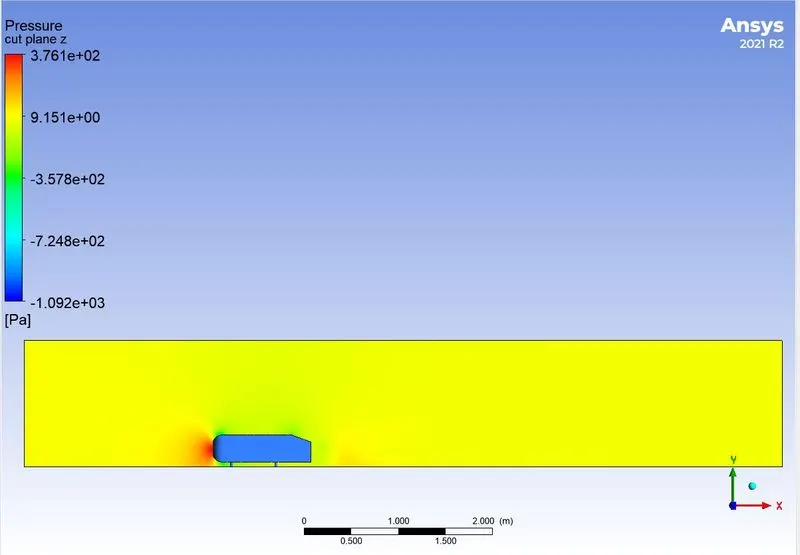
- The reason for the negative pressure in the wake region is due to recirculating flow as fast moving air past the body is not able to flow through the immediate back of the body thus it create a region where there is no pressure drop and generate a negative pressure in the wake region. The same can be obsereved in the pressure contour where a negative pressure was observed at the wake region.
Q3. Explain the significance of the point of separation.
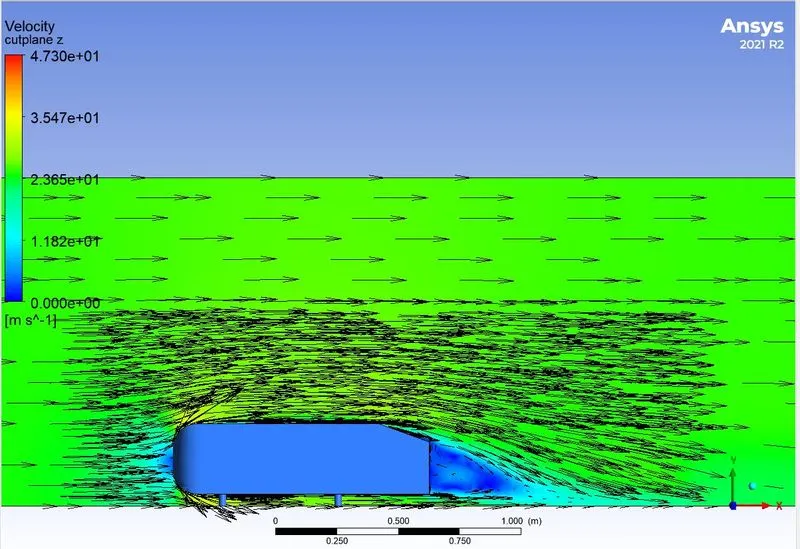
- Point of separation is the main important aspect of pressure drag at wake region. Point of separation controls the flow of air around the body by redusing the recirculating zone by allowing the air to flow through the body maximum helps to reduce this pressure drag. Thus point of separation plays an important role in vehicle dynamics.
SOLVING AND MODELLING APPROACH
- Task given here is to simulate the flow over the Ahmed body. Hence first of all the given body sholud be enclosed then only we can simulate flow over the body. As the body is perfectly symmetric, we can run the simulation by considering the only half body.
- Enclosed fluid region is only to be considered while simulating the flow over the body. Hence meshing sholud be done only in the enclosed region. The Ahmed body will act as the wall.
- Fine meshing is to be given near the Ahmed body so as to capture the coefficient of Lift and drag as well as the wake regions and separation points.
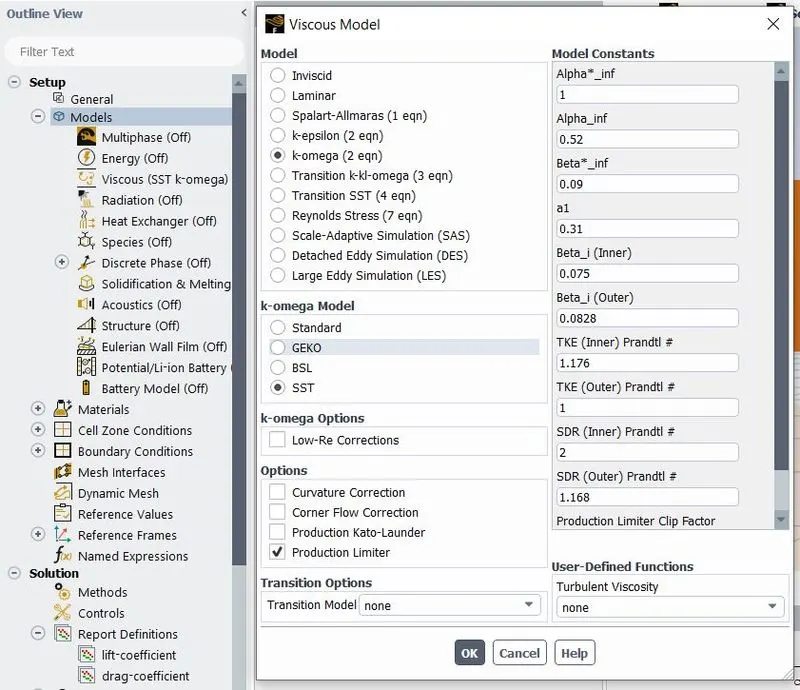
- k-omega SST model will be used since the flow is to be simulated near the wall as well as away from the wall.
- Pressure based solver will be used since the velocity or Mach number used for the simulation is below 0.3. If it is above 0.3 then Density based solver is the best choice.
- Grid Independency test will be done so as to get the best results for the appropriate mesh i.e., body will be simulated for coarse, medium and fine meshes and compare the results to find the out which mesh is correct.
PRE-PROCESSING AND SOLVER SETTING
Geometry
-
Open ANSYS Workbench 2022R2 select Fluid Flow (Fluent) from Toolbox.
-
Rename the file and left click Geometry and select New Spaceclaim Geometry.
-
Open the geometry STEP or SLDPRT of the geometry in spaceclaim.As the body is perfectly symmetric, the simulation can be performed by considering the half body. For that use split body command in SpaceClaim to perform the operation.
-
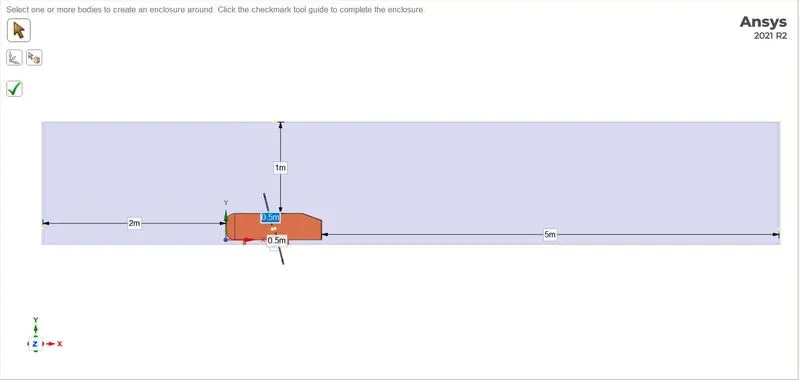
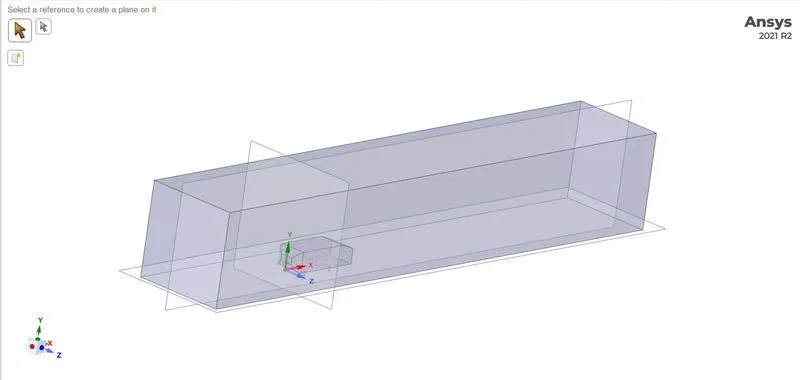
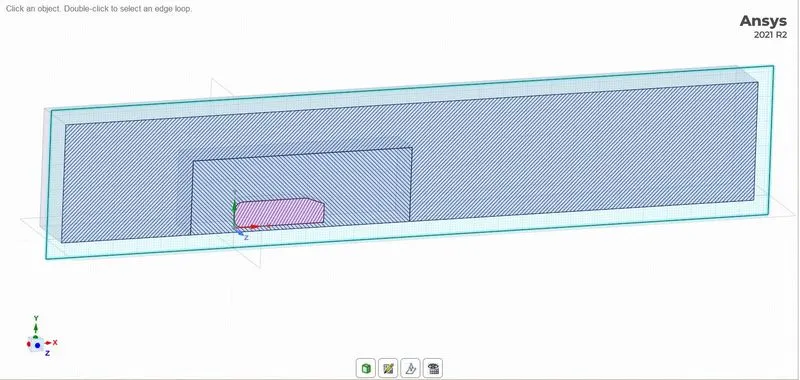
Create a wind tunnel by using enclosing the geometry. For that go to Prepare > Enclosure > draw an enclosure and provide the dimension. Front face, Rear face, Top face, Bottom face and side faces should be at a distance 5m, 2m, 1m, 0m, 0.5m respectively.
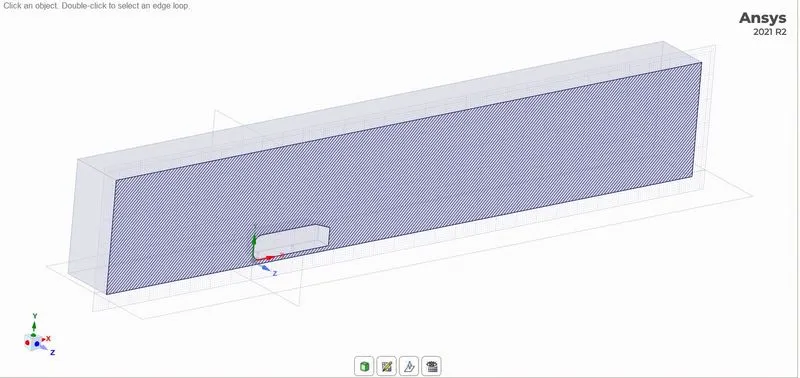
- To create fine mesh, another enclosure is created around the Ahmed body which is smaller in size than the first enclosure.As the main focus is close to car geometry it is advisible to provide fine meshing near to car walls to do so create one more enclosure with front, back, top and bottom faces at 1m, 0.5m, 0.5m, 0m respectively as shown below.
- Delete the overlapped surface by selecting Interference from Prepare menu. From the Analysis section share topology should be turned on as Share.
Mesh
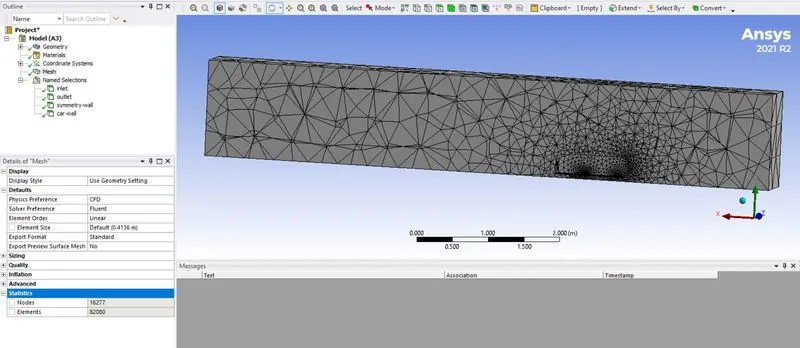
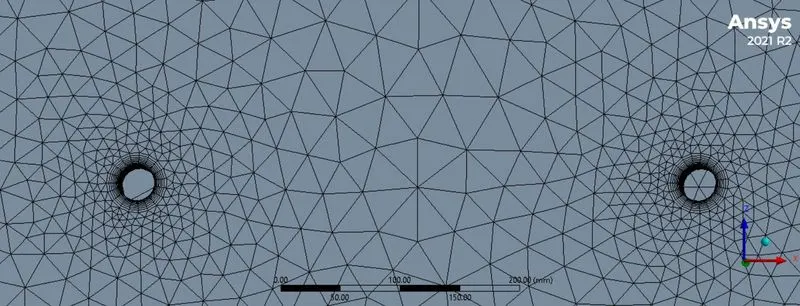
- Close SpaceClaim and double click on Mesh. Meshing window will appear. Mark Inlet, Outlet, symmetry and car-wall on geometry by right clicking each part and selecting Create Name Selection. Generate mesh with an appropriate element size to get a base line meshing on the surface of geometry. The figure shown below show the geometry after meshing.
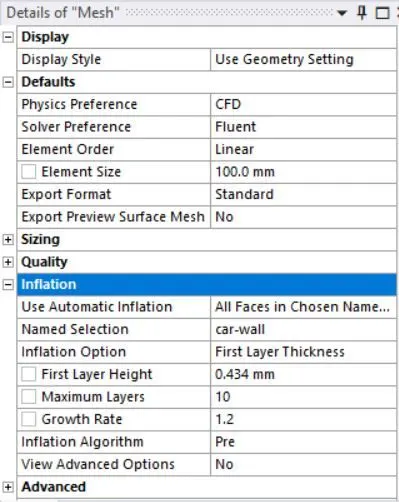
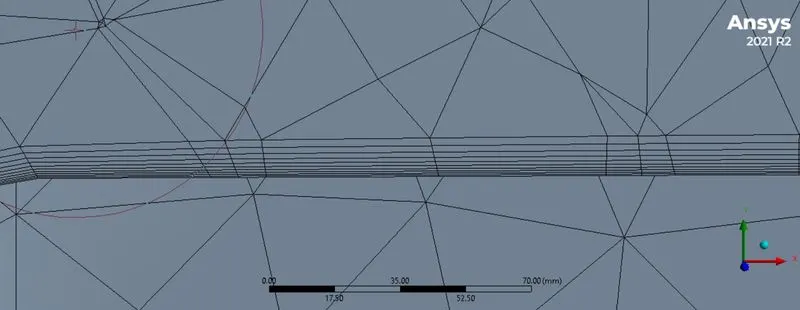
- To create fine mesh, Multizone Method is used to obtain maximum hexa meshing on the surface geometry and also provide body, face sizing and inflation layers with appropriate element size for the geometry as shown in the figures below.
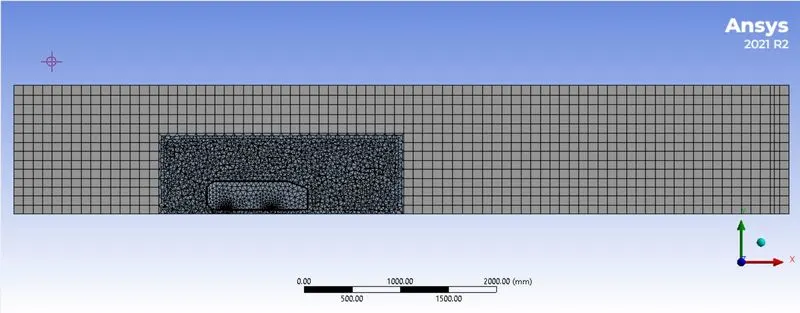
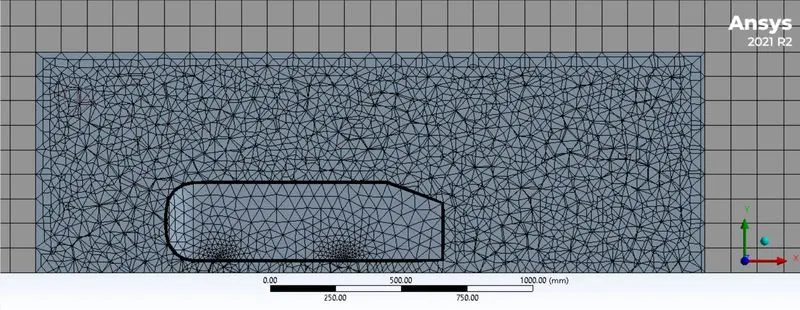
- For velocity 25 m/s , the Reynolds number obtained is 1,779,926.232. This indicates that the flow is turbulent. Y+ value is taken as 30 and the element size is 0.434 mm is given for getting the inflation layers.
- Mesh element size is taken as 100mm and for the second enclosure the element size is taken as 50 mm.
Solver settings
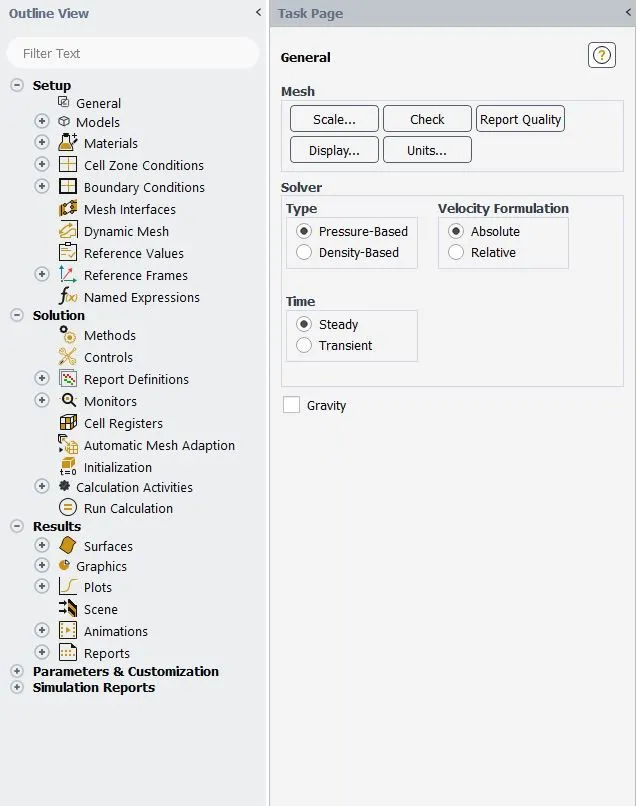
- The velocity used is 25 m/s which is less than 0.3 in terms of Mach number. Hence pressure based solver is used to run the simulations.
- As mentioned earlier, the flow here is turbulent hence a turbulent model is used for further simulations. The right choice is the k-omega SST model since it will simulate the flow near the wall as well as far from the wall.
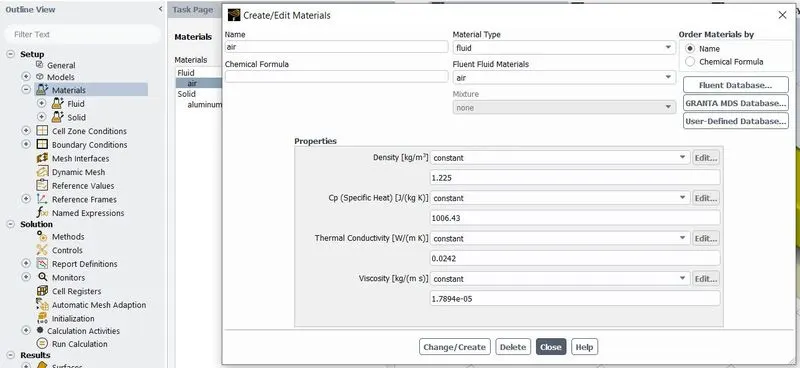
- The material used here is air and default material settings is used for the fluid flow.
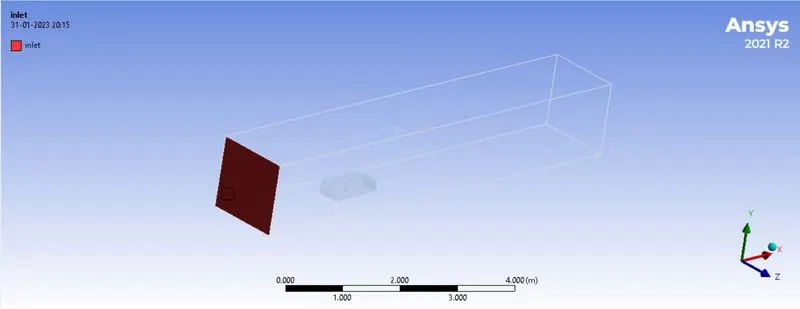
- Boundary conditions are asigned accordingly as shown in the figures below.
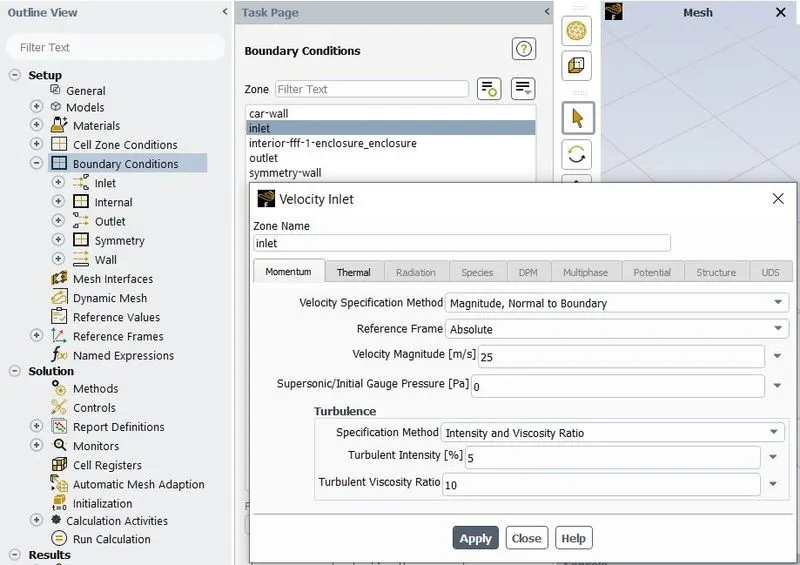
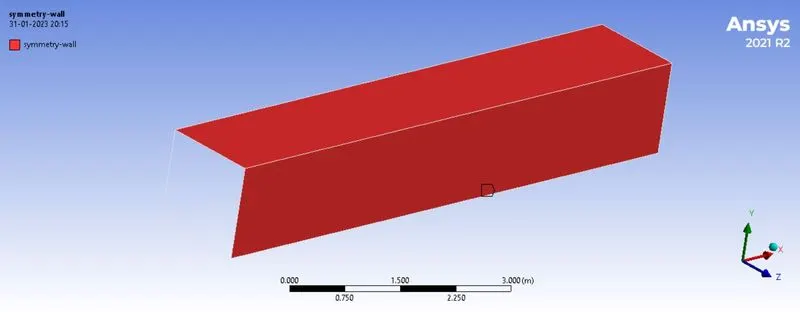
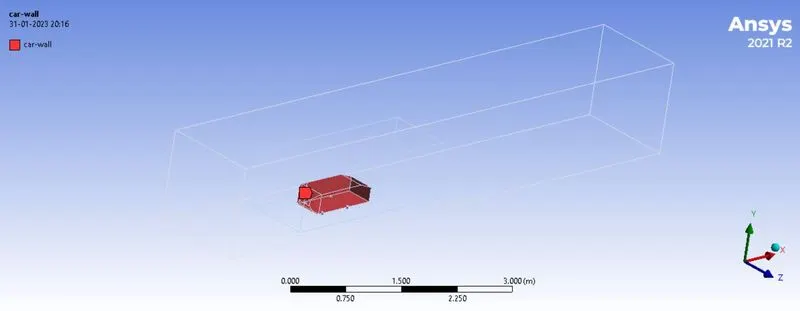
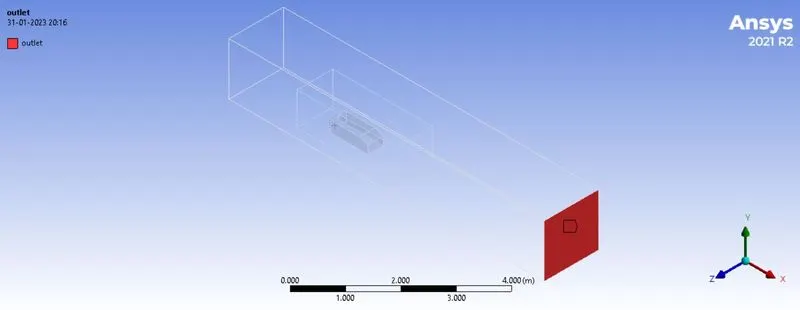
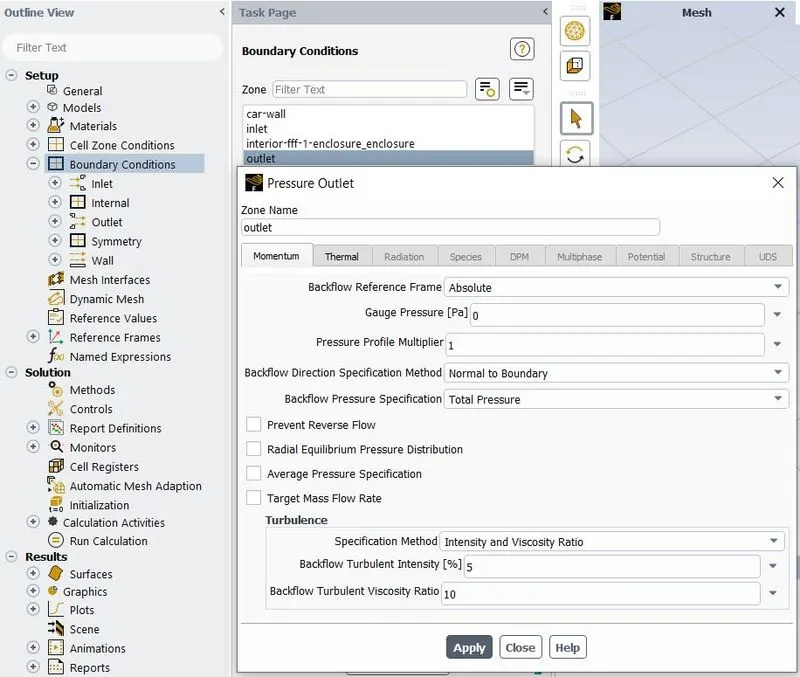
- For outlet Pressure boundary condition is applied.
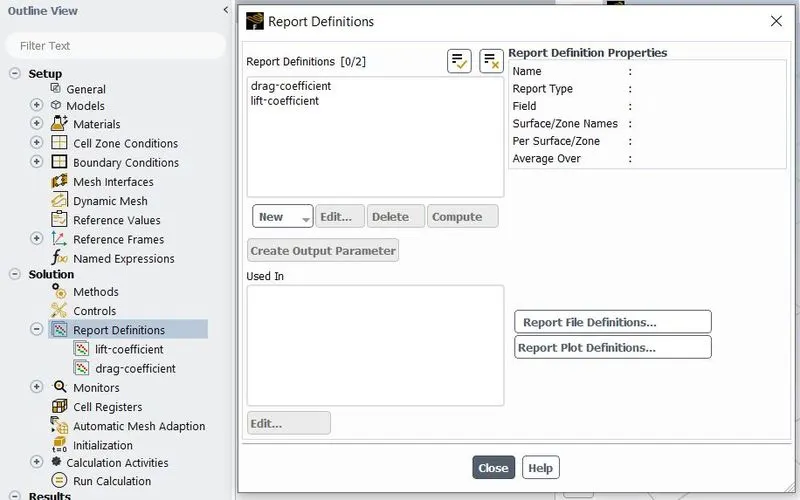
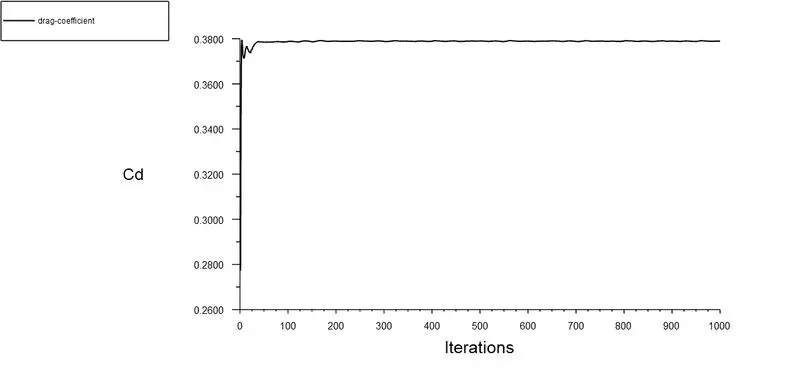
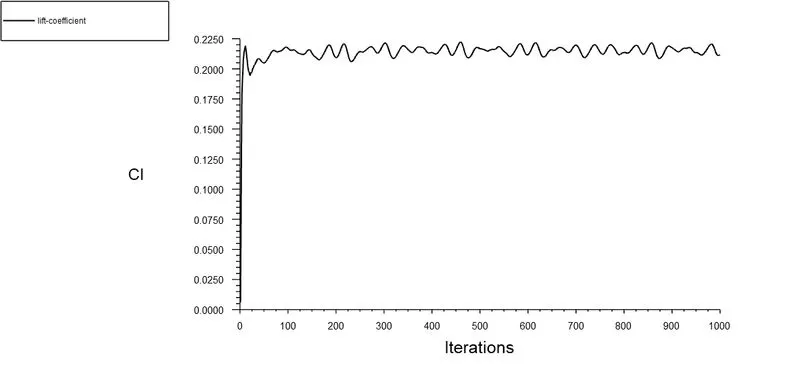
- Coefficienty of Drag and Coefficient of Lift is to be calculated and plotted hence these are to be asigned in the report definitions.
- Hybrid initialization is to be done before simulating the flow over the body.
RESULTS
Coarse Mesh (Default mesh element size)
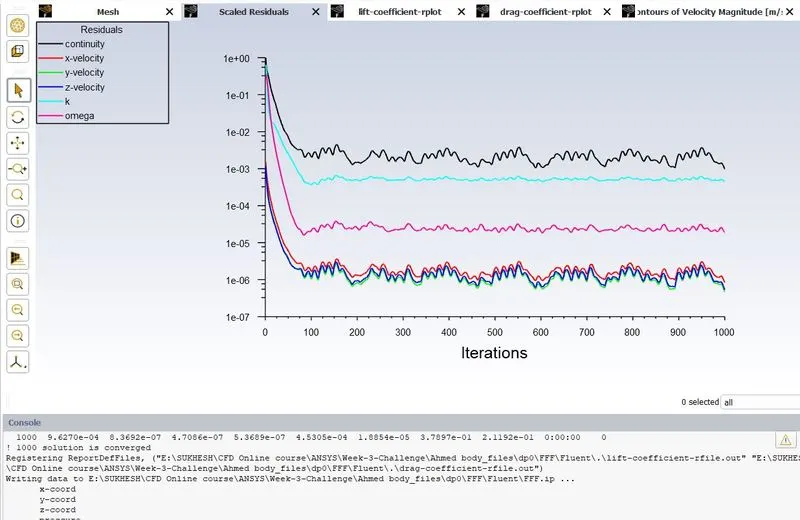
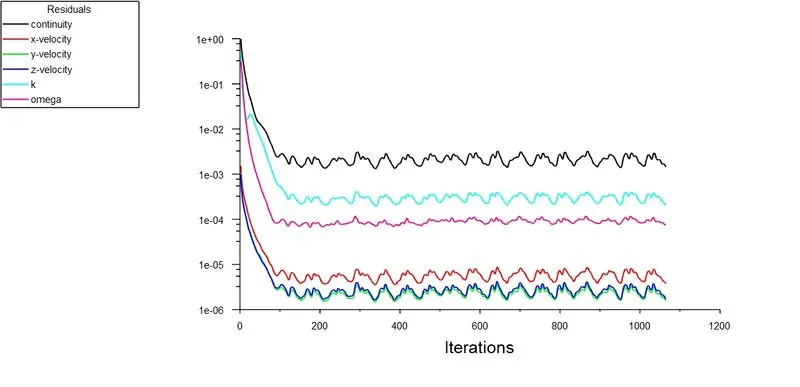
- Residual plot
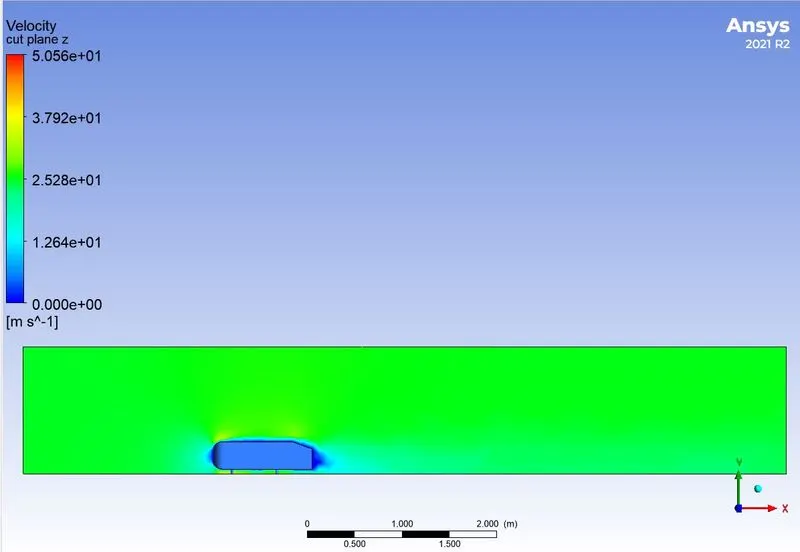
- Velocity and Pressure Contour
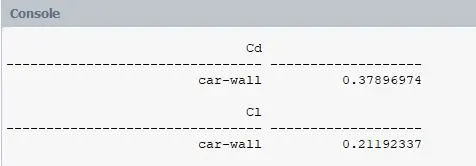
- Cd and Cl plots and its computed value
Medium Mesh (Outer enclosure = 100 mm and Inner enclosure = 50 mm)
- Residual plot
- Velocity and Pressure Contour
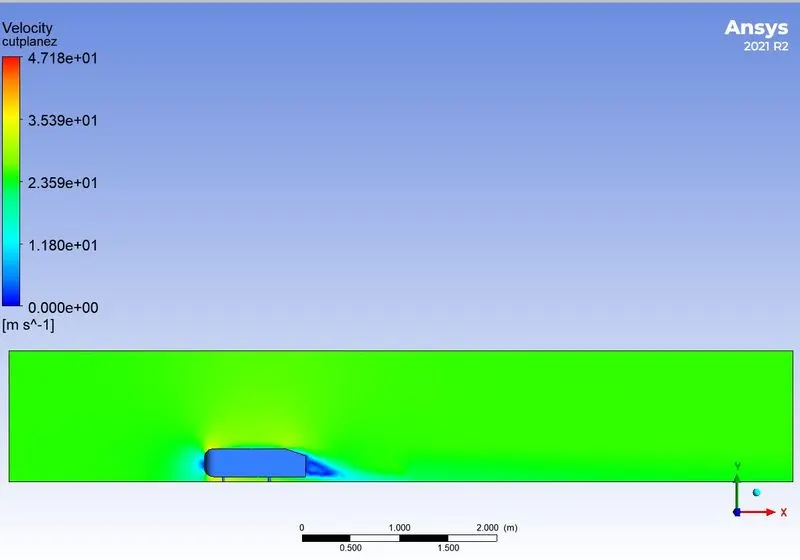
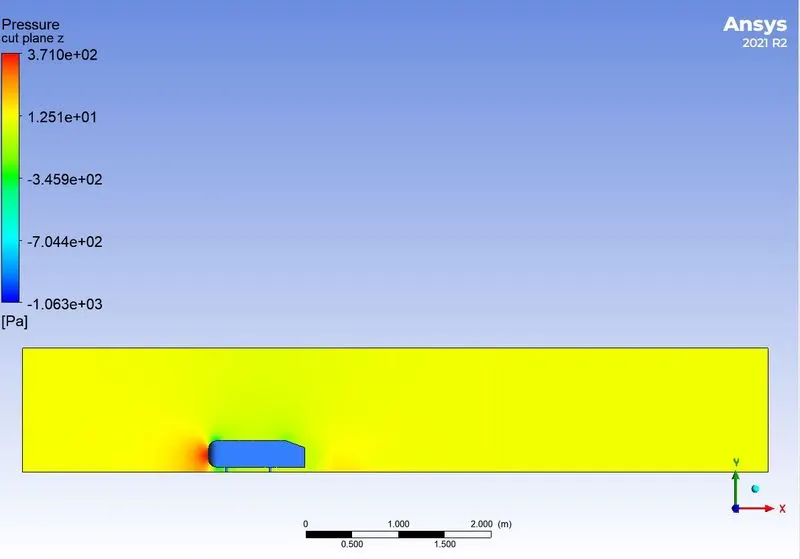
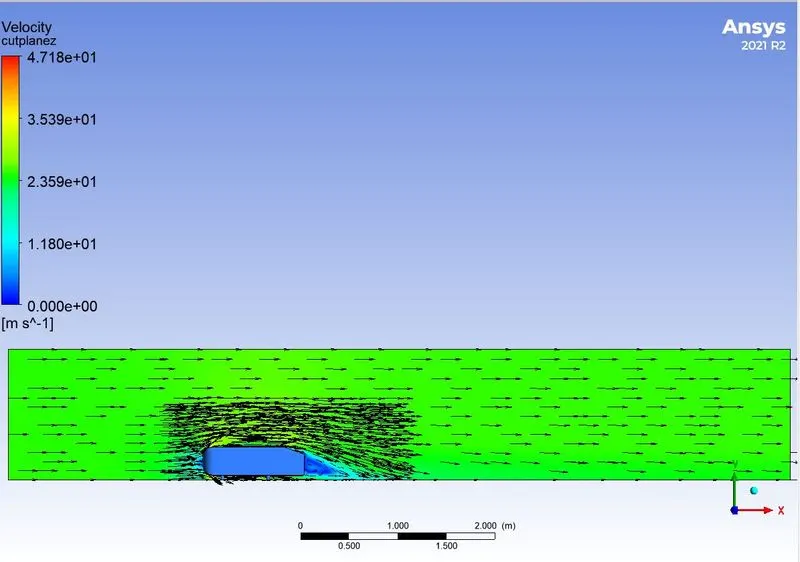
- Velocity vector contour
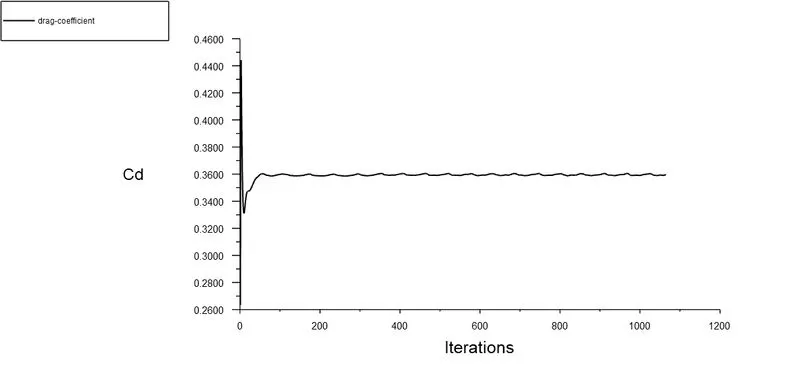
- Cd and Cl plots and computed values
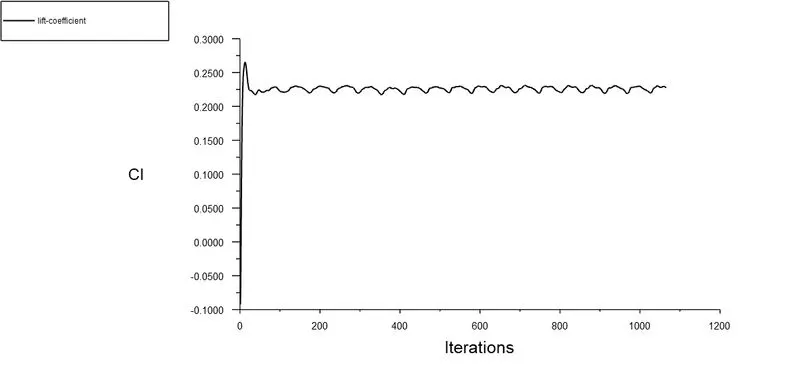
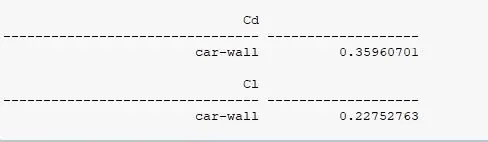
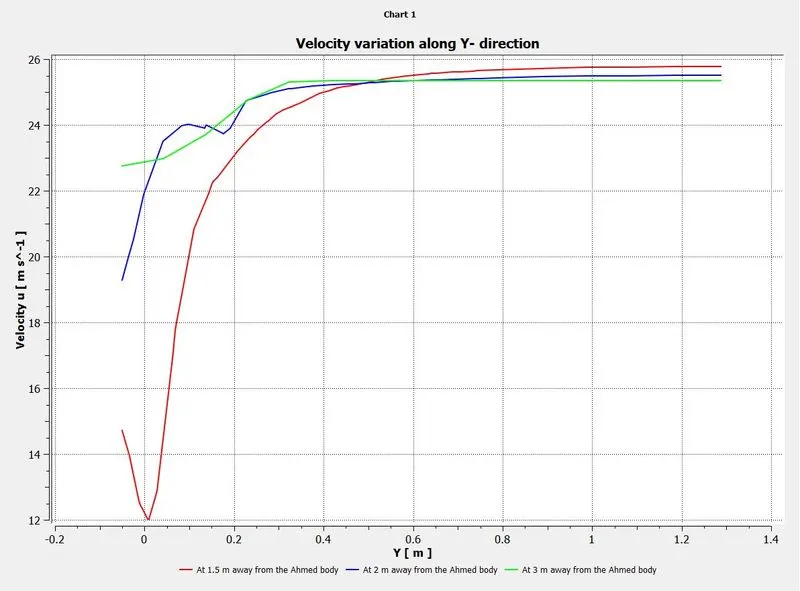
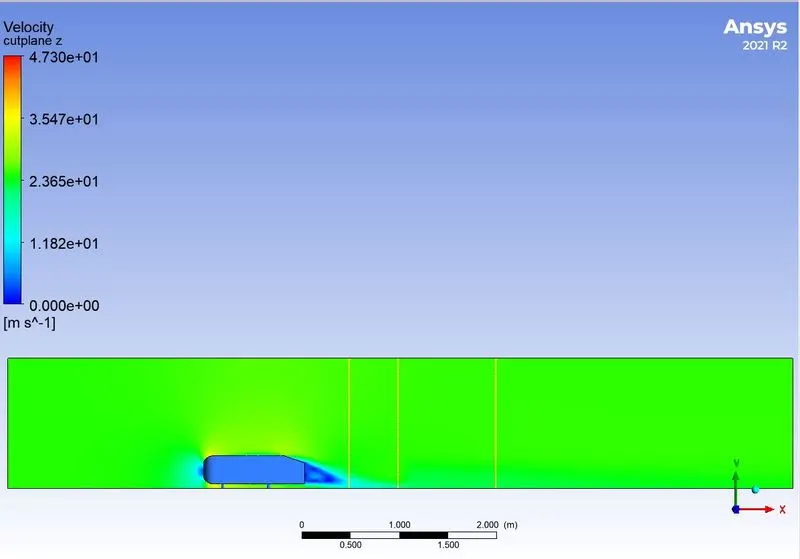
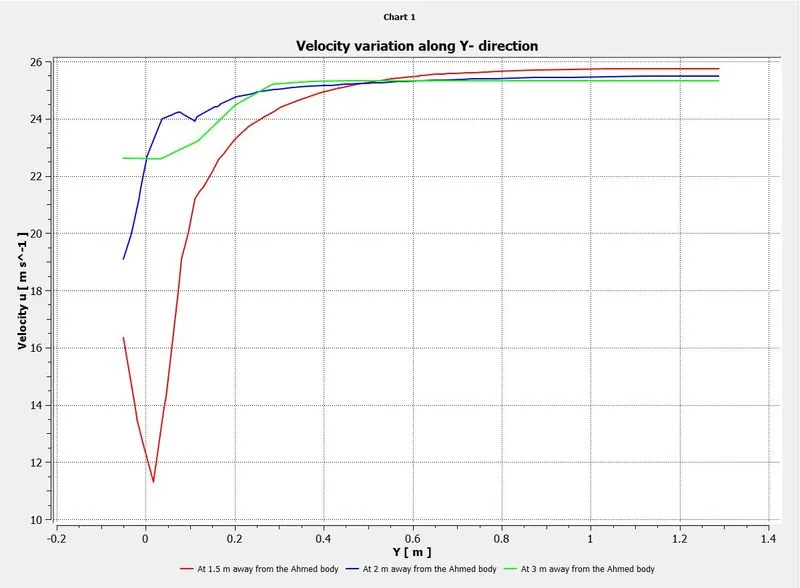
- Velocity variation along Y- direction plot
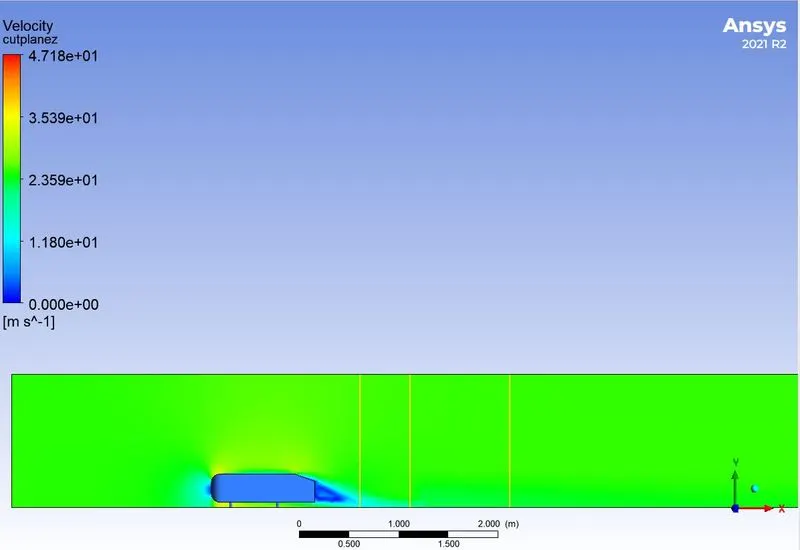
Fine Mesh (Outer enclosure = 90 mm and Inner enclosure = 40 mm)
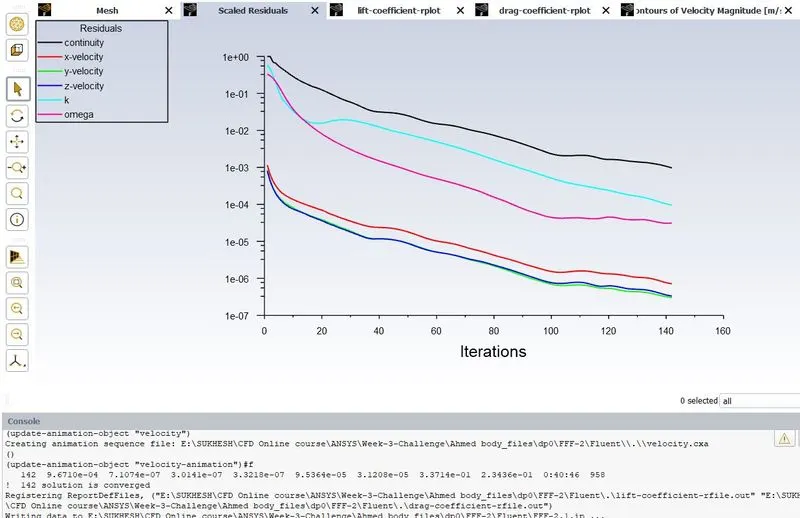
- Residual plot
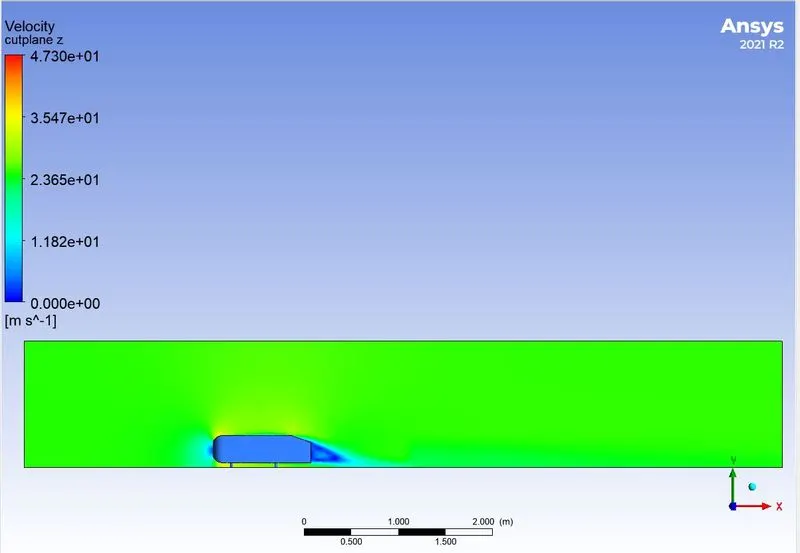
- Velocity and Pressure Contour
- Velocity vector contour
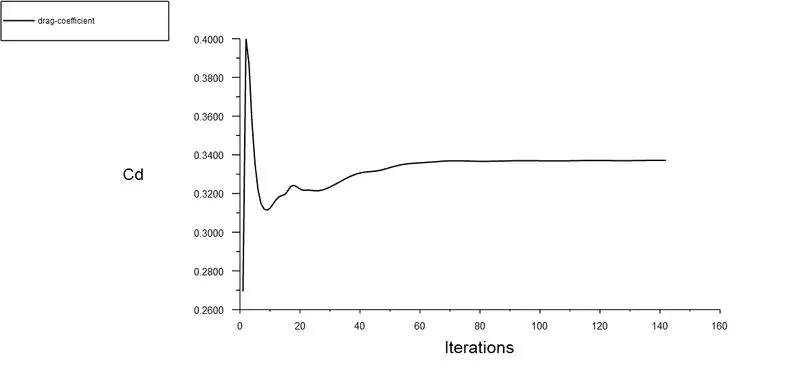
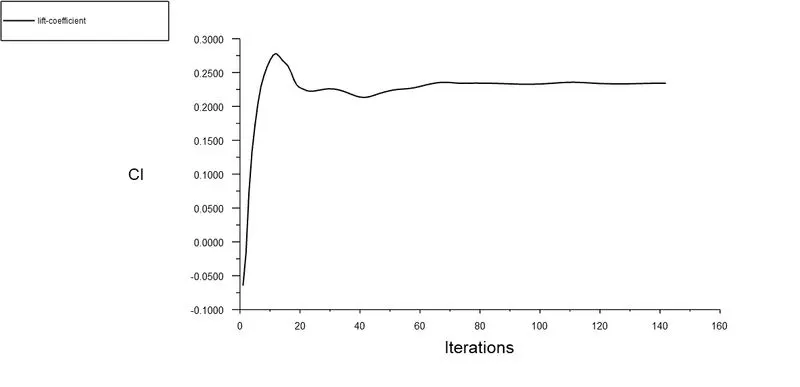
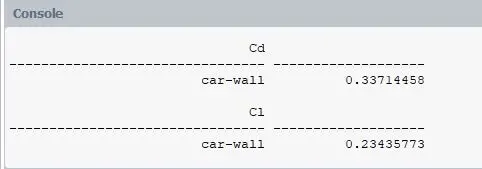
- Cd and Cl plots and computed values
- Velocity variation along Y- direction plot
Grid Independency Test
- Coefficient of Drag obtained for the coarse , medium and fine mesh is compared and tabulated below.
| Mesh Type | Cell Count | Coefficient of Drag obtained |
| Coarse | 82080 | 0.37 |
| Medium | 178893 | 0.35 |
| Fine | 284853 | 0.33 |
CONCLUSIONS
- When the results obtained from the three mesh types are compared, the fine mesh gives the accepted values of Coefficient of Drag i.e., 0.33.
- As in the case of coarse mesh, the velocity contour obtained is not smooth and hence wake region is not properly obtained. This is due to the large sizes of mesh formed around the Ahmed body. This implies that mesh is needed to made even finer to simulate the flow over the Ahmed body.
- Velocity variation along Y- direction is plotted so as to understand the velocity difference created behind the Ahmed body. This velocity variation along Y- direction is observed at three stations i.e., at 1.5 m , 2 m and 3 m behind the Ahmed body.
- Red line indicates 1.5m station and it shows sudden decrease and increase in the velocity. This is due to the air recirculation just behind the Ahmed body. When compared to other stations i.e., at 2m and 3m there is less or no air recirculation as the flow of air far behind the Ahmed body remains almost constant.