Week 3 - External flow simulation over an Ahmed body.
Notice: - After the analysis, the size of the file is more, but in the challenge submission time it is not supported because of its large so I am sharing the google drive link please download from the link.
Link: https://drive.google.com/file/d/1WmxJYii52xiVt5OZKlDnStjcF84Frzt3/view?usp=sharing
Ahmed’s body
Ahmed’s body is represented the aerodynamic properties of the vehicle, its structure is like a vehicle in the rear part which has a slant angle. Fluid flow over a vehicle is taking a reference from Ahmed’s body. This body is like a sample of a car at rest or speed. The analysis of that body is taken as a valid numerical solution for the car. Model body geometries with variable properties, like the slant angle at the rear, are used in model experiments that can provide validation data. One such body is the Ahmed body, a simple-shaped bluff model body with fundamental aerodynamic characteristics of a vehicle, which has been utilised in numerous research studies as a reference. This body is rounded from the front side and the rear side is a very complex 3D model which creates turbulence flow in the rear side of the model, this rear side separates the flow of air over the vehicle which creates a drag force of Ahmed’s body. This drag force creates a wake region which can reduce the efficiency of the vehicle.
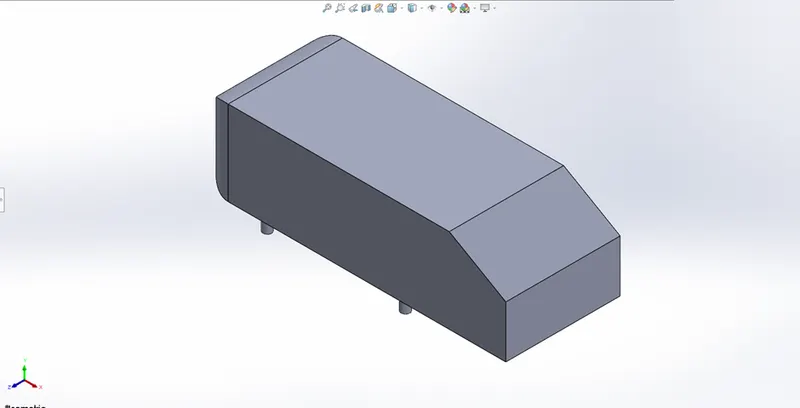
(Ahmed’s body)
This body shape’s length is 1.044m, width is 0.389m and height is 0.288m. it contains 4 cylinders whose diameter is 0.003m, a length is 0.5m, and it contains a slant angle of 30° from the top surface of the body. This body is shown in the above image the solution of the turbulent model depends on the velocity of the fluid and the density of the fluid for a better solution of the analysis is need more mesh elements and a greater number of iterations to conserve the solution.
Importance of the body
In the automobile industries in present-day developing some new technology which will give more efficiency and fuel consumption. For this, Ahmed’s body is developed which will give the 3-dimensional flow around the vehicle to get the performance of the vehicle. In this analysis, we have to minimize the aerodynamic drag force and increase fuel efficiency. In this design of the body, e can create the flow structure of the wind we can find the requirements of solutions. in the analysis, the most important factor is to define the structure of the wind flow and the behaviour of the flow. Where the drag s wake flow bucking the vehicle. The extent of the separation zone and, consequently, the drag force, are determined by the point at which the flow splits. Undoubtedly, a wake flow simulation that is more accurate.
Negative pressure in the wake region
The wake is a sizable low-pressure turbulent zone that is left behind a vehicle when the air travelling over it is split at the back end. This wake helps create pressure drag, which eventually lowers the performance of the vehicle. The area of recirculating flow immediately behind a moving or stationary blunt body, caused by viscosity, which may be accompanied by flow separation and turbulence flow, or the wave pattern on the water surface downstream of an object in a flow, or produced by a moving object, caused by density differences of the fluids above and below the free surface and gravity. In general, it is believed that a vacuum is created in space when air is removed from it. For example, if the vehicle is travelling along the -ve X-axis, then the force in the wake is thought to be acting along the +ve X-axis. However, if the particles in the wake are still striking (colliding) with some momentum on the rear face of the vehicle, they are pushing the vehicle forward. Another significant occurrence also has an impact on the performance and flow of the vehicles. This occurrence is frequently referred to as the vehicle "Waking." The wake is a sizable low-pressure turbulent zone that forms when the air flowing over the vehicle is split at the rear end. This wake helps create pressure drag, which eventually lowers the performance of the vehicle.
Significance of point separation
Pressure builds when flow moves in that direction, slowing down the flow and laying the groundwork for separation to happen. It's crucial to remember that the skin-friction coefficient eventually reaches zero. The separation point is where the wall shear tension disappears. The point of separation is beyond where reverse flow occurs. Reverse flow causes uneven eddies to emerge and wastes a lot of energy. The name of this area is wake. A second drag force is created on the body because the pressure distribution in the wake is very different from that on the remaining border. When the direction of the flow velocity close to the surface is different from the direction of the free stream velocity, which occurs when (du/dy) ≤0, separation of flow is said to have occurred. Whenever there is a negative pressure gradient close to the wall, this circumstance occurs. A subsonic diffuser or the back of the car are two examples.
Some of the energy in the turbulent boundary layer is lost as friction, which slows the airflow velocity and raises pressure. The turbulent mixing process will result in a shift of energy from fast-moving eddies to slower ones in the turbulent boundary layer if the pressure increase is moderate. The process of mixing will be too slow to force the slower air molecules to move if the rate of change in pressure is too high, as might occur in sharp corners. This results in separation because the boundary layer flow no longer follows the surface's contours.
Methods for simulation
In our geometry, we are taking symmetry of the body which is half portion of the body. In our simulation, we are taking 4 cases with different mesh sizes and for different methods of solution. As our boundary condition, we are taking fluid as air and the flow velocity of air is 25 m/s with atmospheric temperature, at the outlet condition is our atmospheric pressure. All the cases are solved, a density-based solver.
Case-1 (coarse mesh with k-epsilon model)
In the first case, we are considering the density-based solver with the k-epsilon standard method which is not accurate but for the coarse mesh condition that will be better. We can see the results below in the images
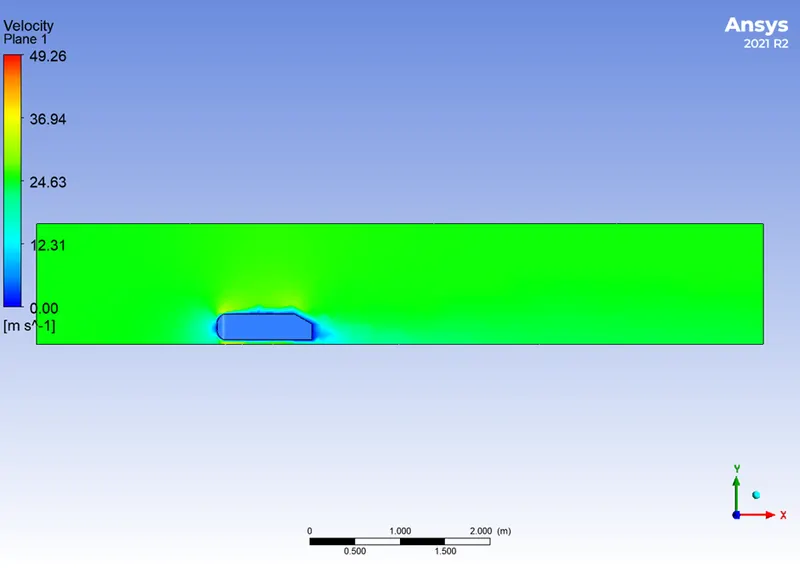
(Velocity contour for case-1)
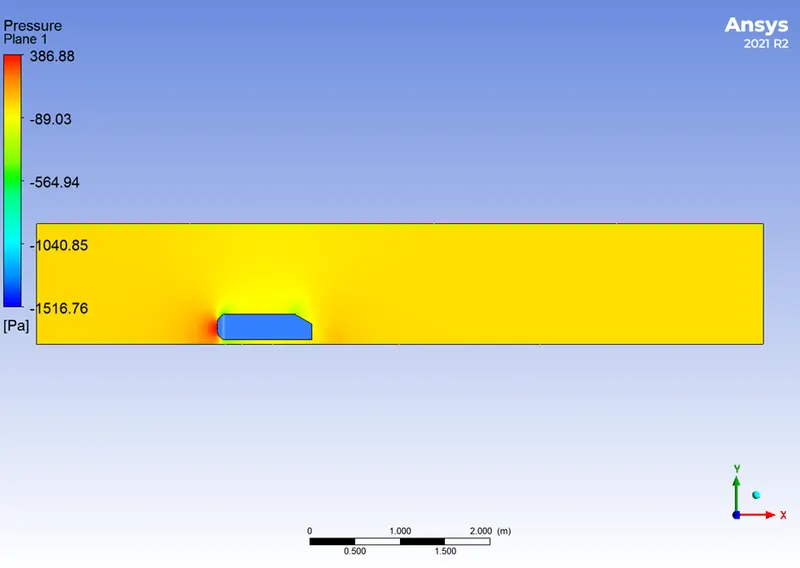
(Pressure contour for case-1)
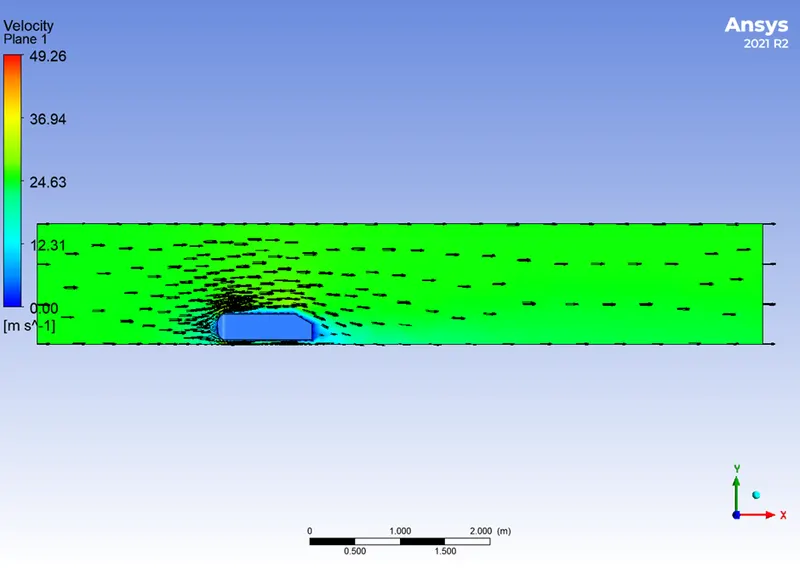
(Vector line representation for case-1)
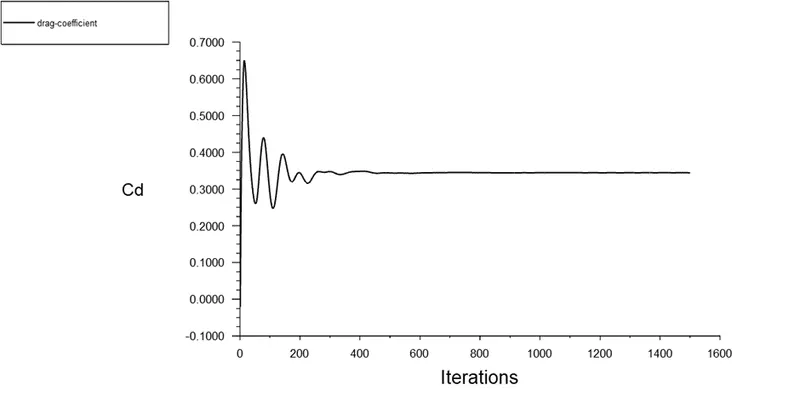
(Drag coefficient for case-1)
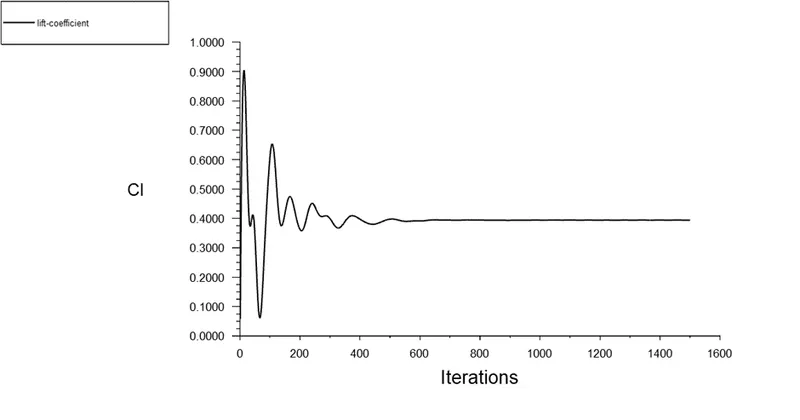
(Lift coefficient for case-1)
In our first condition, we are taking the baseline or coarse mesh and k-epsilon turbulence model, and taking 1500 iterations to get the result. In this case, we can see the velocity and the vector contour plot which shows the wake region is more which will reduce the performance of the vehicle, this is because of the very large mesh elements. In this case, our drag coefficient is 0.35 and the lift coefficient is 0.39, this method is not correct.
Case-2 (medium mesh with the k-epsilon method)
In this case, we are taking some simple steps to refine the mesh slightly and applying the boundary conditions and taking 1500 iterations to conserve the solution.
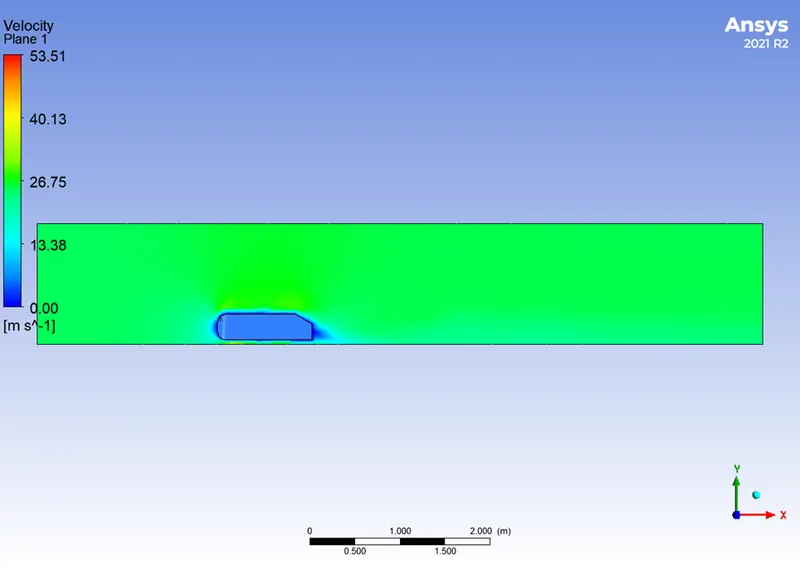
(Velocity contour for case-2)
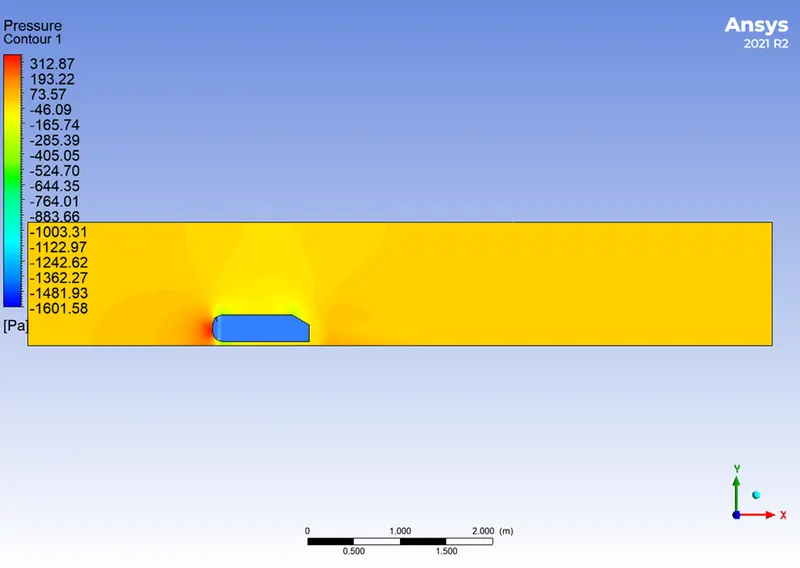
(Pressure contour for case-2)
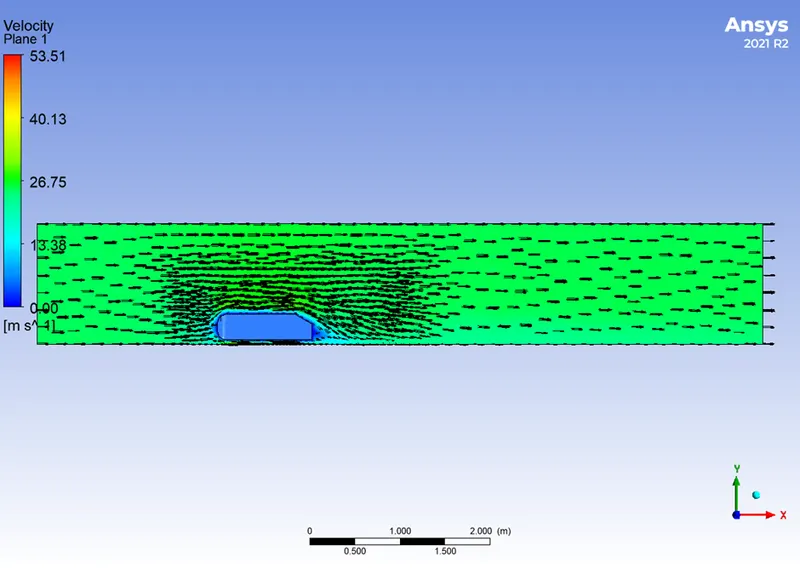
(Vector line representation for case-2)
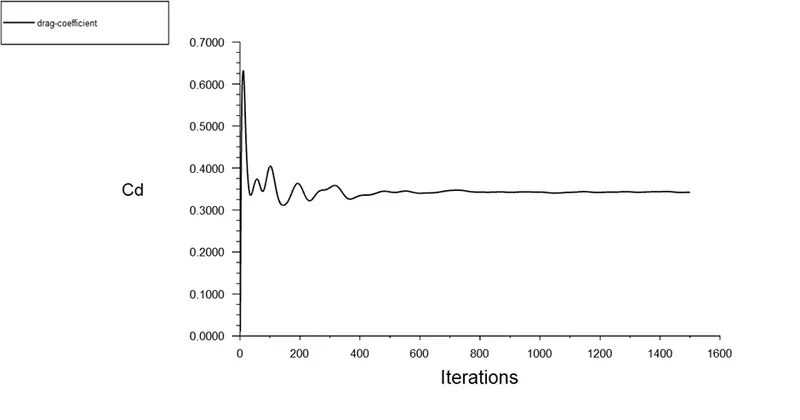
(Drag coefficient for case-2)
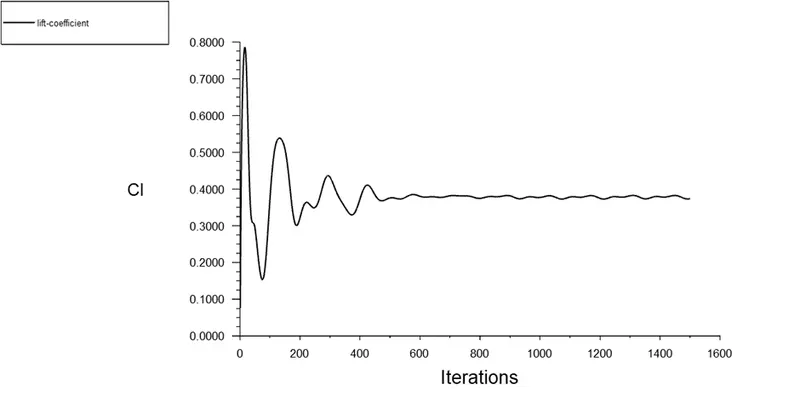
(Lift coefficient for case-2)
In this case, we can see the at-rear wake region slightly increases in quality which is represented by the vector plot, which represents when the mesh size is better in quality velocity and the pressure plot is given near to the result but it is also not the perfect result. In this case, our drag ad lift coefficient are slight decreases, where the drag coefficient is 0.342 and the lift coefficient is 0.37.
Case-3(medium mesh with k-omega mode)
In this case, we are using the same medium-quality mesh used in the k-omega SST model by this model we can expect the more accurate result. Here the boundary conditions are the same as previous. We are taking 1500 iterations for this calculation.
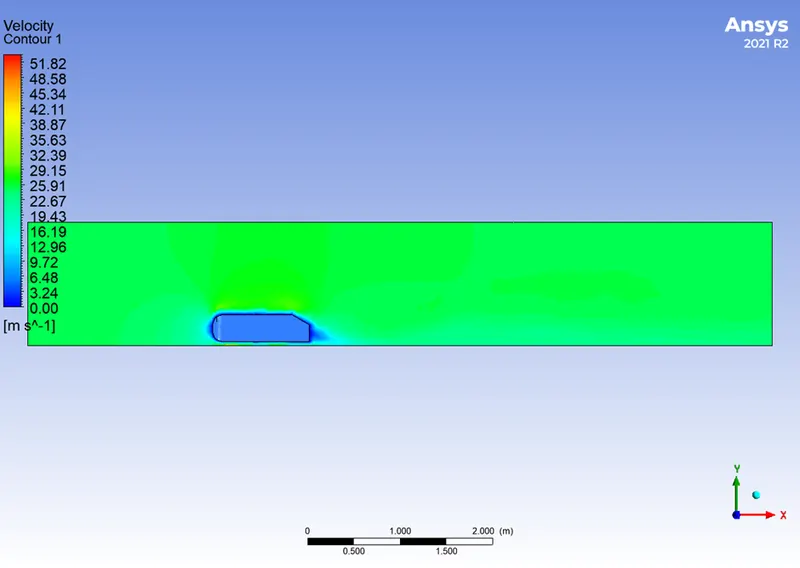
(Velocity contour for case-3)
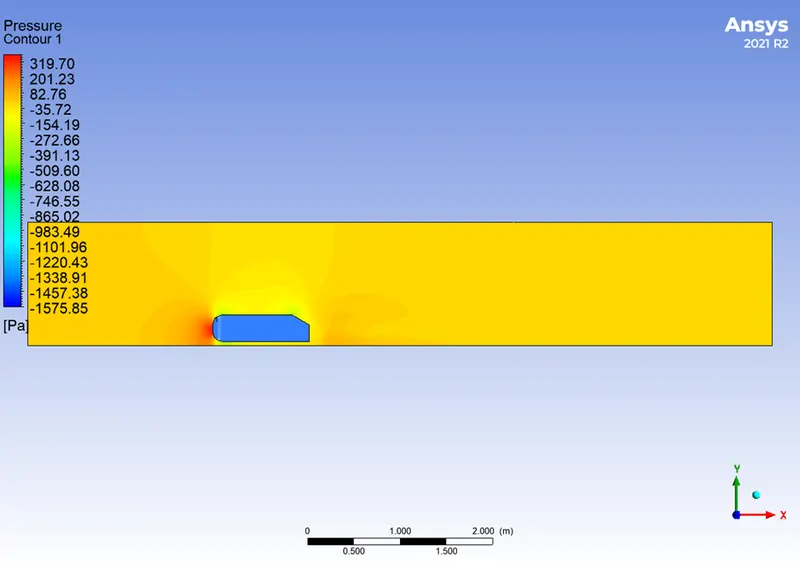
(Pressure contour for case-3)
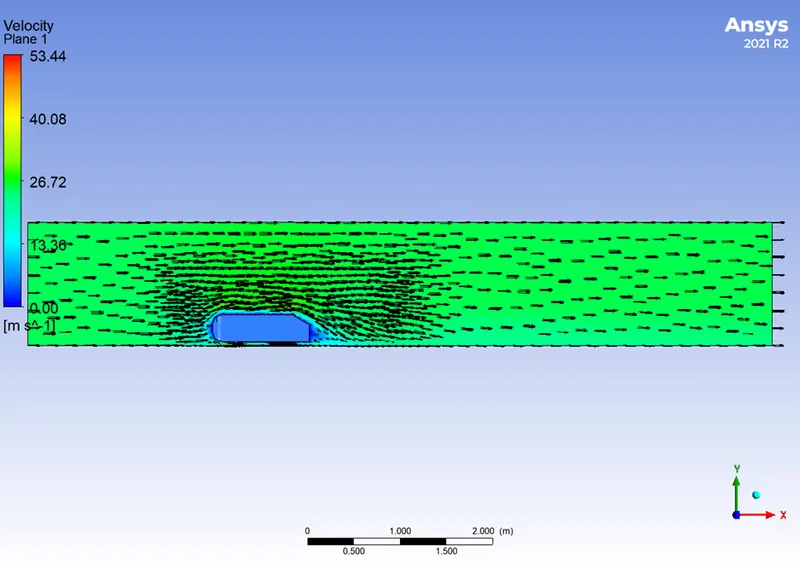
(Vector line representation for case-3)
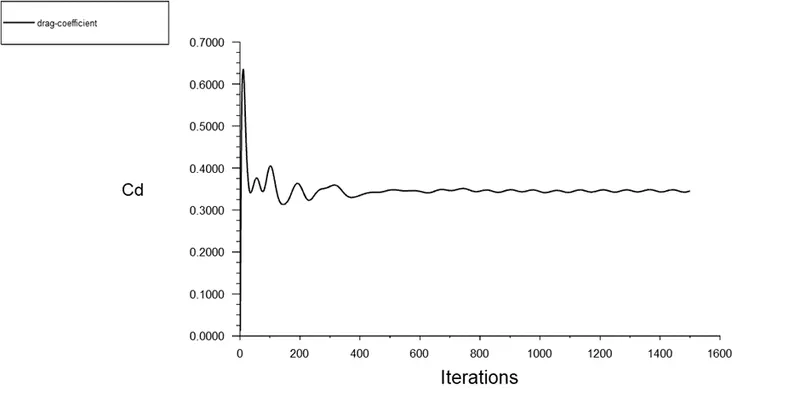
(Drag coefficient for case-3)
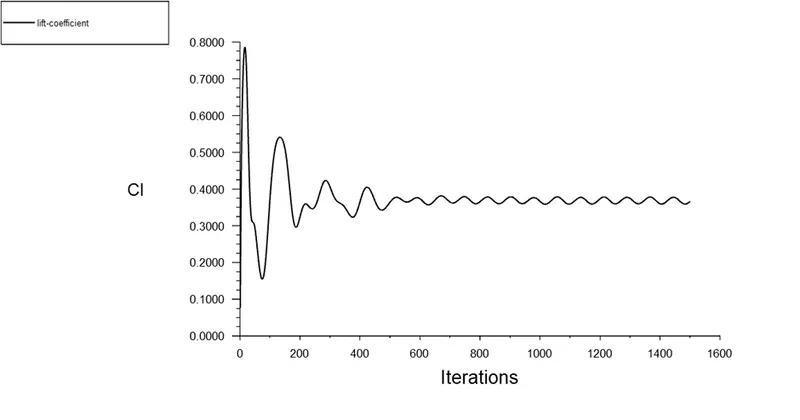
(Lift coefficient for case-3)
In this case, we are getting the same like result as the k-epsilon model, in this method, the vector contour plot is showing some results where the wake region is also high which will create more drag force, in this case, the drag coefficient is 0.345 and lifts coefficient is 0.36.
Case-4(fine mesh with k-omega model)
In this case, we are going to use the fine mesh which increases the number of elements when decrease in mesh length. For the meshing of the model, we are using many algorithms to get a fine mesh structure, using the same boundary condition and taking 2250 iterations we are getting below results.
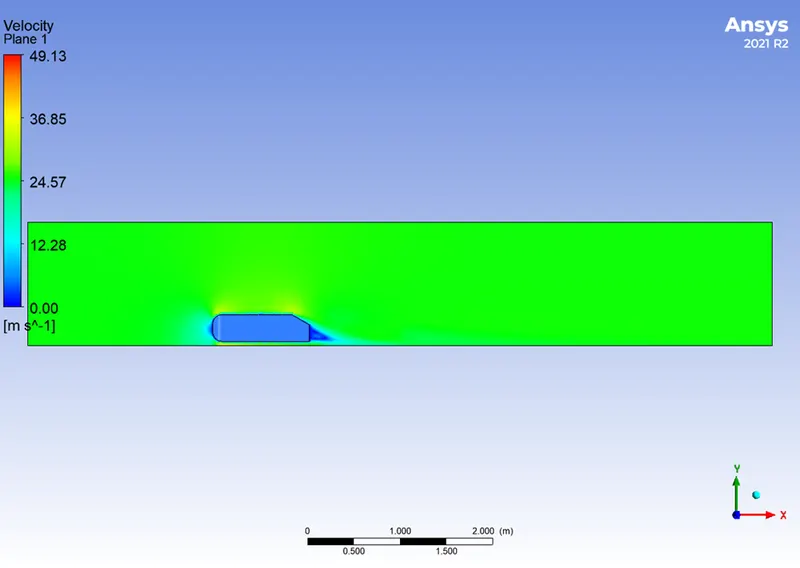
(Velocity contour for case-4)
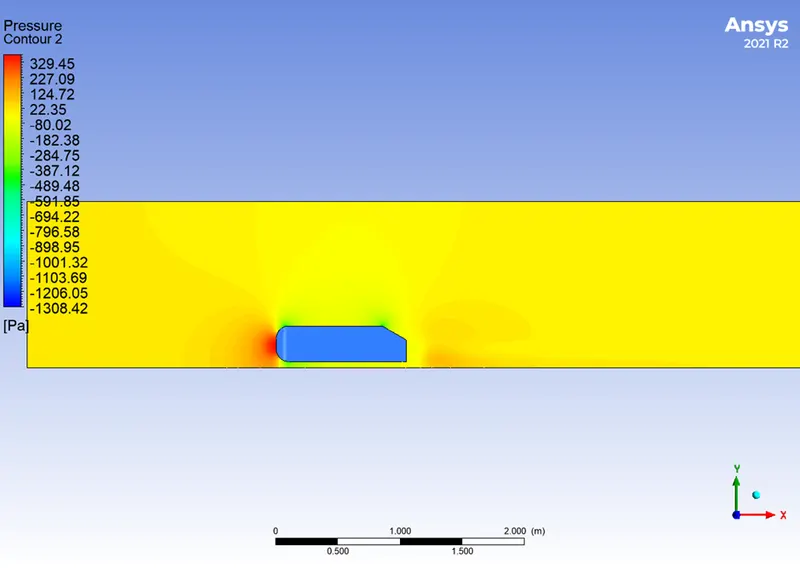
(Pressure contour for case-4)
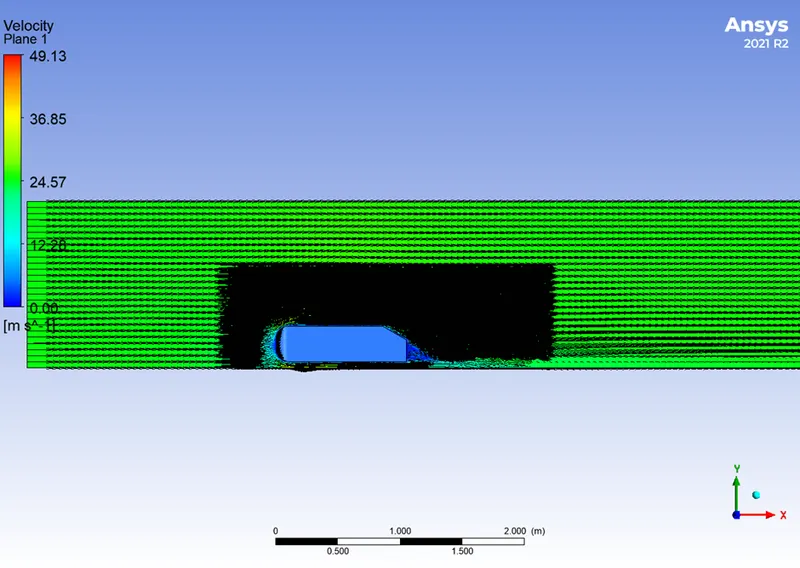
(Vector line representation for case-3)
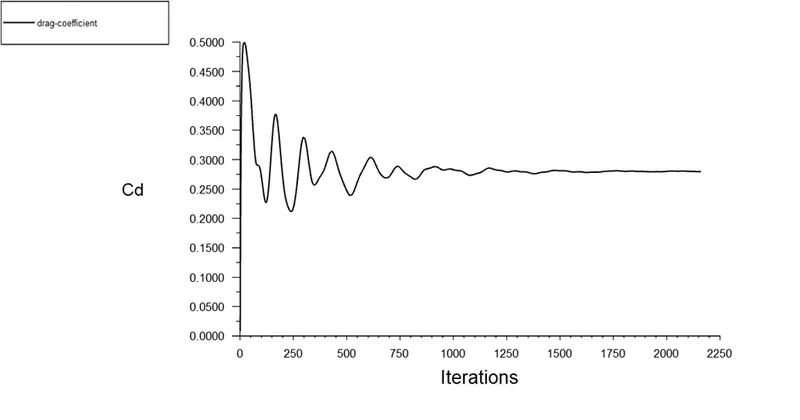
(Drag coefficient for case-4)
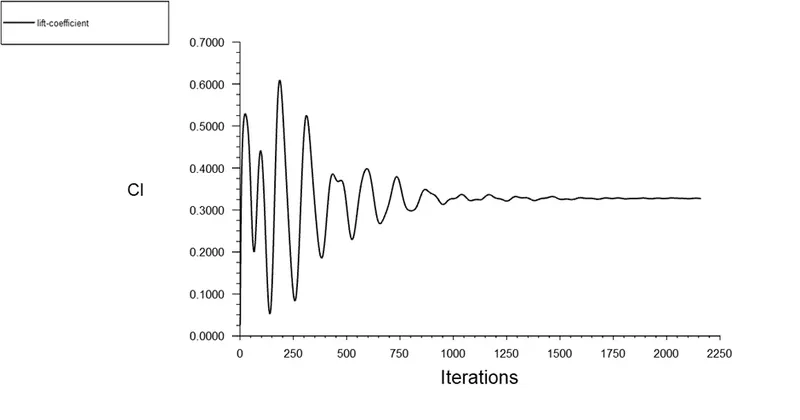
(Lift coefficient for case-4)
In the fine mesh condition, the result comes more accurate, in the vector profile we can see the wake region. In the fine mesh, the drag force is less as compared to the coarse mesh and medium mesh. In this case, the drag coefficient is 0.27 and the lift coefficient is 0.32 so the drag force will be low. In that condition, the performance of the vehicle will be high.
Conclusion
In this analysis we know about the wake region which is grid dependency, its character depends on the grid size of the mesh. Here we can see the different results from the k-epsilon and k-omega methods. As the refine mesh setup reduces the drag coefficient and decreases the lift coefficient. By the boundary layer separation, the vacuum layer is generated that’s why the pressure is negative.
In the direction of flow, the pressure is increased which causes a decrease in velocity and due to that, the floe separation happens. The skin coefficient reaches to zero at this point the wall stress is negligible is called the separation point