Week 3 - External flow simulation over an Ahmed body.
AIM:- Perform the External flow simulation over an Ahmed body.
OBJECYIVE:-
- Run the simulation for the velocity of 25 m/sec with the default air properties in fluent.
-
Describe Ahmed's body and its importance.
-
Explain the reason for the negative pressure in the wake region.
-
Explain the significance of the point of separation.
- Expected Results:
-
Velocity and pressure contours.
-
The drag coefficient plot for a refined case. ( For velocity of 25m/sec, the drag coefficient should be around 0.33).
-
The vector plot clearly showing the wake region.
-
Perform the grid independency test and provide the values of drag and lift with each case.
THEORY:-
Ahmed body:-
Turbulence is one of the phenomenon which need to be studied for development of car body. To study of The wake region behind the vehicle are very important because determine the slope behind the car is advantage in study the behavior of air on body. To study Full car body in Wind tunnel is very complex so Ahmed body is introduced. Ahmed body is a structure is mostly used to study the turbulence created by flowing air. Varying the slope of Ahmed body is used the study the vortices created behind the body (Wake region).
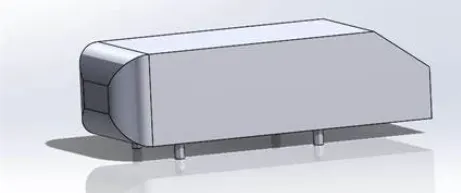
Fig 1. Ahmed Body
- Importance of Ahmed body:-
The Drag Force and Lift forces are very important in while studying in External Car Aerodynamics. when External Drag force increased Fule consumption of the car increasing. also car body affected by Flow Separation also. To study all these parameter to study Ahmed body is very important. so main objective of the study Ahmed body is control on Drag and increase the fuel economy and other parameters of car Body like noise and improve the performance.
- Reason for the negative pressure in the wake region:-
The flow behind an object separates from the surface and creates a highly turbulent region behind the object, called the wake. The pressure inside the wake region remains low as the flow separates and a net pressure force (pressure drag) is produced. In other words, due to the production of pressure drag being produced from flow separation, the pressure in the wake region is low. This is what is causing the vacuum. When the fluid reaches the rear end of the vehicle it get detached from the surface of the body causing the negative pressure in the wake region.
- Significance of the point of separation:-
Flow separation or boundary layer separation is the detachment of a boundary layer from a surface into a wake. A boundary layer exists whenever there is relative movement between a fluid and a solid surface with viscous forces present in the layer of fluid close to the surface. due to slant geometry the vortices are generated at wake region because pressure difference.
In study below parameters also important.
- Reynolds Number:- The Reynolds number is the ratio of inertial forces to viscous forces. The Reynolds number is a dimensionless number used to categorize the fluids systems in which the effect of viscosity is important in controlling the velocities or the flow pattern of a fluid.
`Re=(rho*V*D)/mu`
Where, `rho=`Density of the fluid in`(kg)/m^3`
V= Velocity of the fluid in `m/sec`
D= Diameter of Pipe in m
`mu=` dynamic viscocity of fluid `(N*S)/m^2`
- Coefficient of Drag ( Cd ):- The coefficient of drag is a dimensionless quantity that is used to determine the drag or resistance of an object in a fluid environment such as air or water.
Cd= `(2*F_d)/(rho*AV^2`
Where, Cd= Drag Coeificcient
`F_d=`Drag force
`rho=`Density of the fluid in`(kg)/m^3`
A= Reference Area
V= Velocity of the flow.
- Coefficient of lift (Cl):- The coefficient of Lift is a dimensionless quantity that is used to determine the Lift of an object in a fluid environment.
``Cl= `(2*F_l)/(rho*AV^2)`
Where, Cl= Lift Coeificcient
`F_l=`Lift force
`rho=`Density of the fluid in`(kg)/m^3`
A= Reference Area
V= Velocity of the flow.
The desired first layer thickness of Y plus value is determine by calculating skin friction coefficient which is given as:
`Cf=0.026/(Re^(1/7)`
After that wall shear stress can be calculated which is given as:
`τwall=(Cf⋅ρ⋅U^2)/(2)`
From calculation of shear stress near wall we can find frictional velocity which is given as:
`UFric=√(τwall)/(ρ)`
To calculate the first layer thickness it is important to decide the desired Y+ value for the calculation, depending upon the turbulence layer theory or wall treatment method the requirement of Y+ value is varied accordingly. The first layer thickness is given as:
`ΔS=(Y+⋅μ)/(UFric⋅ρ)`
PROCEDURE:-
CASE -1 :-
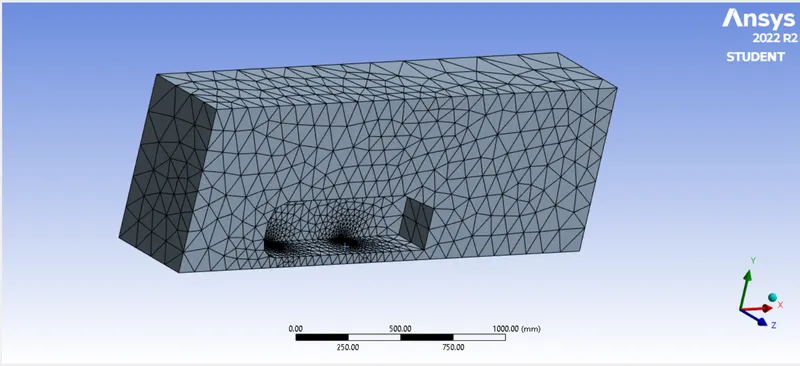
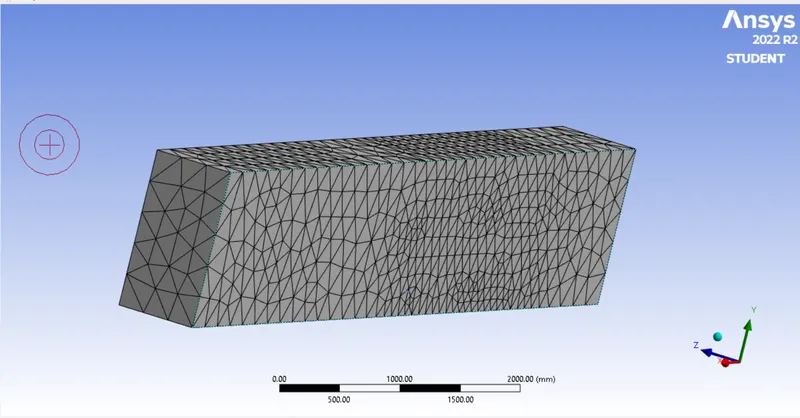
Mesh For Outer Enclosere is 250 mm, Inner Enclosere is 100 mm and For legs 5 mm.
- IMPORT GEOMETRY:-
First of all Import Geometry in Spaceclaim.
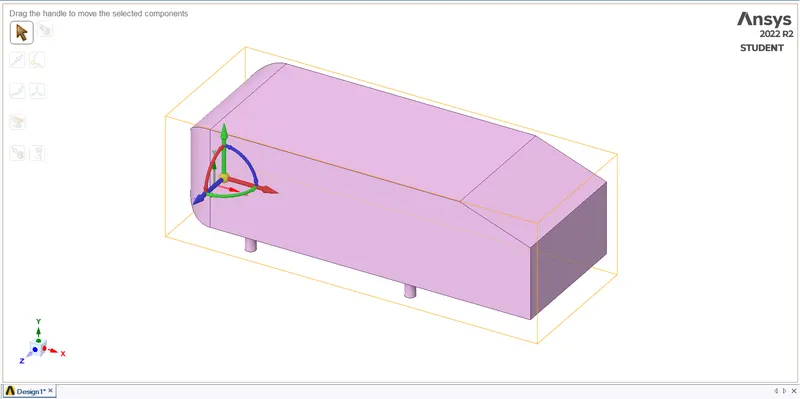
Fig.2 Imported Geometry
- Create The Enclosere to body :-
We have to create the enclosere to body because we have to do External Simulation.
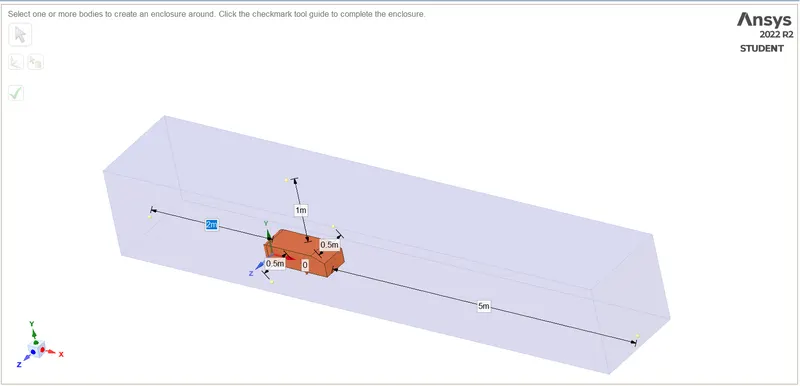
Outer Enclosere:-
then we have to create Outer Enclosere.
Dimensions for the Outer enclosere is
(1) From Left side Along X-axis 2 m
(2) From Right side Along X-axis 5 m
(3) From Top Side side Along Y-axis 1 m
(4) From and back side Along Z-axis 0.5 m Each.
(5) From Bottom side Along Y-axis 0 m.
Inner Enclosere:-
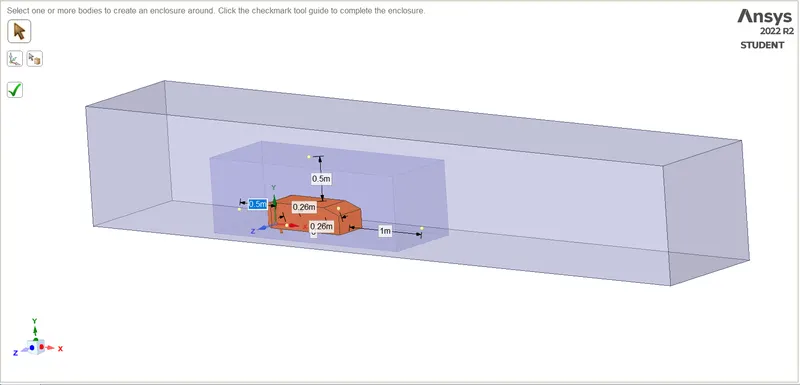
First we have to create Inner Enclosere.
Dimensions for the inner enclosere is
(1) From Left side Along X-axis 0.5 m
(2) From Right side Along X-axis 1 m
(3) From Top Side side Along Y-axis 0.5 m
(4) From and back side Along Z-axis 0.26 m Each.
(5) From Bottom side Along Y-axis 0 m.
Final Encloseres:-
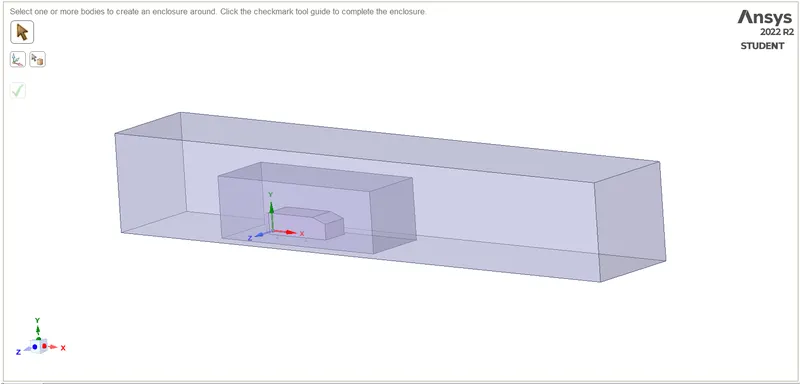
Fig.3 Creating Enclosere
There is a interference due to both the enclosure due to that the Section is get overlapped in order to avoid that we use interference command and remove this interference.
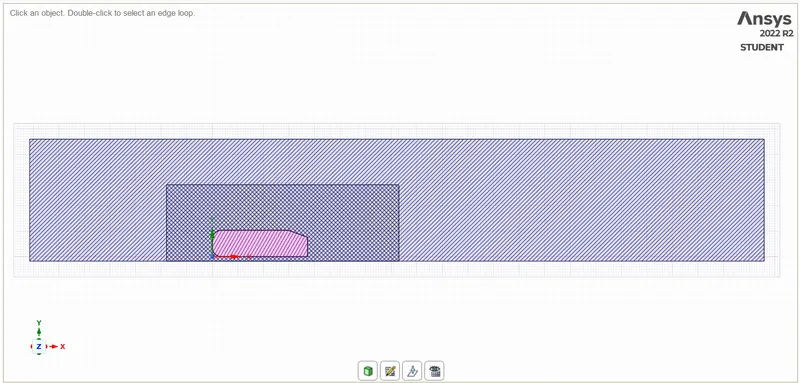
Fig.4 interference
Share topology:-
After that we have to use Share topology for share the Nodes to each other.
Spaceclaim > Workbench > Share
The Ahmad body geometry is symmetric along x axis so we use split body command and split the body along X axis( create Plane to Along X axis and Split Body Along X-axis).
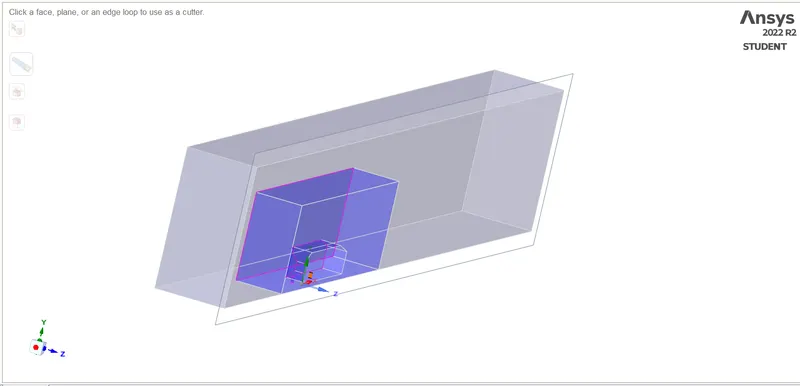
Fig.5 body Splitting
- MESHING:-
Open Geometry in Meshing interface.
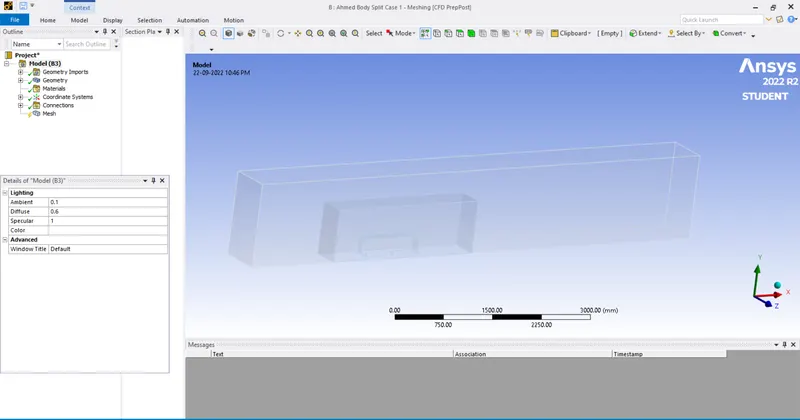
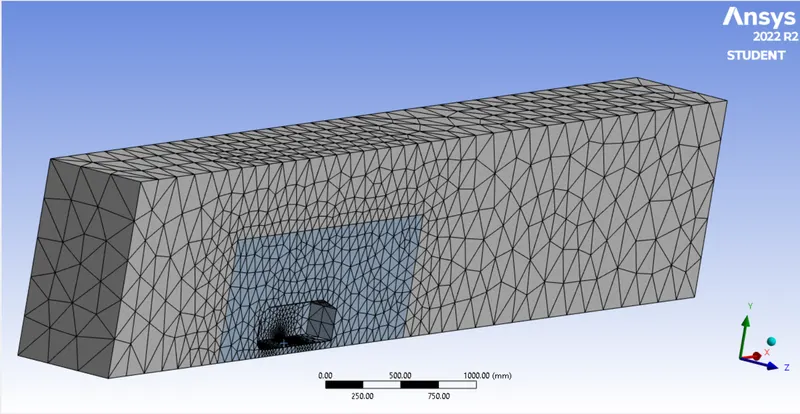
Inner enclosere Mesh by using Body sizing size 100 mm and Legs Face sizing 5 mm Mesh
Outer enclosere Mesh by using Body sizing size 250 mm
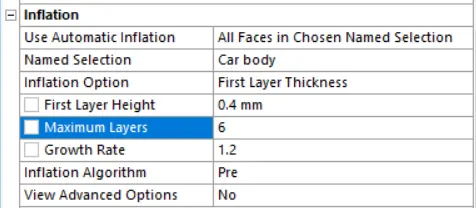
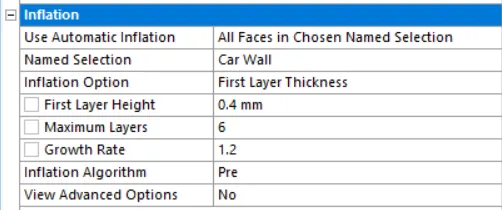
Then We used Inflation Layer ( No. of layers 6 and First layer Thickness 0.4) to the Car Body. First layer thickness is calculated from Y plus as 30.
Final Generated Mesh for case 1:-
Element Mesh Metric:-
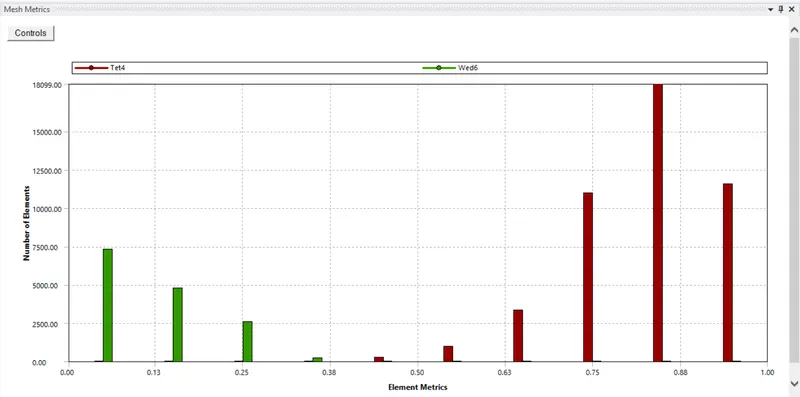
Total Number of Elements for Case 1 is 60070.
SET-UP:-
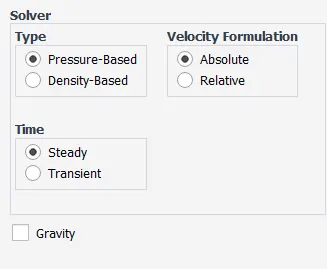
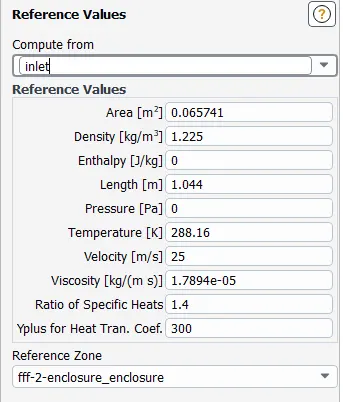
Reference Values:-
Viscous Model:-
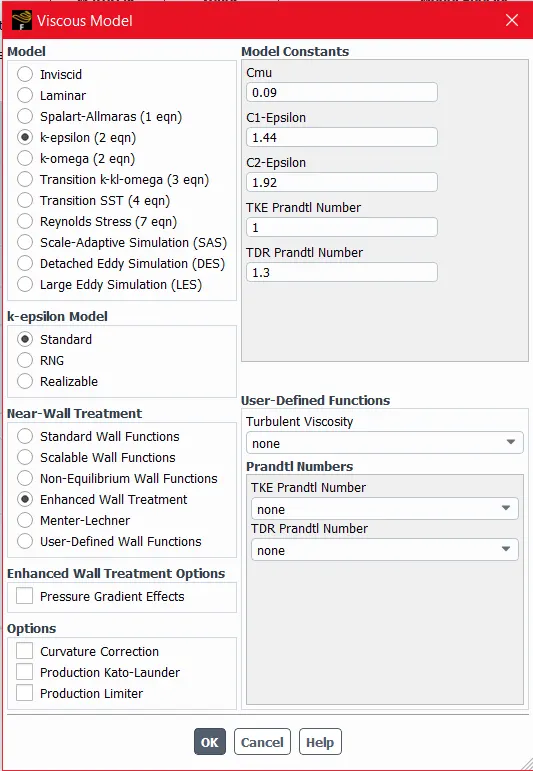
Here we are using The K-epsilon Enhanced wall Tratment model because of we are considering the Y plus as 30.
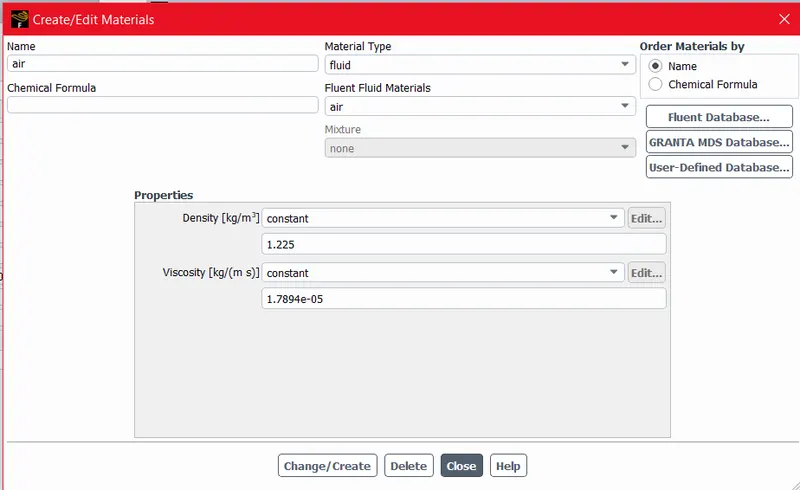
Material Used :-
Boundary Conditions:-
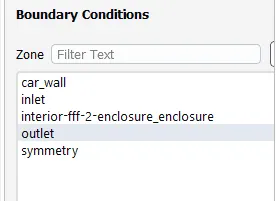
Boundary conditions are set as below,
- Inlet:- Velocity Inlet
- Symmetry:- Symmetry
- Car_wall:- Wall
- Outlet :- Pressure Outlet
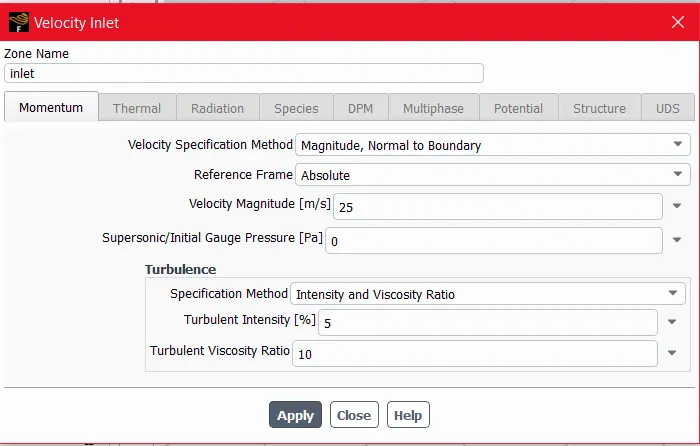
Velocity Inlet :-
here we are considering a Velocity of Air flow as 25 m/s.
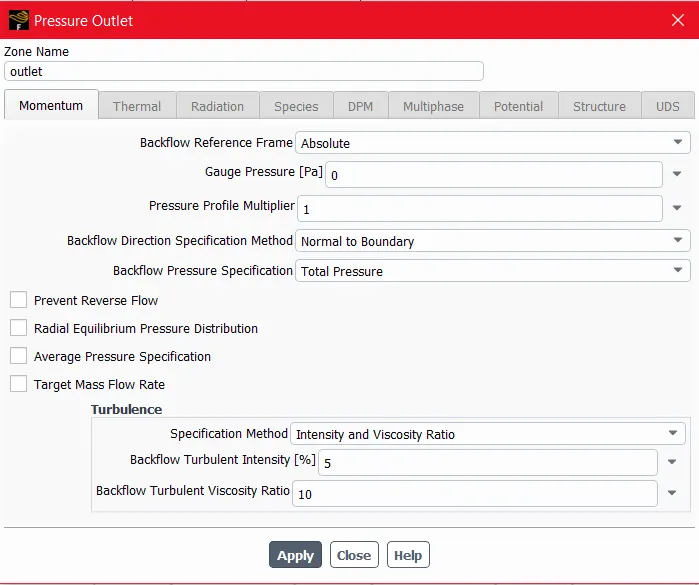
Pressure Outlet:-
We are considering the Air Pressure as Standard Gauge Pressure means 0.
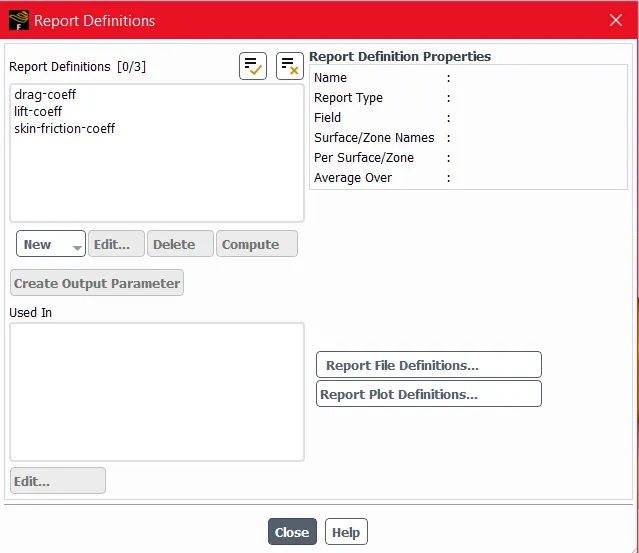
Report Definitions:-
Report Definitions Are set for Drag Coefficient, Lift Coefficient and Skin Friction Coefficient as below
Then Initialize the Set-up by using the Standard Initialization.
Then we have to plot Velocity Contour and Pressure contour as below,
Velocity Contour Setting:-
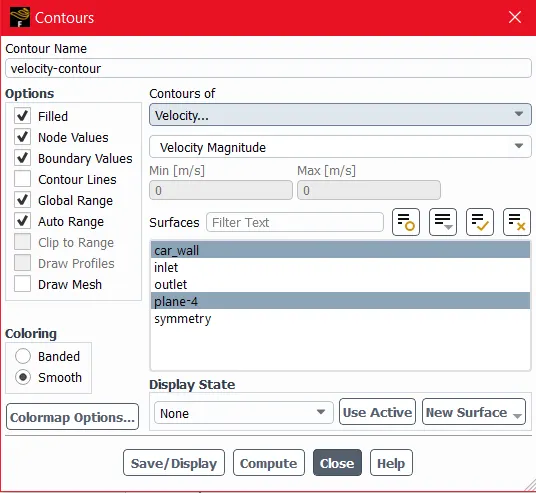
Velocity Contour Setting:-
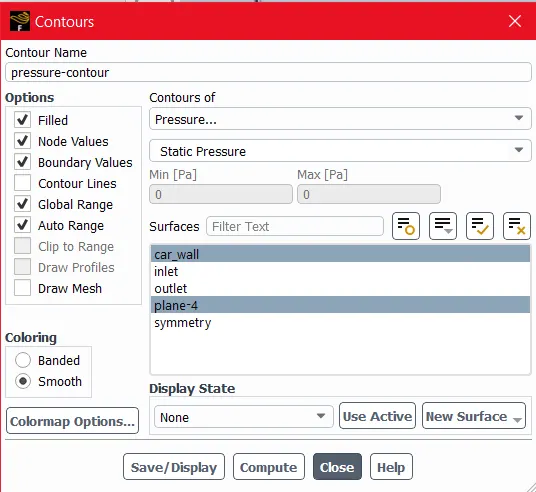
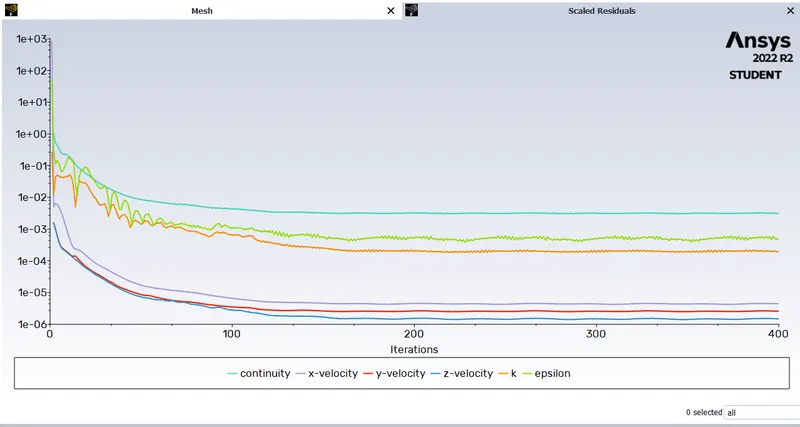
Then we have to Run the Simulation for 400 Iteration After that we can get the results as below
RESULTS:-
- Residuals Plot:-
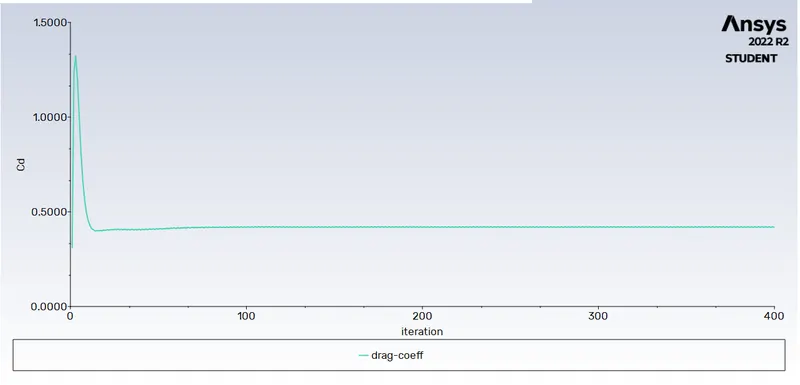
- Drag Coefficient Plot:-
Here we are getting the value of Drag Coefficient as 0.4183695
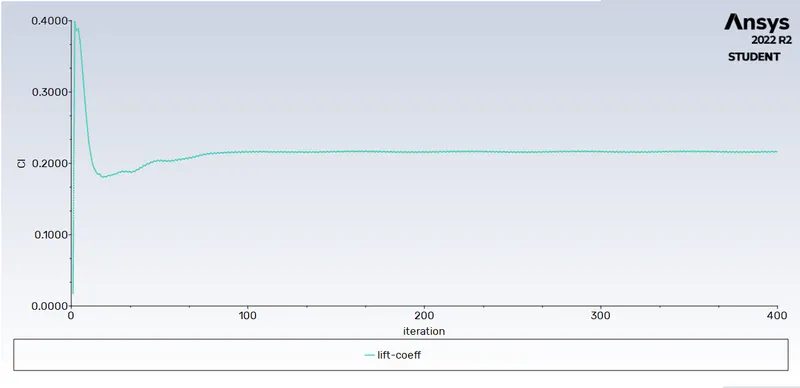
- Lift Coefficient Plot:-
Here we are getting the value of Lift Coefficient as 0.21589992
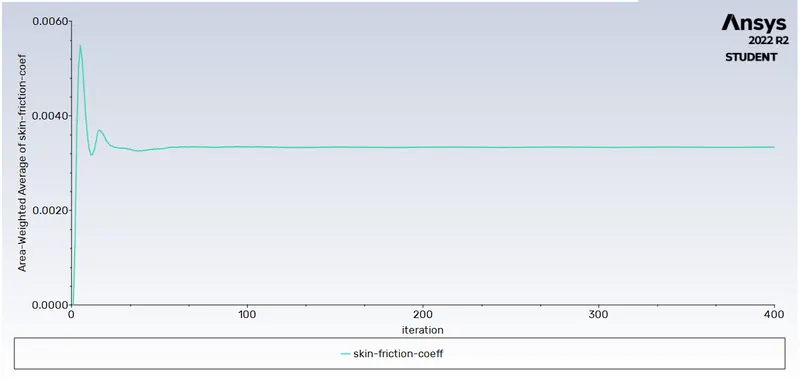
- Skin Friction Coefficient Plot:-
Here we are getting the value of Skin Friction Coefficient as 0.0033345522
CFD POST:-
Then We are Transform the Half Splitted Geometry in to Full Geometry ( Symmetry )
Default Transform >> Untick instancing info from Domain >> Tick on Apply Reflection >> Select XY plane >> Apply.
After that we have to create XY Plane for Velocity and Pressure Contour, then we have to Create line for plotting the Graph. the Contours and Graphs Created as Below.
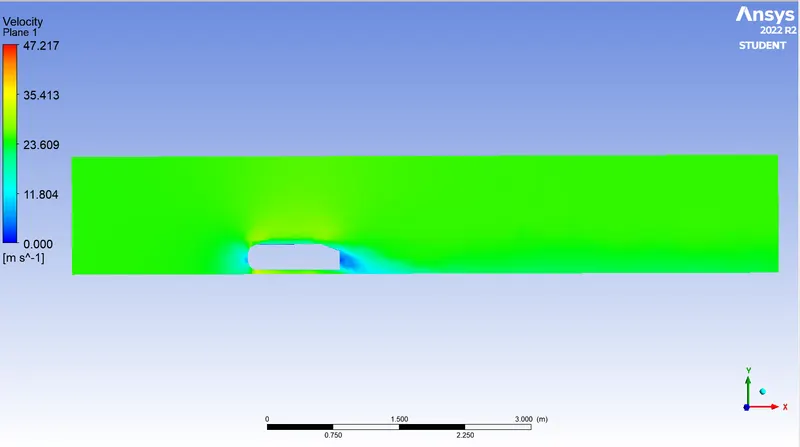
- Velocity Contour:-
In Below Velocity Contour We are clear about the Wake Region is Developed at the Exact Rear Portion Of the Car
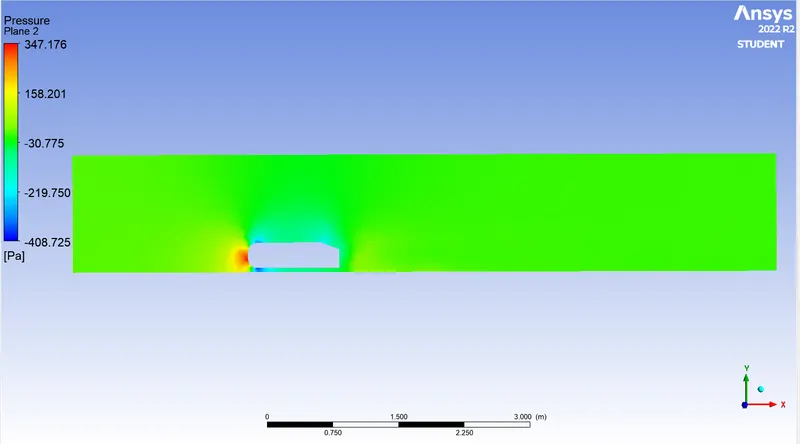
- Pressure Contour:-
In Below Pressure Contour We are clear about the Pressure is more at Frontal Portion of the Car.
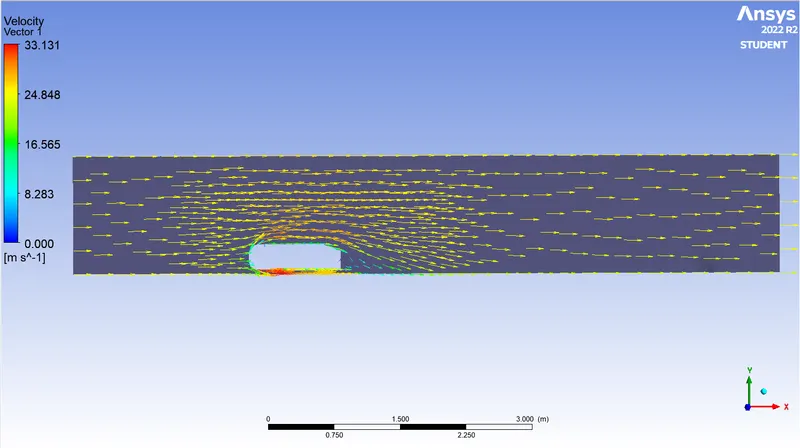
- Velocity Vector Plot:-
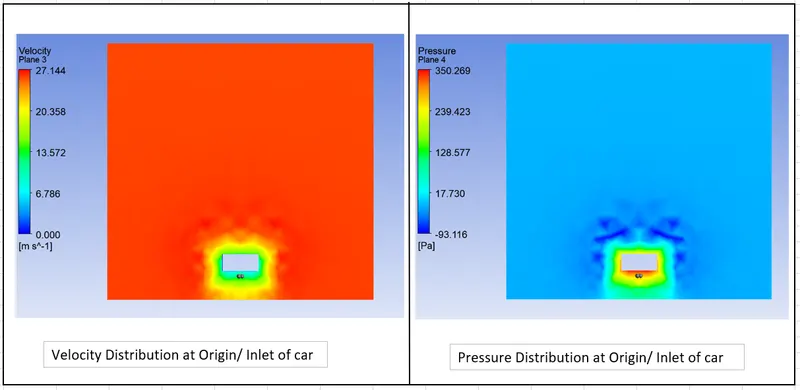
- Velocity and Pressure Distribution At Frontal Portion of Car:-
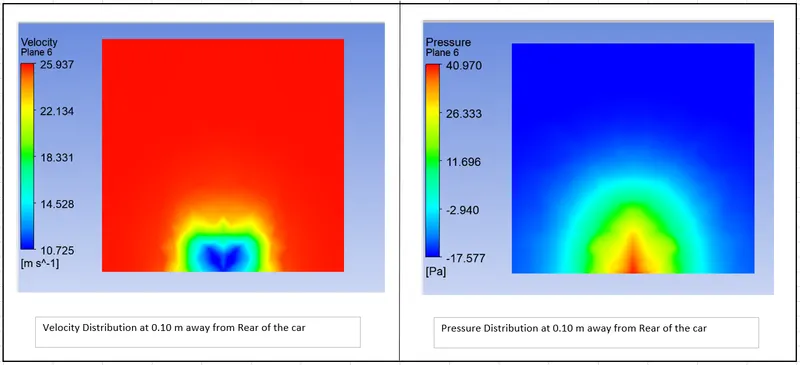
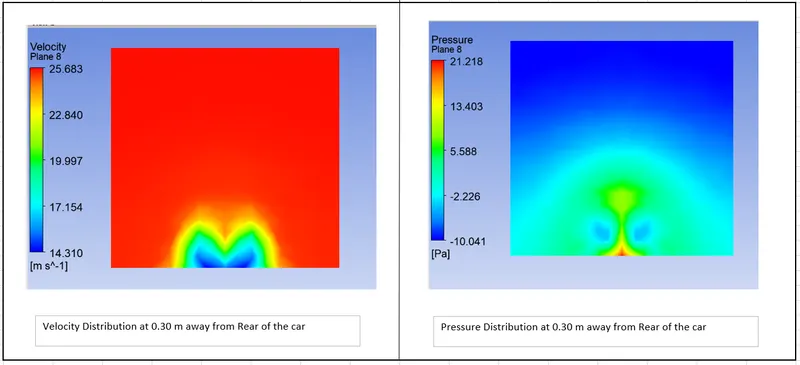
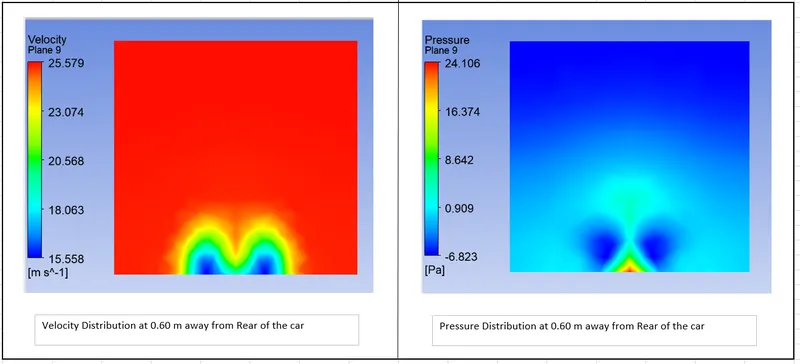
- Velocity and Pressure Distribution At Rear Portion of Car:-
1. At 0.10 m away from Rear Portion of the car along X axis.
2. At 0.30 m away from Rear Portion of the car along X axis.
3. At 0.60 m away from Rear Portion of the car along X axis.
- Comparison Velocity Distribution At various Location Over Domain:-
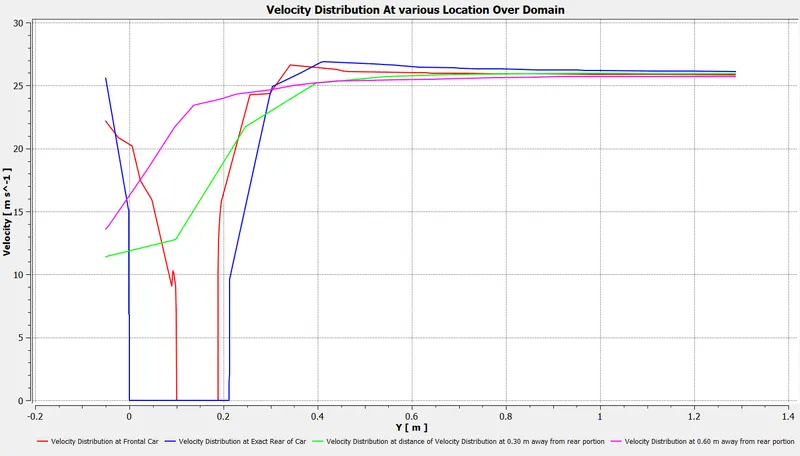
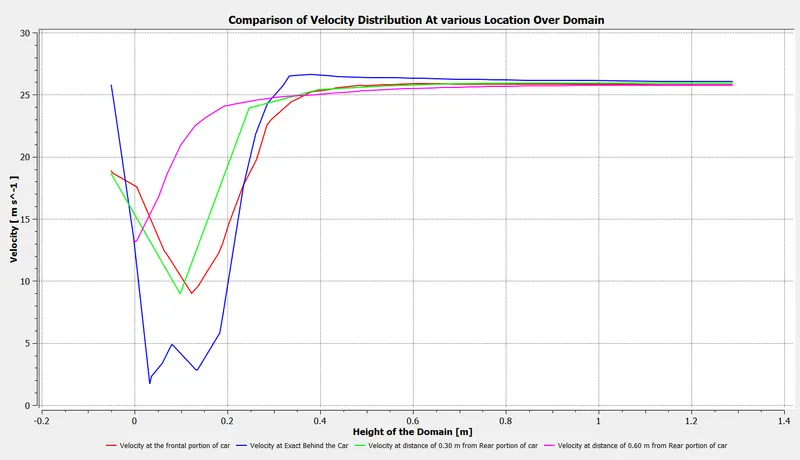
In Above plot Clear about Velocity at Frontal portion and Exact Rear portion is Nearly zero at perticular Height 0 to 0.2 m.
- Comparison Pressure Distribution At various Location Over Domain:-
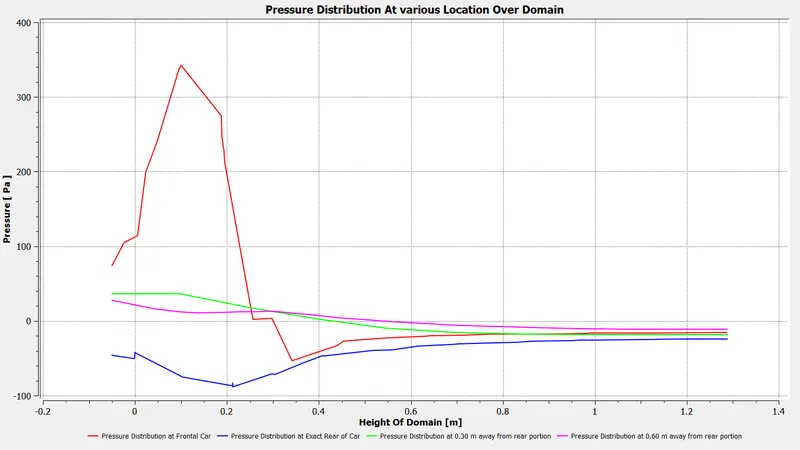
In Above plot Clear about Prssure at Frontal portion is Negative 0.25m to Height up to Top and for Exact Rear portion is Negative at full Height.
CASE -2 :-
GEOMETRY :-
Geometry Is Same for the All three cases.
Mesh For Outer Enclosere is 150 mm, Inner Enclosere is 50 mm and For legs 3 mm. 6 Layer and 0.4 Firstlayer thickness used for Inflation layer for car body.
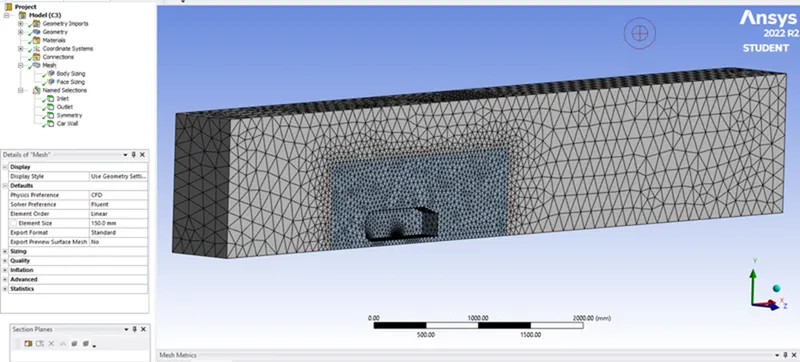
187641 Total No of elements used for meshing.
Element Quality:-
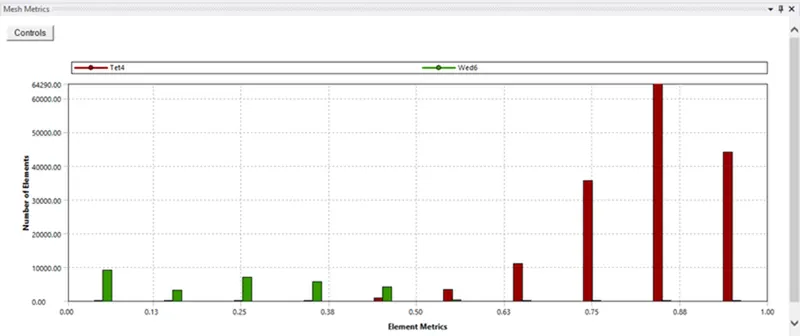
SET-UP:-
Set-up is Same for this case as Case 1, Only mesh has been changed.
RESULTS:-
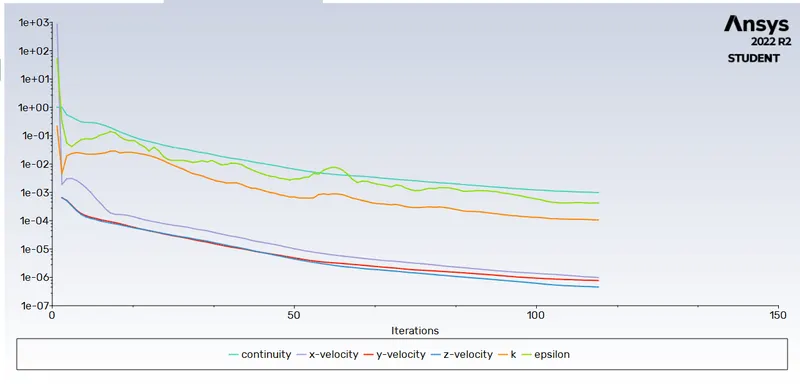
- Residuals Plot:-
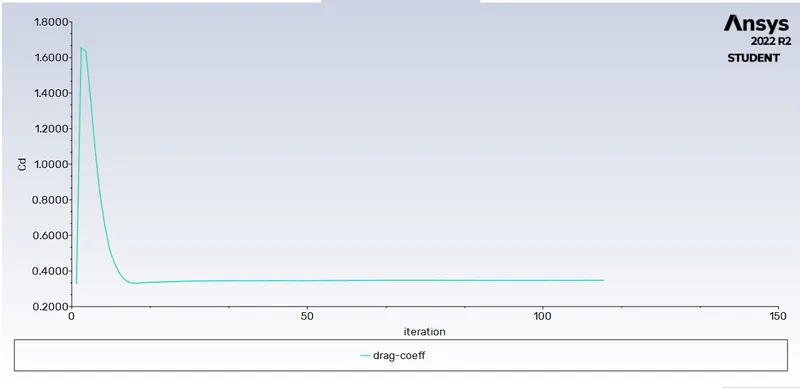
Drag Coefficient Plot:-
Here we are getting the value of Drag Coefficient as 0.34743354.
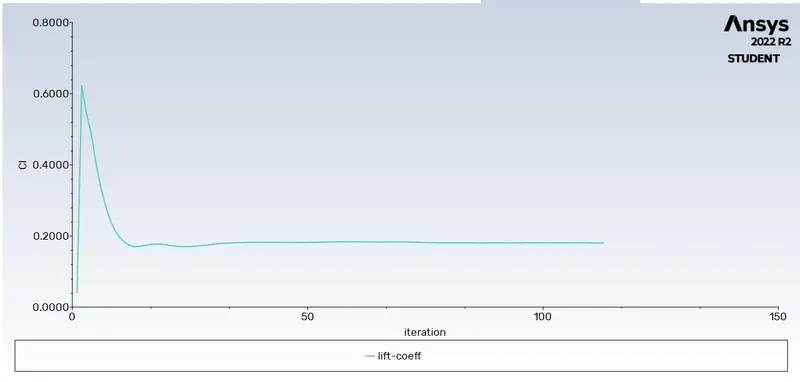
Lift Coefficient Plot:-
Here we are getting the value of Lift Coefficient as 0.18009979.
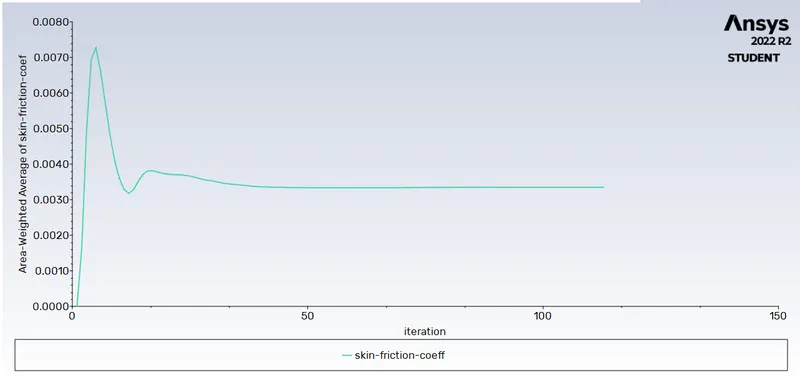
Skin Friction Coefficient Plot:-
Here we are getting the value of Skin Friction Coefficient as 0.00034582
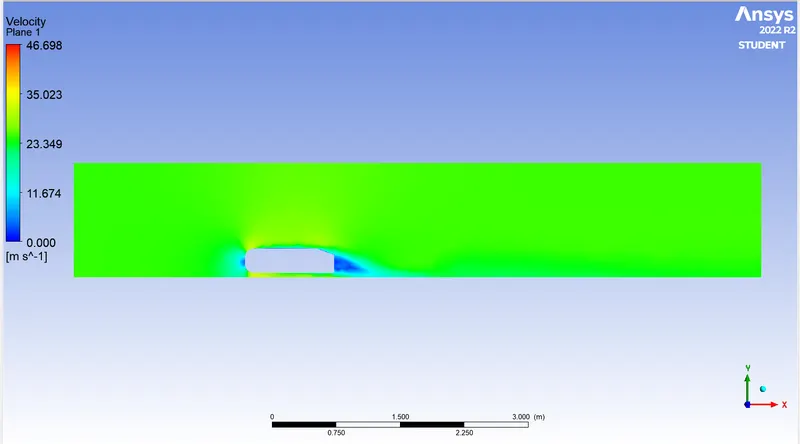
- Velocity Contour:-
In Below Velocity Contour We are clear about the Wake Region is Developed at the Exact Rear Portion Of the Car
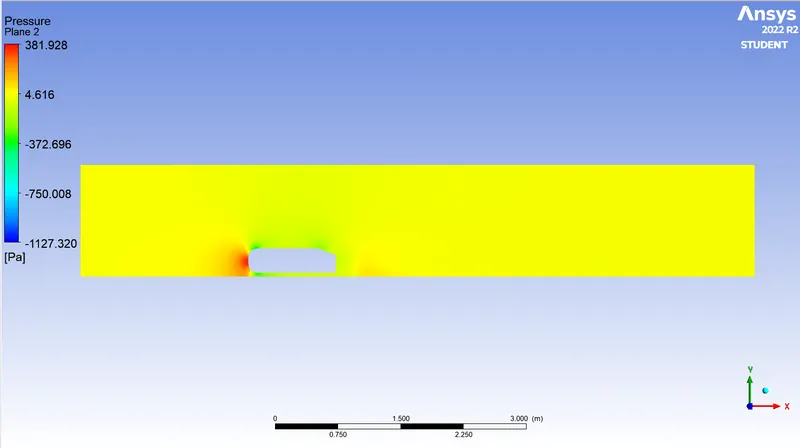
- Pressure Contour:-
In Below Pressure Contour We are clear about the Pressure is more at Frontal Portion of the Car, that pressure is called as stagnation Pressure.
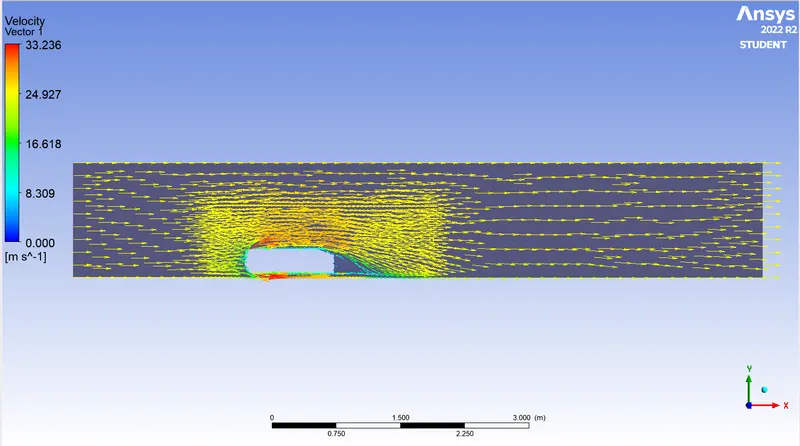
- Velocity Vector Plot:-
In below Velocity vector plot Wake rigion is clearly observed behind the car.
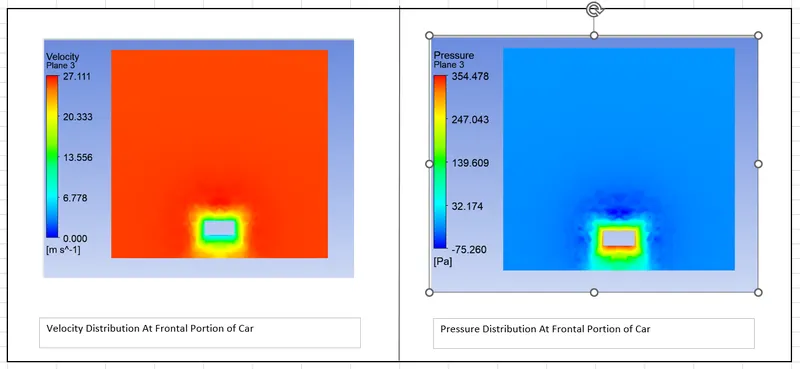
- Velocity and Pressure Distribution At Frontal Portion of Car:-
- Velocity and Pressure Distribution At Rear Portion of Car:-
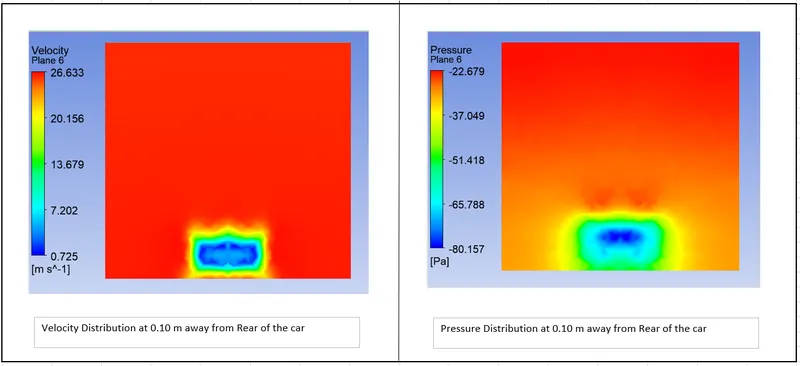
1. At 0.10 m away from Rear Portion of the car along X axis.
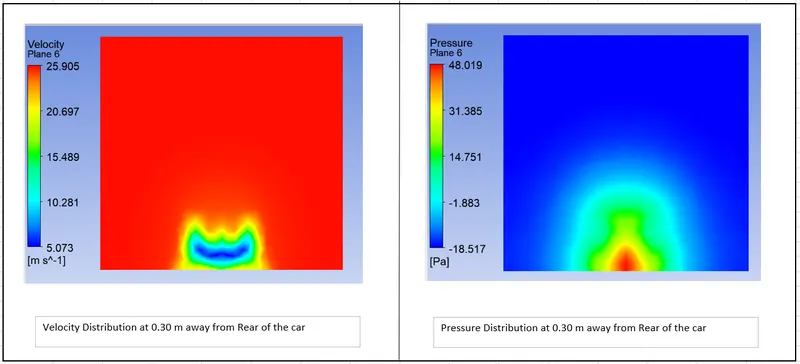
2. At 0.30 m away from Rear Portion of the car along X axis.
3. At 0.60 m away from Rear Portion of the car along X axis.
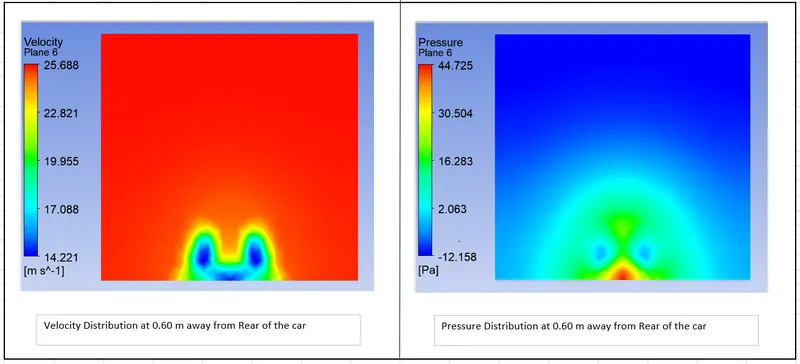
From above three Figures we can clear about As Flow passing through Car The wake region is Developed and As flow Goes Away From car the Wake region is becomes Less ie negative pressure is Created at Behind the car.
- Comparison Velocity Distribution At various Location Over Domain:-
- Comparison Pressure Distribution At various Location Over Domain:-
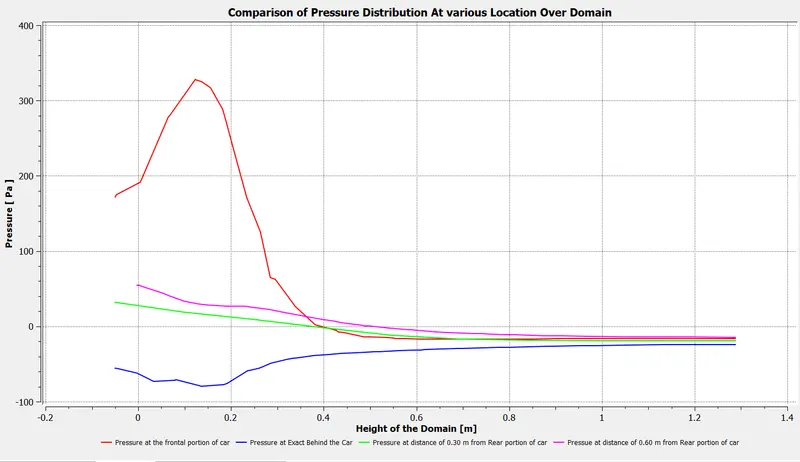
In above Plot we can see blue color line(negative pressure region) means Wake region.
CASE -3 :-
GEOMETRY :-
Geometry Is Same for the All three cases.
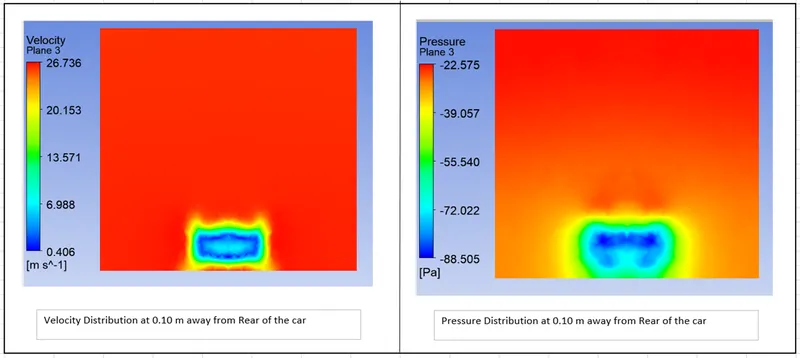
Mesh For Outer Enclosere is 100 mm, Inner Enclosere is 40 mm and For legs 2 mm. 6 Layer and 0.4 Firstlayer thickness used for Inflation layer for car body.
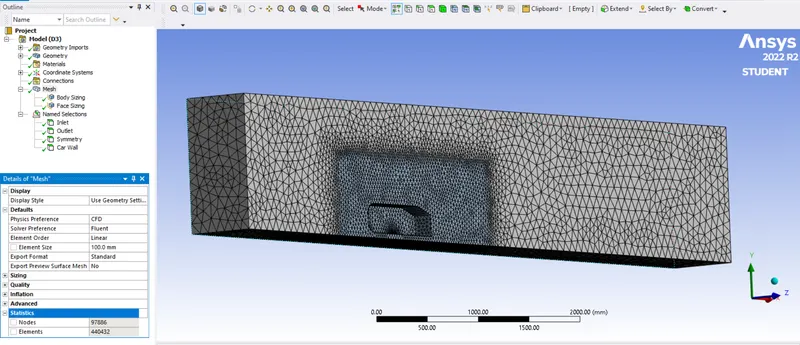
440432 Total No of elements used for meshing.
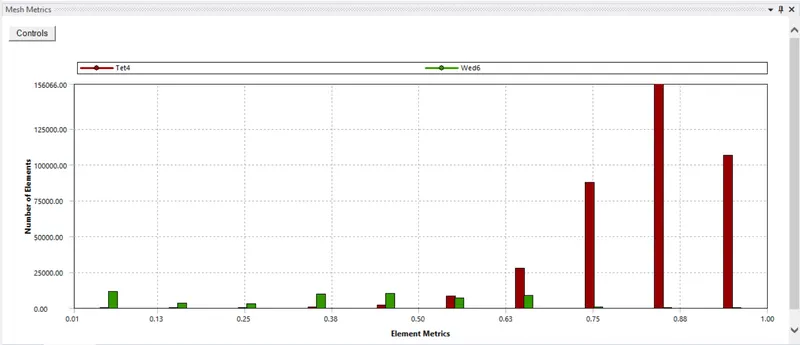
Element Quality:-
SET-UP:-
Set-up is Same for this case as Case 1, Only mesh has been changed.
RESULTS:-
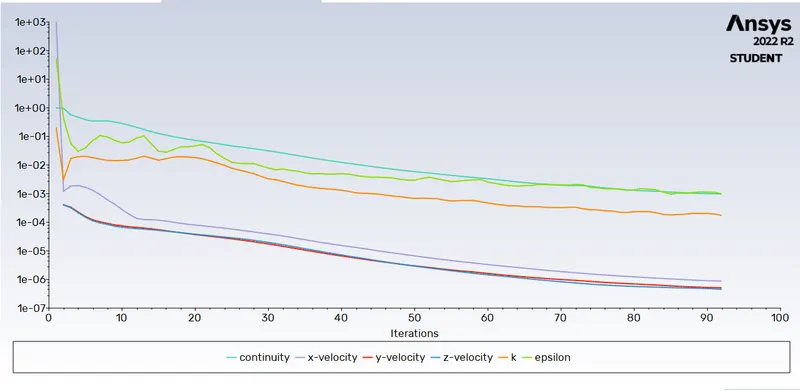
- Residuals Plot:-
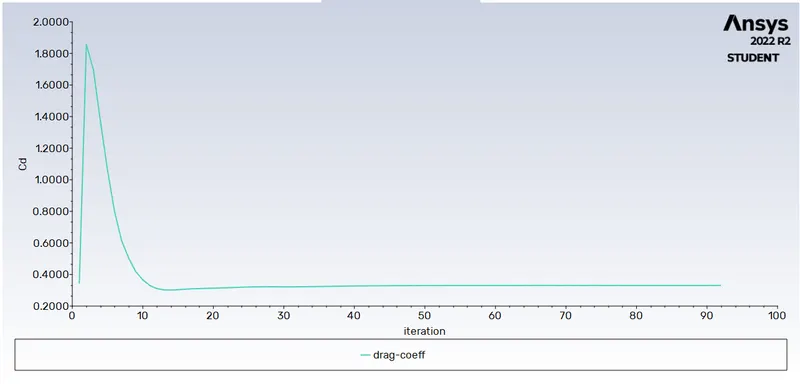
Drag Coefficient Plot:-
Here we are getting the value of Drag Coefficient(cd) as 0.33078358.
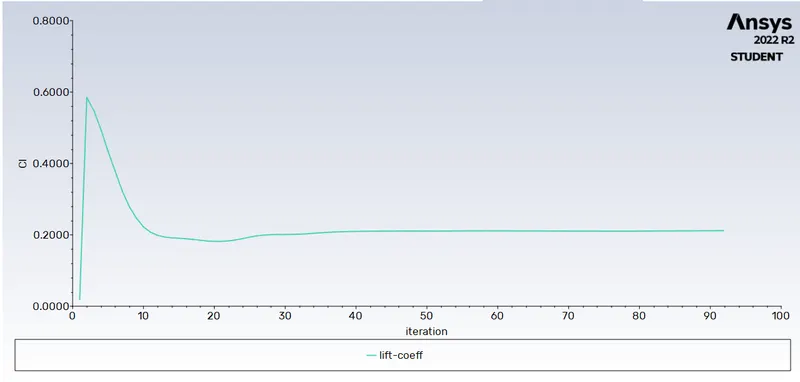
Lift Coefficient Plot:-
Here we are getting the value of Lift Coefficient(Cl) as 0.21189732.
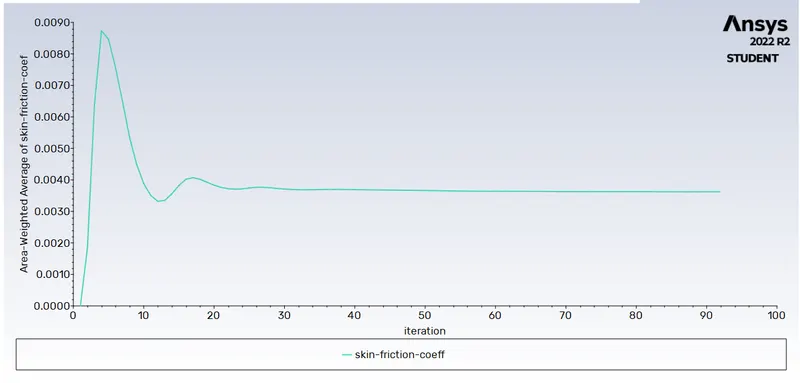
Skin Friction Coefficient Plot:-
Here we are getting the value of Skin Friction Coefficient as 0.0036240094
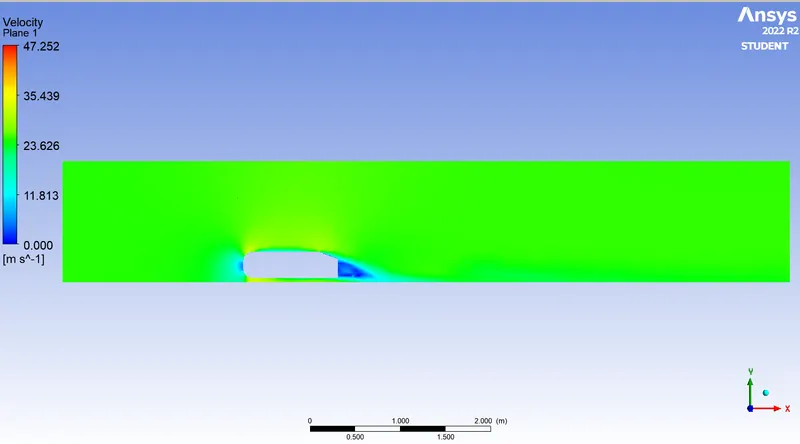
- Velocity Contour:-
In Below Velocity Contour We are clear about the Wake Region is Developed at the Exact Rear Portion Of the Car
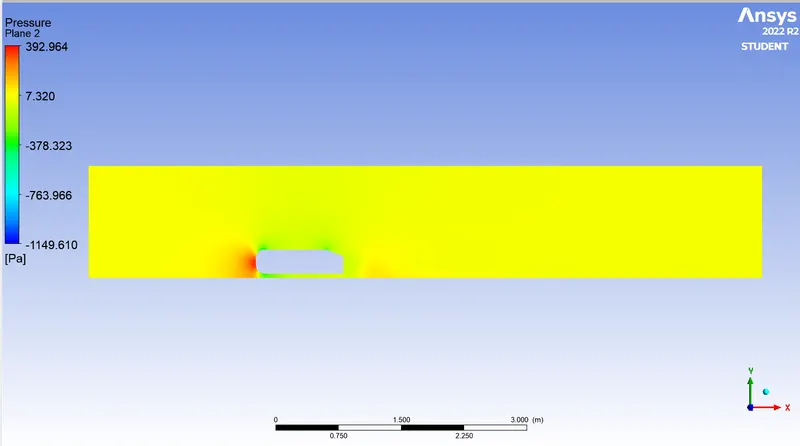
- Pressure Contour:-
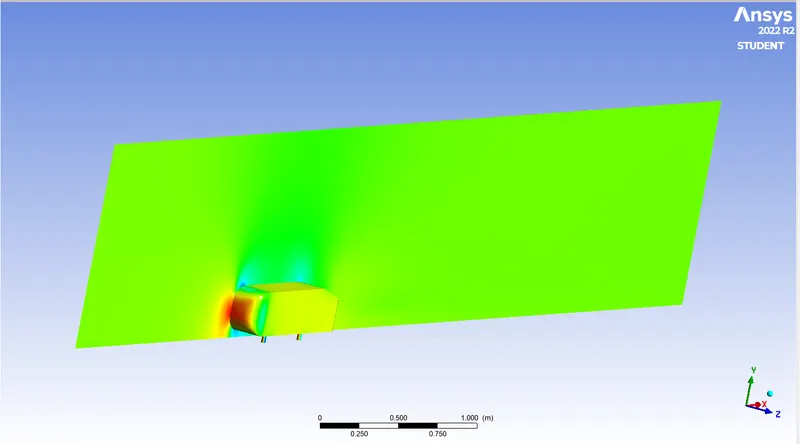
In Below Pressure Contour We are clear about the Pressure is more at Frontal Portion of the Car, that pressure is called as stagnation Pressure.
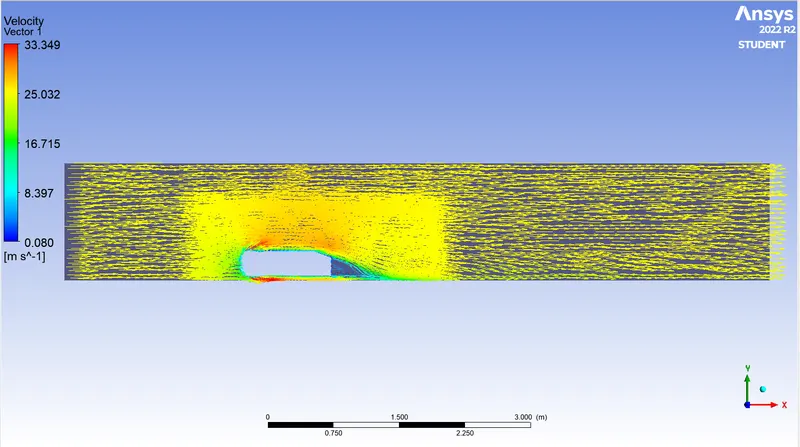
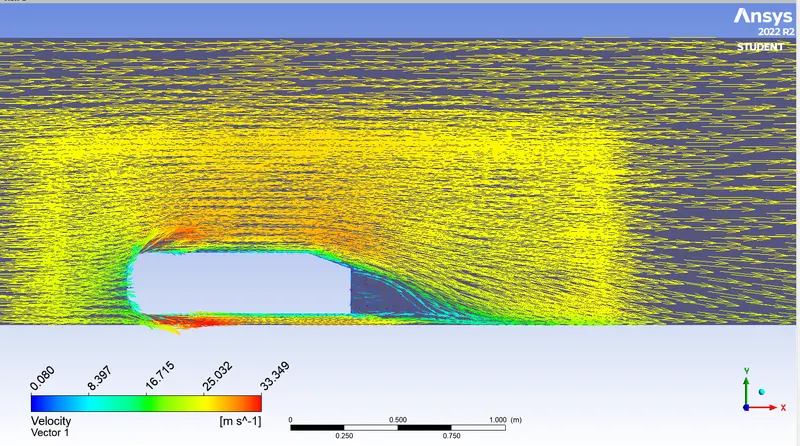
- Velocity Vector Plot:-
In below Velocity vector plot Wake rigion is clearly observed behind the car.
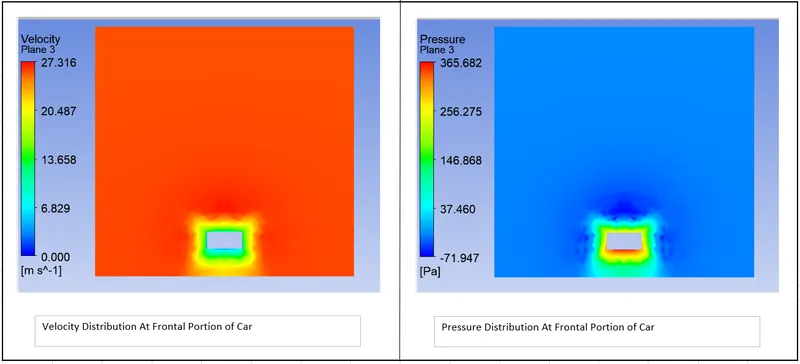
- Velocity and Pressure Distribution At Frontal Portion of Car:-
- Velocity and Pressure Distribution At Rear Portion of Car:-
1. At 0.10 m away from Rear Portion of the car along X axis.
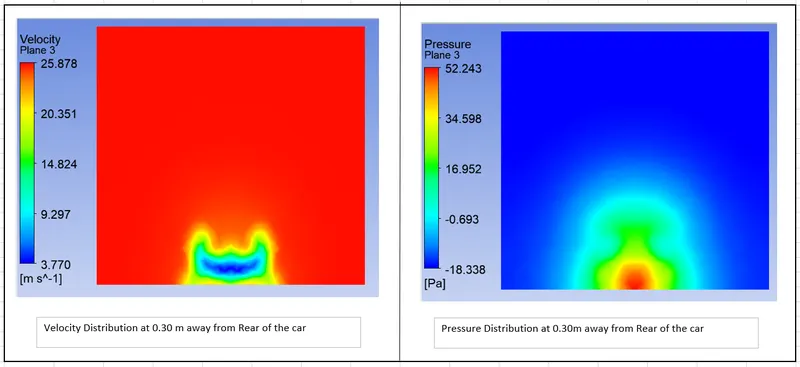
2. At 0.30 m away from Rear Portion of the car along X axis.
3. At 0.60 m away from Rear Portion of the car along X axis.
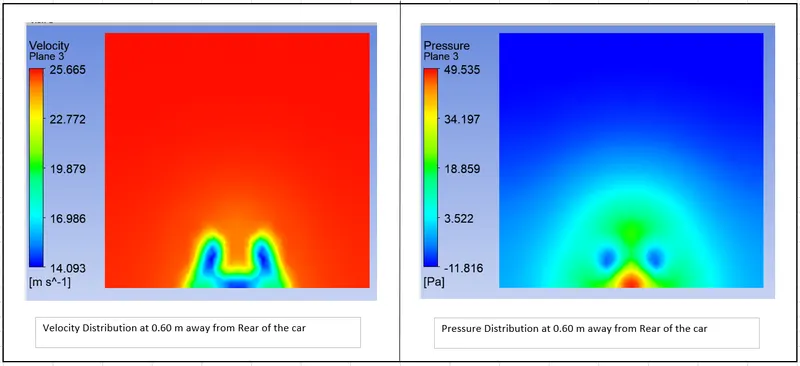
From above three Figures we can clear about As Flow passing through Car The wake region is Developed and As flow Goes Away From car the Wake region is becomes Less ie negative pressure is Created at Behind the car.
- Comparison Velocity Distribution At various Location Over Domain:-
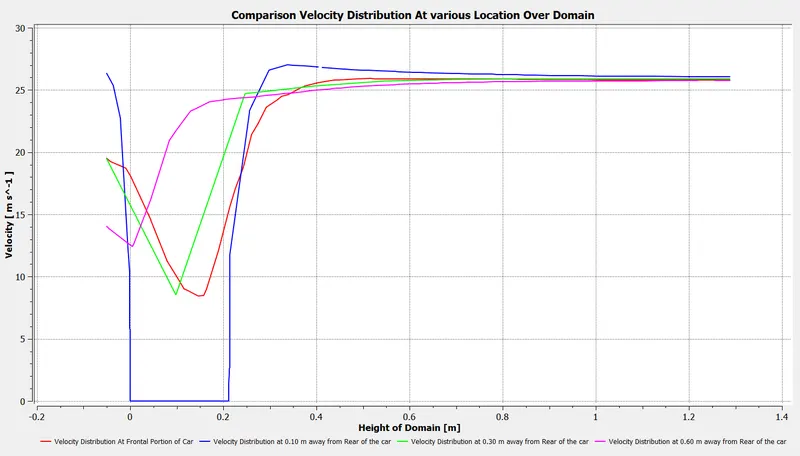
In above Plot we can see Blue line is Zero at Behind the Car region at 0 to 0.2 m Height.
- Comparison Pressure Distribution At various Location Over Domain:-
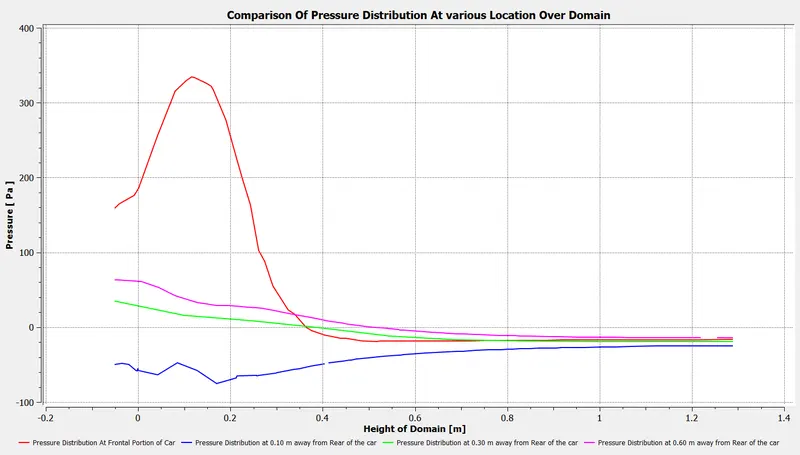
In above Plot we can see blue color line(negative pressure region) means Wake region and Red line is the Frontal portion Here Pressure is Very High.
PRESSURE DISTRIBUTION ON AHMED BODY:-
GRID INDEPENENCE TEST:-
| Cases | Total Mesh Elements | Coeff of Drag (cd) | Coeff of Lift (cl) | Coeff of Skin Friction |
| Case 1 | 60070 | 0.4183695 | 0.21589992 | 0.00333450 |
| case 2 | 187641 | 0.34743354 | 0.18009979 | 0.00345820 |
| case 3 | 440432 | 0.33078358 | 0.21189732 | 0.00362400 |
- In Above table we can see that As Total No. of. Mesh elements Increased Coefficient of Drag (cd) decresed and in case 3 we get the proper (cd).
- In above Results for All three cases In case 3 Proper Results are obtained.
CONCLUSION:-
- In baseline Mesh( course Mesh) we are getting Poor Result and we can not capture the Proper Results.
- After Mesh Refinement (Fine Mesh) We are getting good Results comparatively Course mesh.
- we obseved almost Zero Velocity at Frontal portion Of Model, means flow becomes static at Frontal portion of Model and tries to move from up side.
- we observed Negative pressure at behind the Ahmed body model is due to flow separation,recirculation flow and that is the wake region. The pressure inside the wake region remains low as the flow separates and a net pressure force (pressure drag) is produced.