Week 3 - External flow simulation over an Ahmed body.
Objective: External flow simulation over the Ahmad body.
Expected result:
- Pressure and Velocity Contour.
- The drag Coeficient for refined mesh.
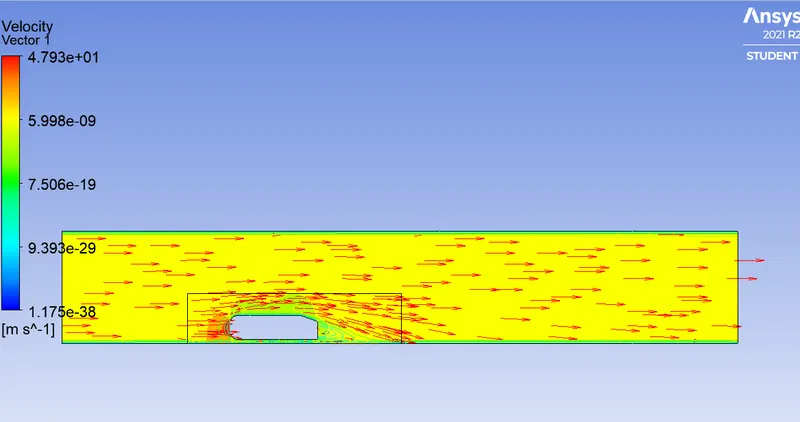
- The vector plot clearly showing the wake region.
- Grid dependency test.
Q .1) Describe Ahmad’s body and its importance?
The Ahmed body is a simplified vehicle model that captures the essential flow features around an automobile. Also, Ahmed's body allows us to capture aerodynamic characteristic relevant to bodies in the automobile industry. This model is also used to describe the turbulent flow field around a car-like geometry. When the numerical model is validated, it is used to design new models of the car. To test this geometry for ourselves, in this study, we employ a CFD solver is and then calculate the drag values.
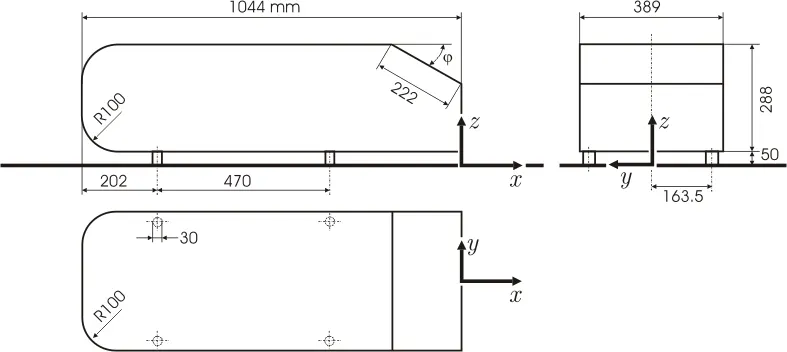
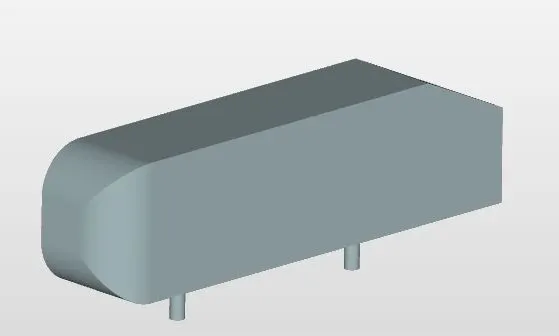
This is a sample, how we construct the ahmad body.
Here i am using total element size in between 3 lakh to 4 lakh.
The Ahmed body generates the crucial features of flow pattern around a car for instance flow impinge-mentation and the displacement around the nose, relative uniform flow of air around the middle portion and flow separation along with the wake generation at the rear.
Q.3) Explain the reason for the negative pressure in the wake region?
By analyzing the above plots following observations have been made.
- At the inlet we have taken the 25 m/s velocity which is the free stream velocity.
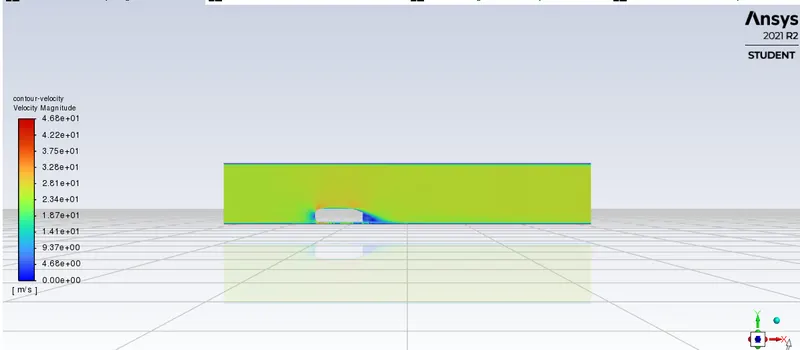
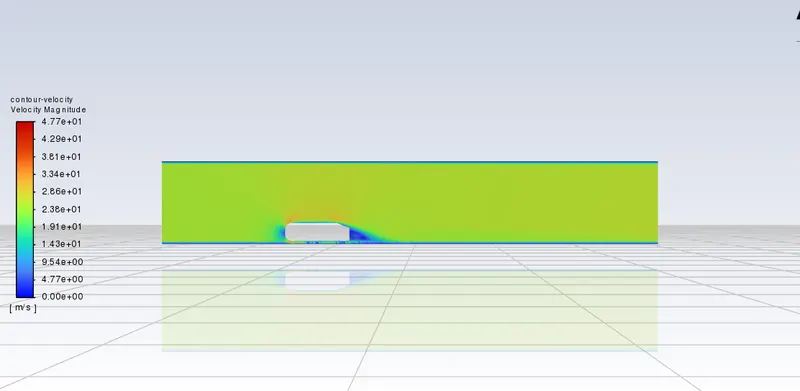
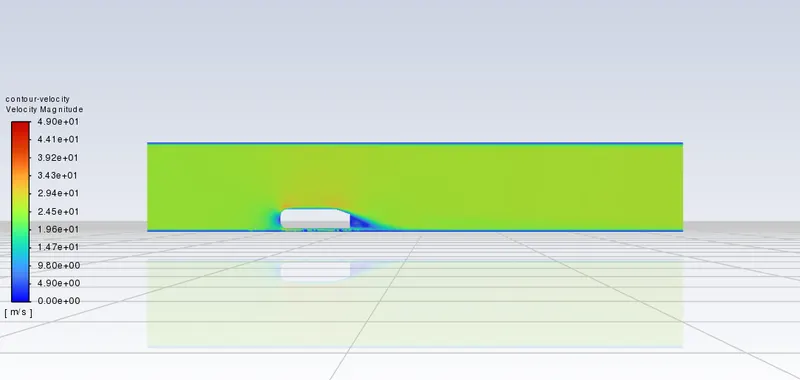
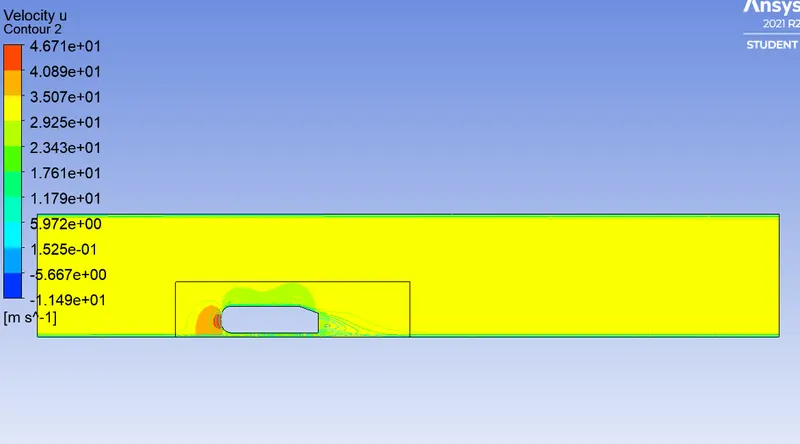
- As the air comes towards the right hand side there is an obstacle for the flow field due to Ahmad body (car wall). The air particle will strike the front face of the Ahmad body and it slow down the air speed. we easily see the reduction occur in the contours.
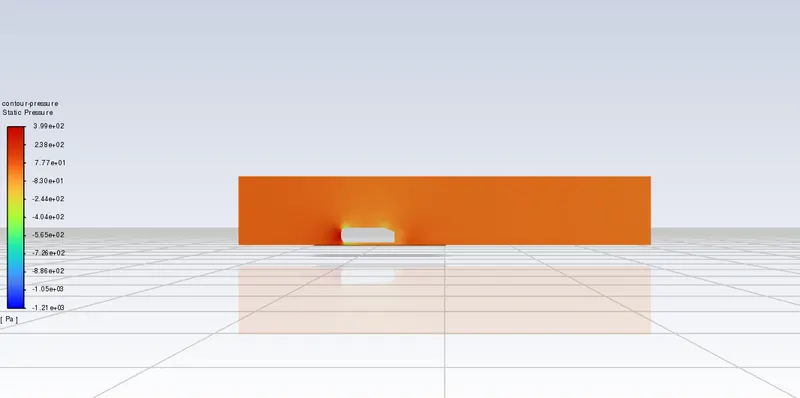
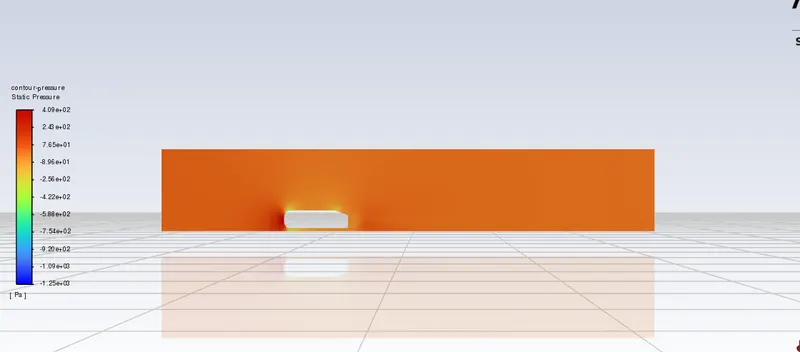
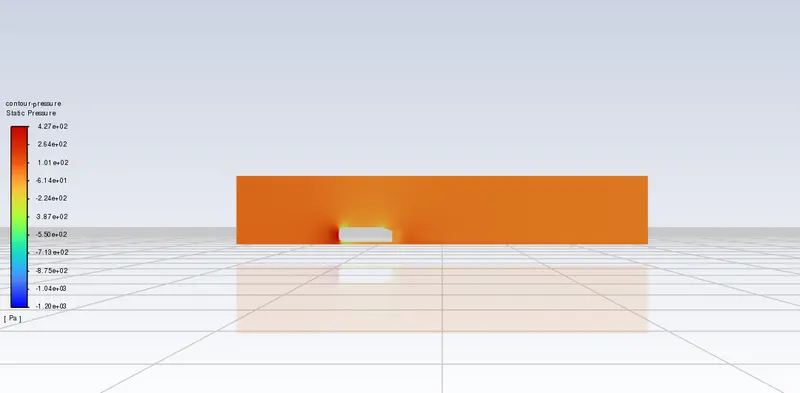
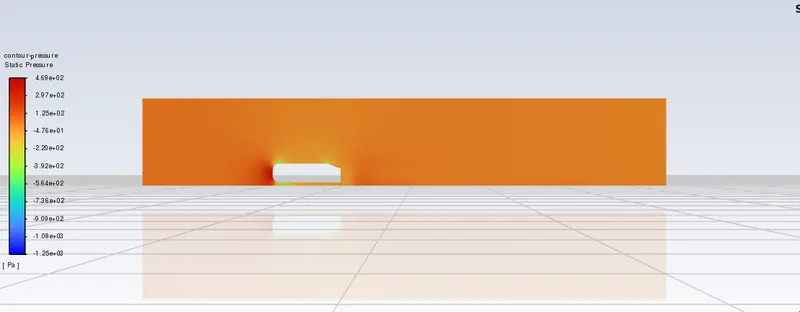
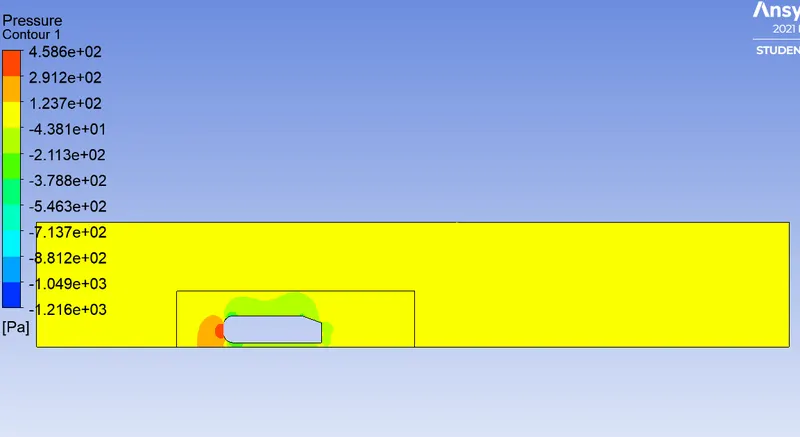
- As the air molecules strike with the Ahmed body there is increase in pressure occur. which we easily see in the pressure contours.
- There is a continuous flow of air from left to the right hand side and air molecules will be forced to flow over the Ahmad body. Hence the straight line path of the flow will get diverted to upward and downward. This thing we easily observed in the vector plot.
The wake inside the boundary layer is the most important thing to analyze in order to determine the amount of drag (and other forces) experienced by the body. The flow inside the boundary layer gets detached because of the adverse pressure gradient. This adverse pressure gradient (i.e. flow of fluid inside the boundary layer flowing opposite to the flow of fluid directed over the body because of the motion of the body) then creates a difference in pressure ahead of the body and behind the body which increases the overall drag. Now from the point of flow separation, inside the boundary layer, the flow gets unsteady, and this unsteadiness then propagates as it moves in random fashion (distorted or discontinuous or irregular or turbulent flow). The turbulence then energies the flow closer to the surface, thereby increasing the flow velocity closer to the surface (like the golf --ball). It is turbulence of the flow what we know as the wake, inside the boundary layer.
The separation of the boundary layer over the surface of the Ahmad body is because of the deceleration of the flow along the viscous flow path which causes the downstream pressure at a point inside the boundary layer flow higher than the pressure of the upstream flow closer to the leading edge. This difference in pressure inside the boundary layer from upstream to downstream creates a flow inside the boundary layer opposite to the (upstream flow) direction of the free stream flow around the body. This movement of the downstream flow from higher pressure region to the upstream flow at lower pressure region inside the boundary layer creates a motion of the flow opposite to the motion of the free stream flow creating disturbance to the upcoming free stream flow which then propagates this disturbance along the surface of the Ahmad body and hence opposing of the upstream flow which interferes with the free stream flow creating a wake/turbulence inside the boundary layer that grows along the surface of the Ahmad body from the point of separation. This opposing of the upstream flow/deceleration of the flow increases the drag over the Ahmad body at large angle of attack which reduces the momentum of the flow.
Q.3) Explain the significance of the point of separation?
The point of separation is an important parameter which extents of the flow separation zone and hence drag. By changing the slant angle means we change the point of separation and improved the drag coefficient.
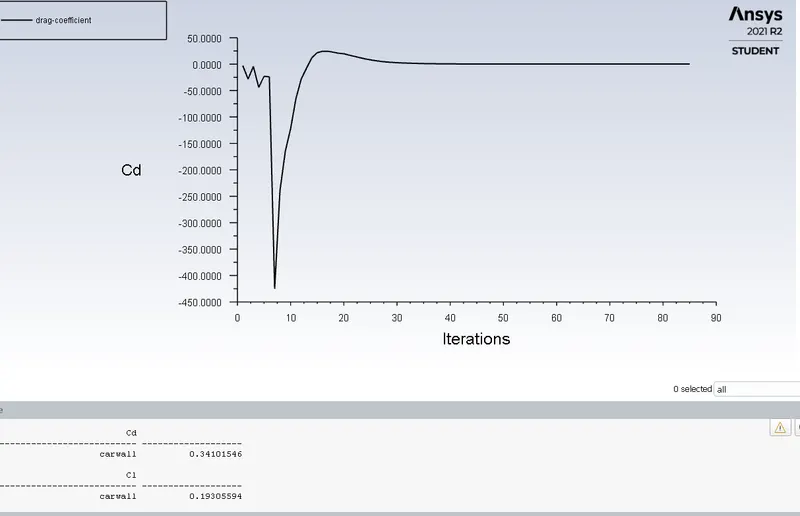
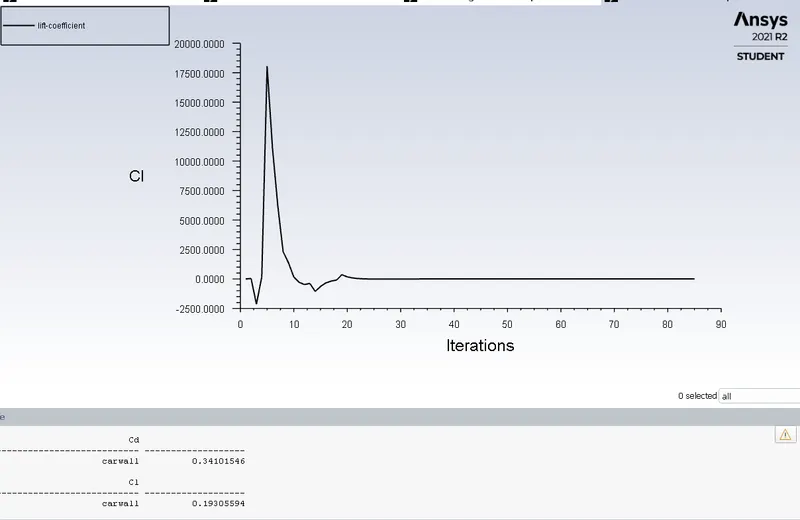
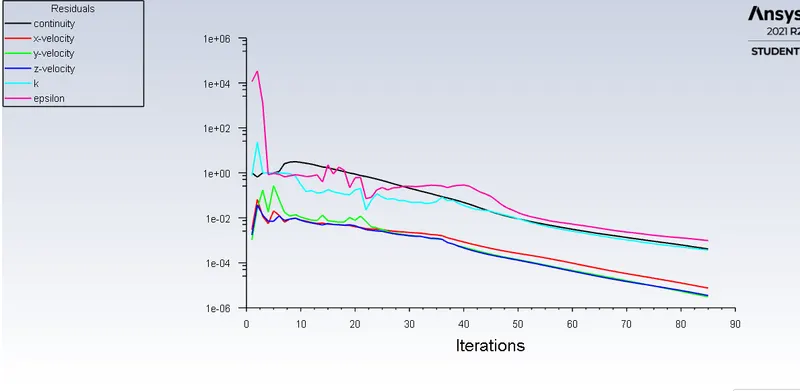
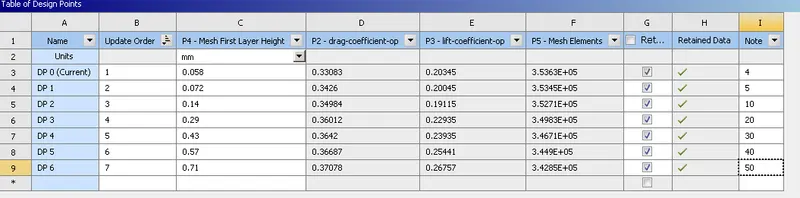
Here, I am going to change only Yplus value to get the drag coefficient value according to the research paper and all the mesh parameter are same.
Method : Multizone
Element Size: 90mm
Body sizing
Element Size : 45mm
Face Sizing
Element Size: 45mm
Number of inflation layer : 6
Adjusting First layer thickness according to the Yplus value
Formula for First layer thickness is
`y^(*)` = 1.4525*e-05*Yplus
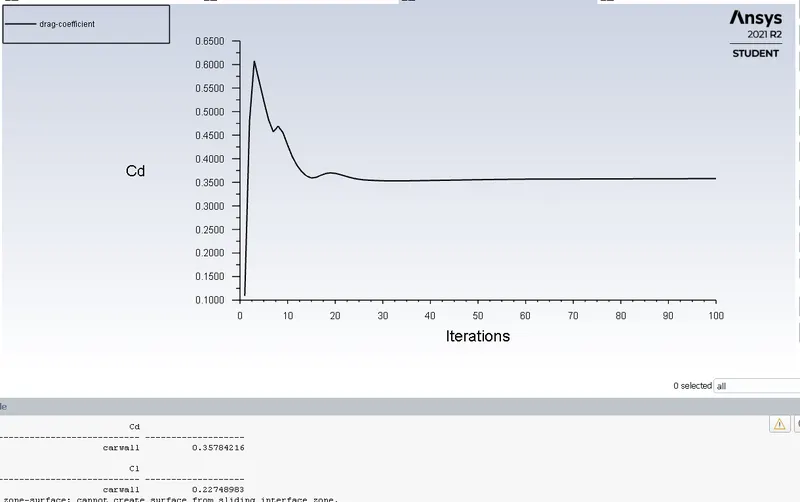
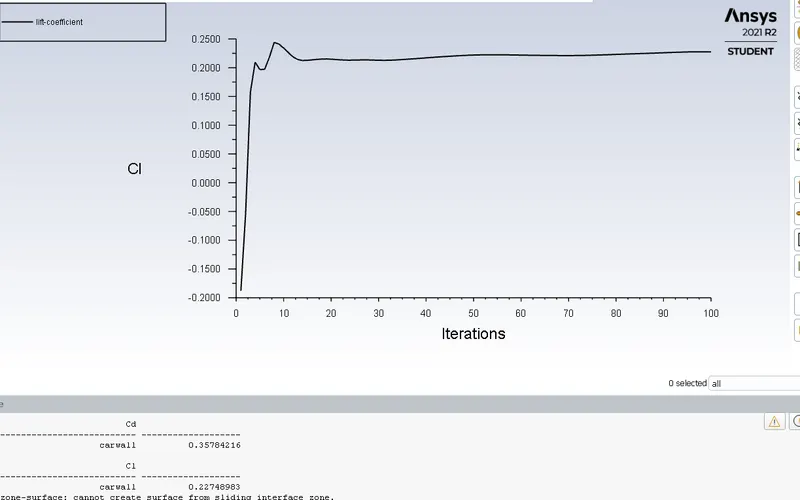
Yplus 20 (First layer thickness = 0.2905mm)
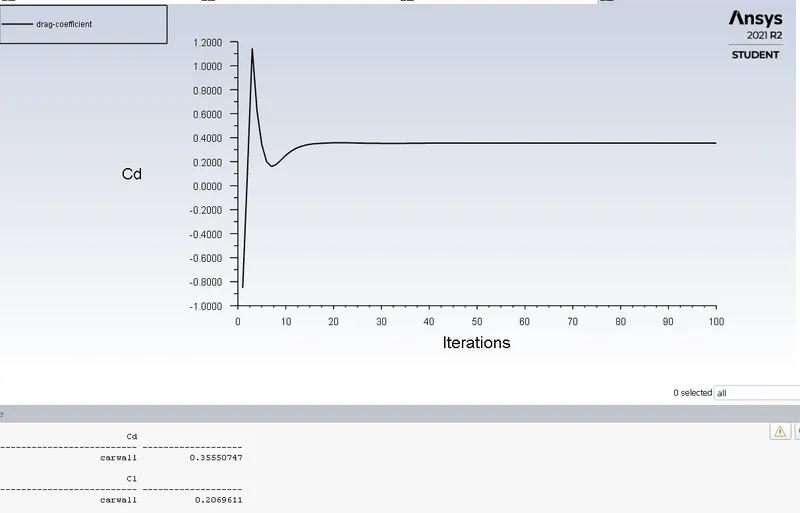
Drag coefficient
lift coefficient
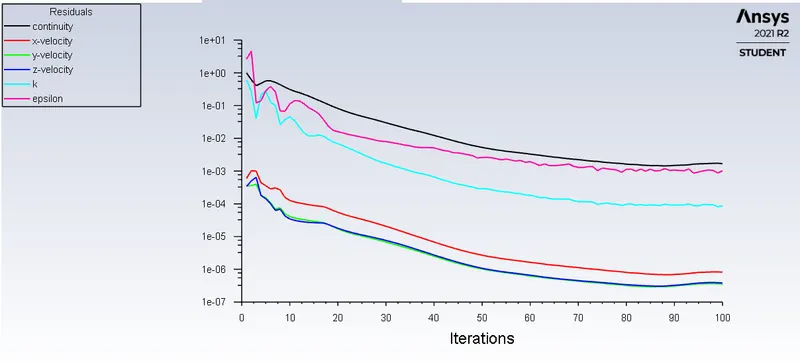
Residuals
Pressure Contour
Velocity Contour
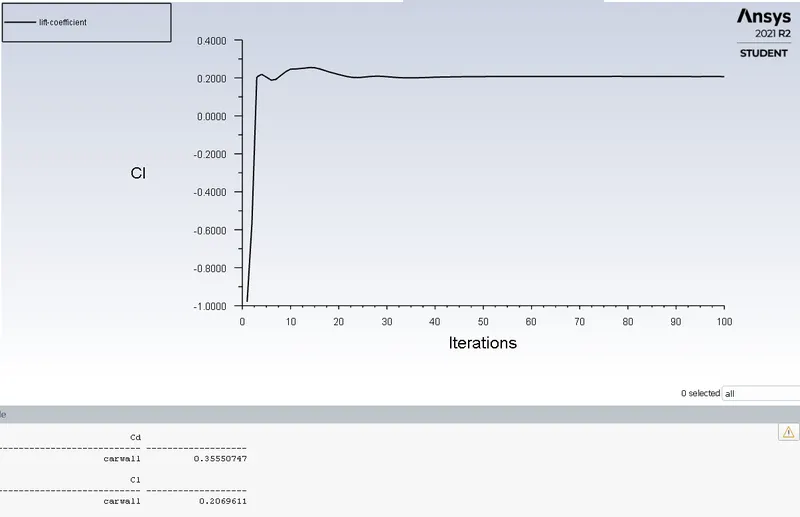
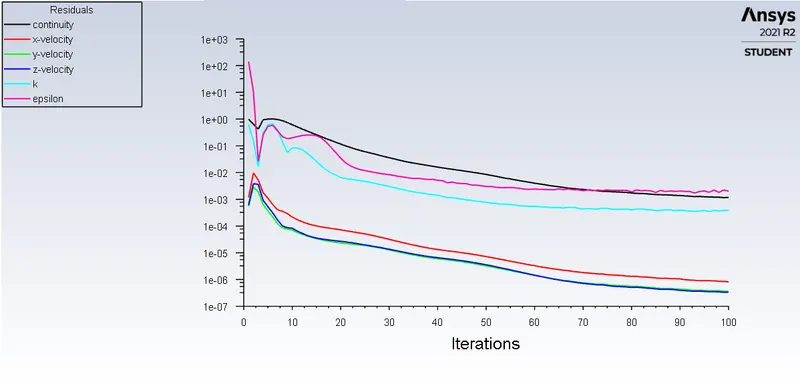
Yplus 10 (First layer thickness =0.145mm)
Drag coefficient
lift coefficient
Residuals
Pressure Contour
Velocity Contour
Yplus 5 (First layer thickness = 0.072mm)
Drag coefficient
lift coefficient
Residuals
Pressure Contour
Velocity Contour
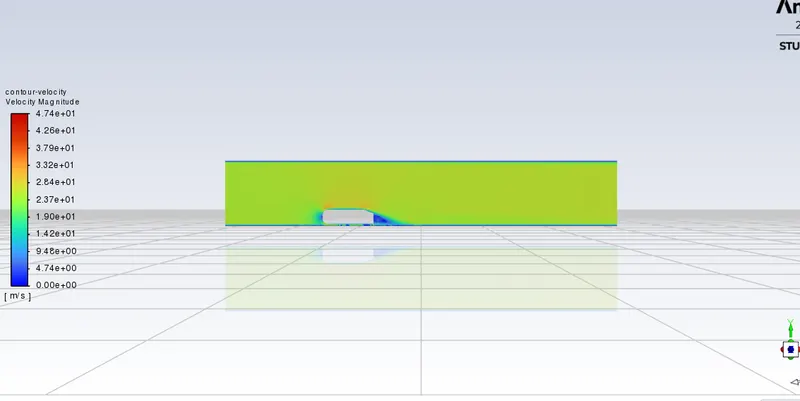
Yplus 4 (First layer thickness = 0.0581mm)
Drag coefficient
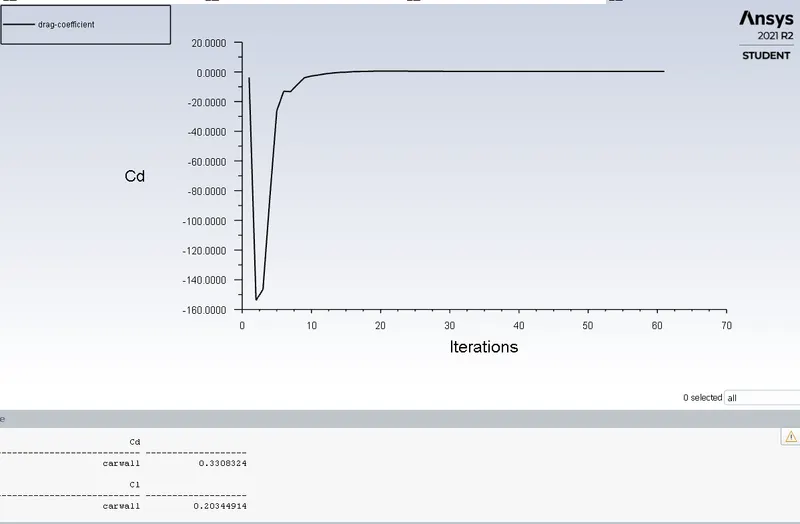
lift coefficient
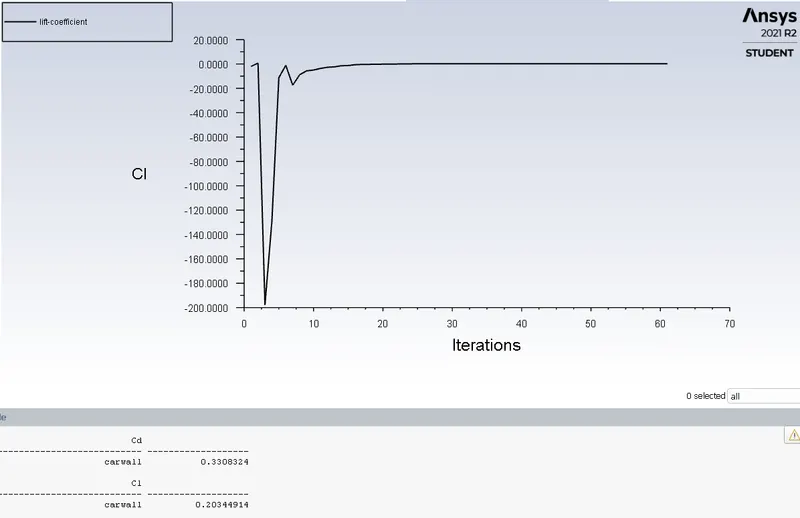
Residuals
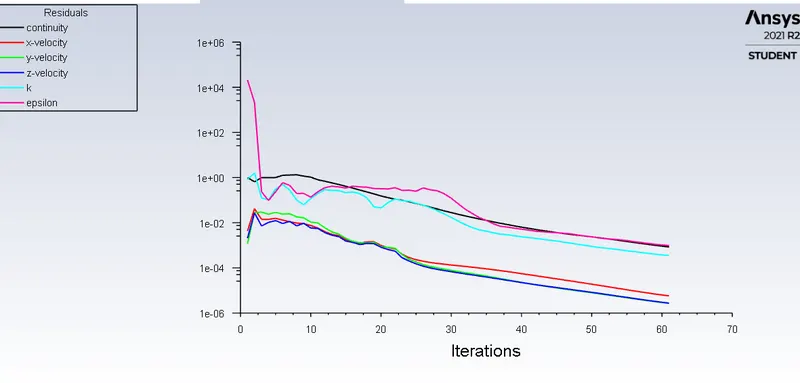
Pressure Contour
Velocity Contour
Velocity Vector
Grid Test
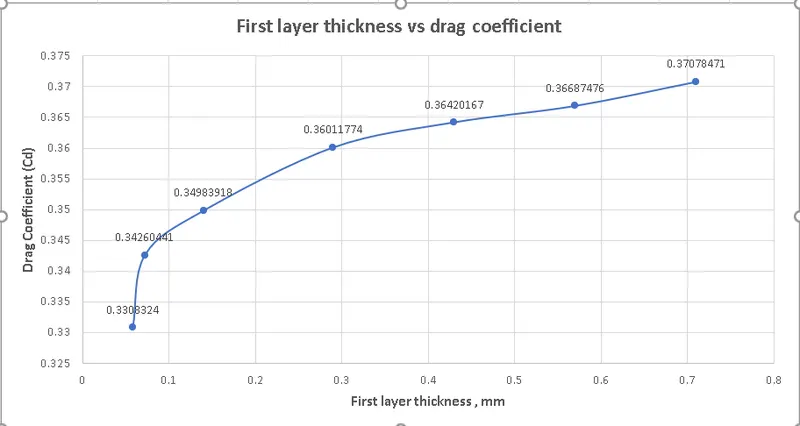
Above plot showing that drag coefficient is depend on the how the finner our mesh is. More the mesh finner, drag coefficient will be less.
Conclusion
- The flow over the Ahmad body is successfully simulated and analyzed.
- The flow separation, negative pressure, recirculation phenomena and re attachment are specially observed in the wake region. All these phenomena are observed in the Contours and vector plots.
- The point of separation is an important parameter which extents of the flow separation zone and hence drag. By changing the slant angle means we change the point of separation and improved the drag coefficient.
- Reference and Y+ values are important effect on drag and lift. And also on overall results.
- In the finer mesh, we got the exact value of drag.
- Velocity plots are almost same in the above cases. Basically, we are creating the two line at different distances in the back of the Ahmad body. Both lines approximately gave the same velocity plot. In the velocity plot we easily observe that in the start the value of velocity is slow but gradually it increases and attain the maximum free stream velocity which is 25 m/s. In the starting the decrease occur in the velocity plot is due to the separation of flow, which we clearly cleaned in the velocity.