Week 3 - External flow simulation over an Ahmed body.
Aim: To Run the CFD simulation of the air flow over Ahmed body with velocity of 25 m/s with Ansys Fluent solver and To Obtain the answers to following questions.
Q1. Describe Ahmed's body and its importance.
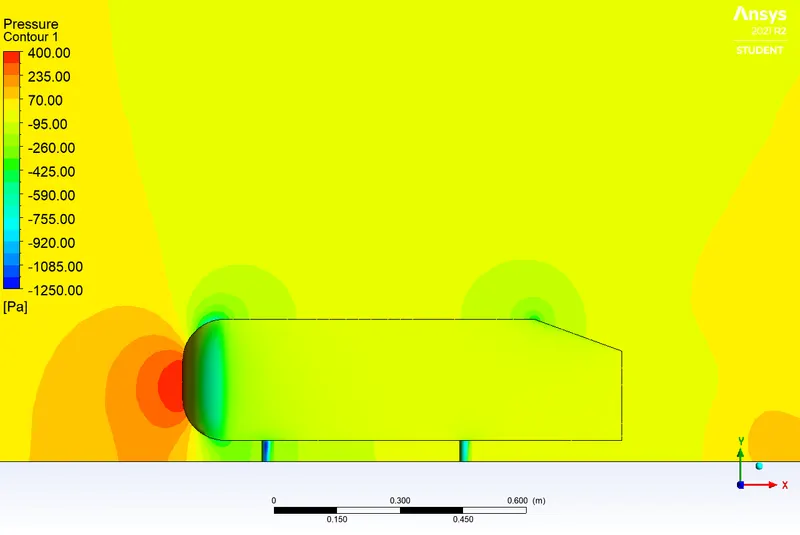
Q2. Explain the reason for the negative pressure in the wake region.
Q3. Explain the significance of the point of separation.
Expected Results:
1. Velocity and pressure contours.
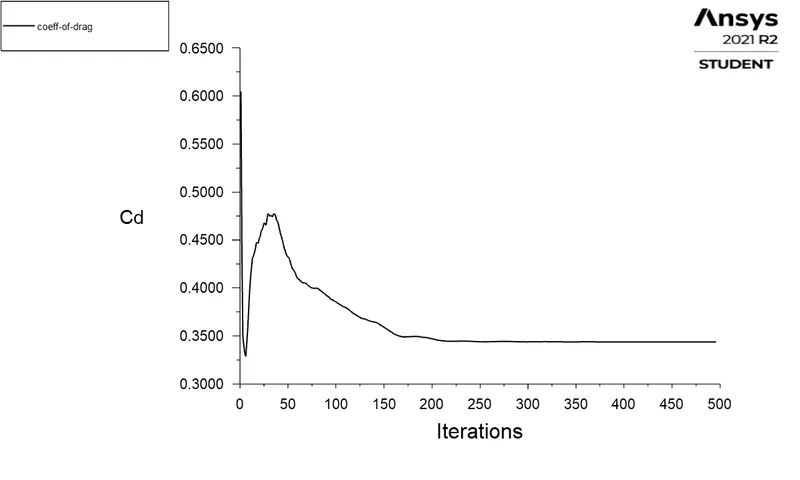
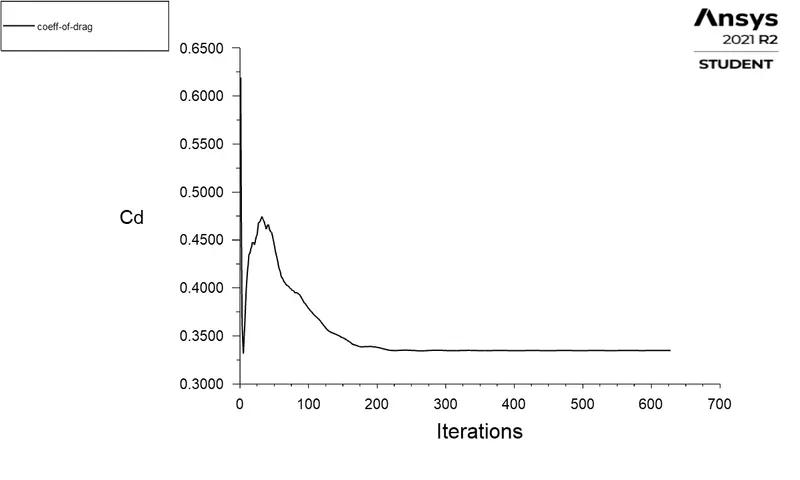
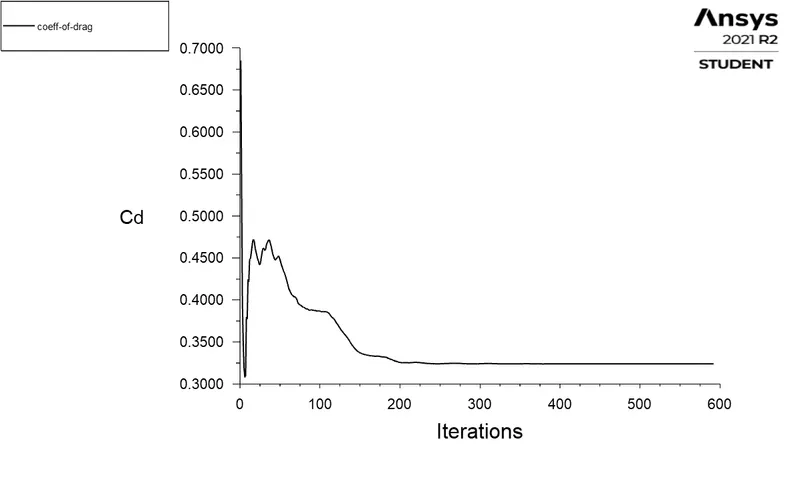
2. The drag coefficient plot for a refined case. ( For `V` = 25m/sec, `C_d` should be around 0.33).
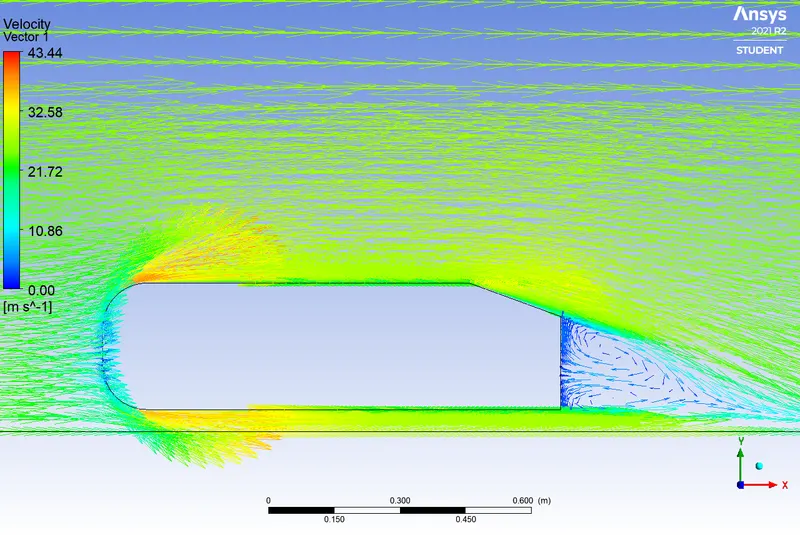
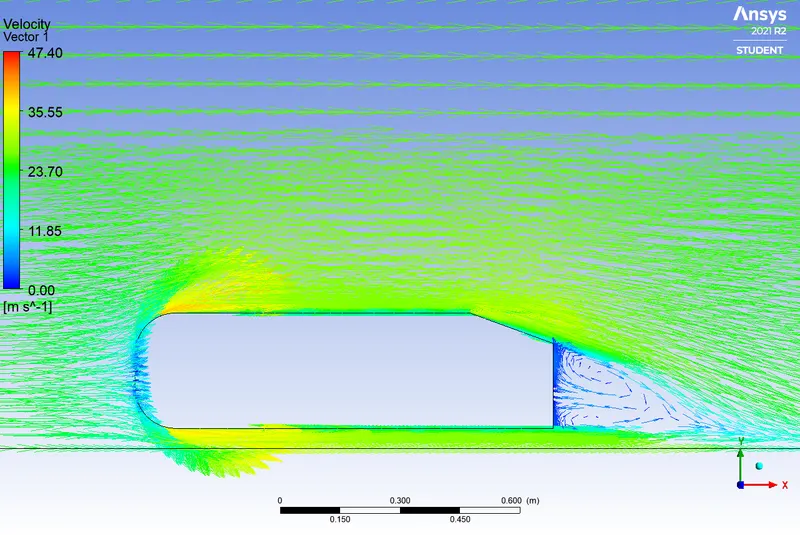
3. The vector plot clearly showing the wake region.
4. Results for Grid independence test.
Ahmed Body and its importance:
Ahmed Body is a bluff body model of generic ground vehicle made by S.R. Ahmed et al. in 1984 to study the essential flow features like pressure fields, wake regions and forces acted on the vehicle model in the wind tunnel test. The Results of this wind tunnel test are available and used for the validation of results obtained through CFD simulations.
Details of Ahmed Body:
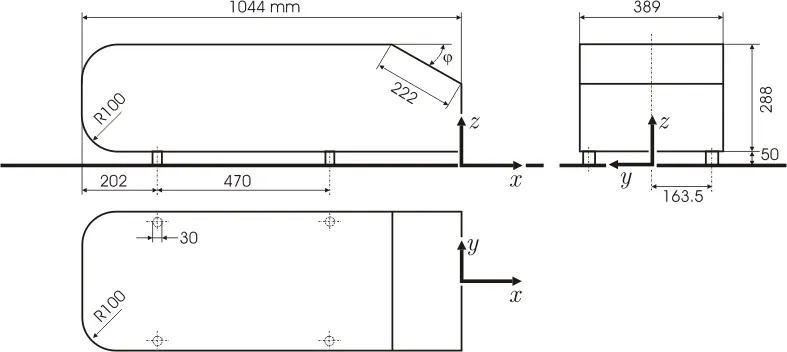
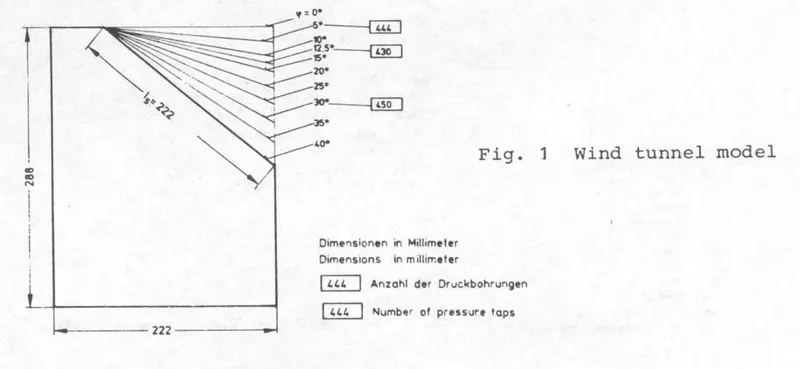
Here for the simulation the Ahmed body with `20^@` base slant angle is used.
External Flow:
The external flow over a body has a maximum velocity gradient where the pressure gradient is zero. After this state the fluid flow decelerates due to the adverse pressure gradient and eventually comes to rest, this point where velocity of fluid flow becomes zero, is known as the flow separation point.
Point of separation is the point on the external surface of the body at which the pressure gradient with respect to the streamline coordinate x starting from the stagnation point, is positive (adverse) and velocity gradient is zero. i.e. (`(dP)/dx > 0 & (dV)/dx< 0`).
After this point of separation the fluid near the surface lacks the momentum to overcome the pressure gradient and continued downstream movement is impossible, thus boundary layer separation occurs and wake is formed in the downstream region of the flow near the surface. Flow in this region is a highly irregular vortex flow.
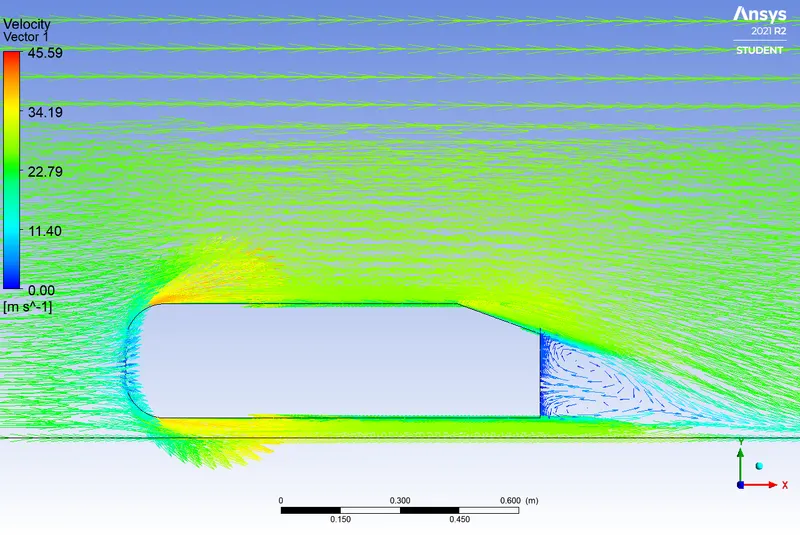
The separation of flow takes place at the trailing edge of the Ahmed body which causes the formation of wake in the immediate back region of the Ahmed body. There is a negative pressure zone inside the wake region due to the adverse pressure gradient as explained above.
-
Simulation workflow:
As the Ahmed body is symmetric about its longitudinal axis and external flow unidirectional & along longitudinal axis thus the body is sliced about its longitudinal axis to minimise the computational domain and computational time. The sliced Ahmed body geometry has been enclosured in two enclosures to facilitate the mesh refinement near the Ahmed body surface which is the area of utmost interest.
Back Slant angle of Ahmed Body Geometry Sliced Ahmed Body 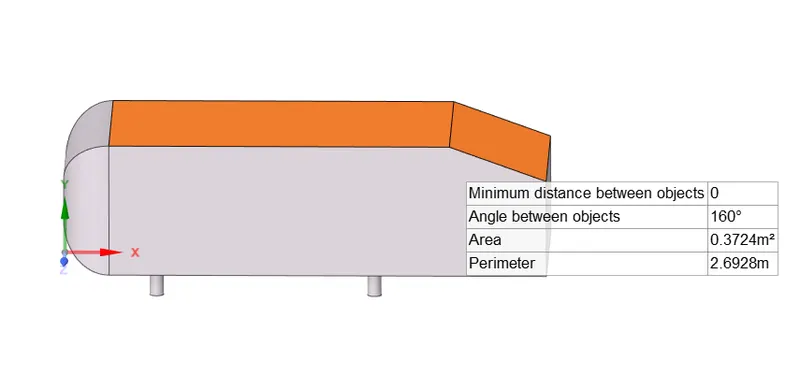
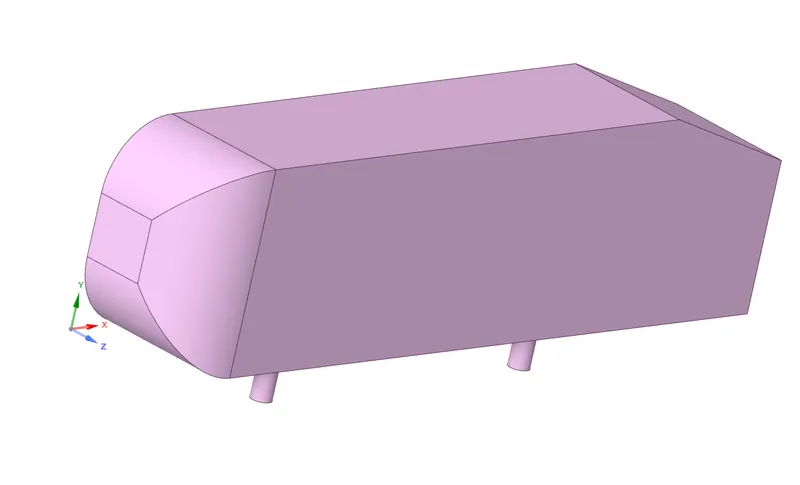
Enclosures for Simulation for flow over a Ahmed Body 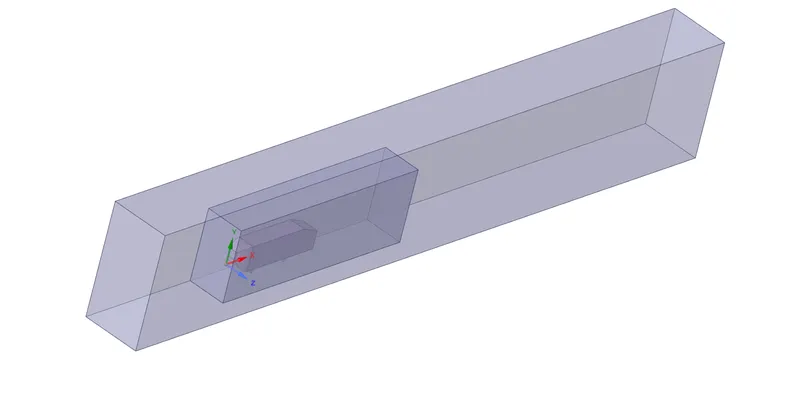
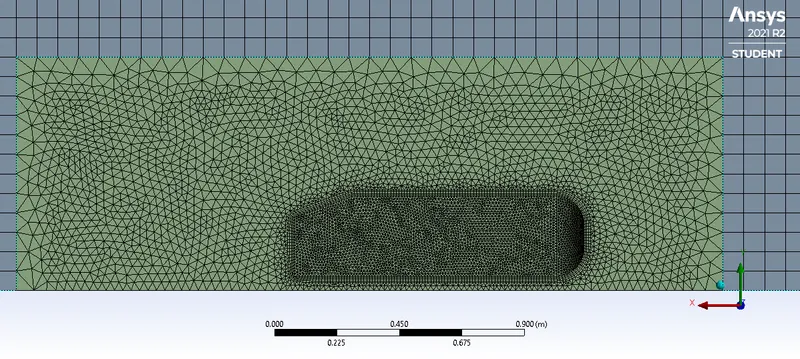
- Named selections are done and Mesh is generated with mesh refinement inside the small enclosure.
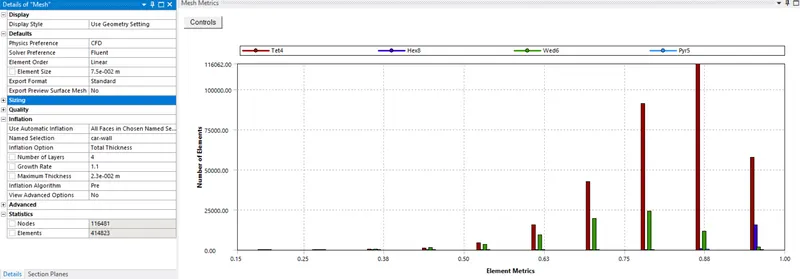
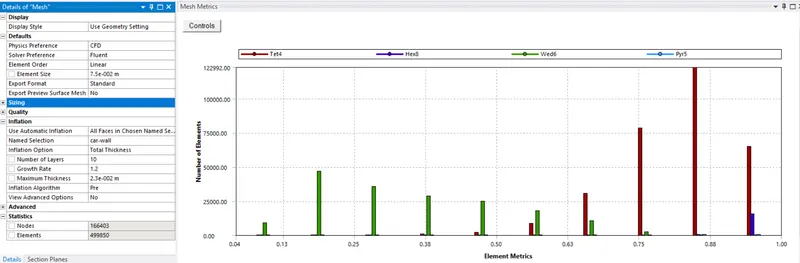
- Mesh quality has been checked and found acceptable then Case is set up in the fluent solver with Pressure based steady state solver with SIMPLE scheme (As max air velocity is less than `(1/6)^(th)`of speed of sound, the pressure based solver is used). The viscous model is set with k-epsilon turbulant model. The cellzone and boundary conditions are set up with air as the working fluid with inlet velocity 25 m/s and outlet has the atmospheric pressure outlet boundary condition. The required reference values are set and rest are imported from the inlet boundary conditions.
Viscous model: Solution Methods: 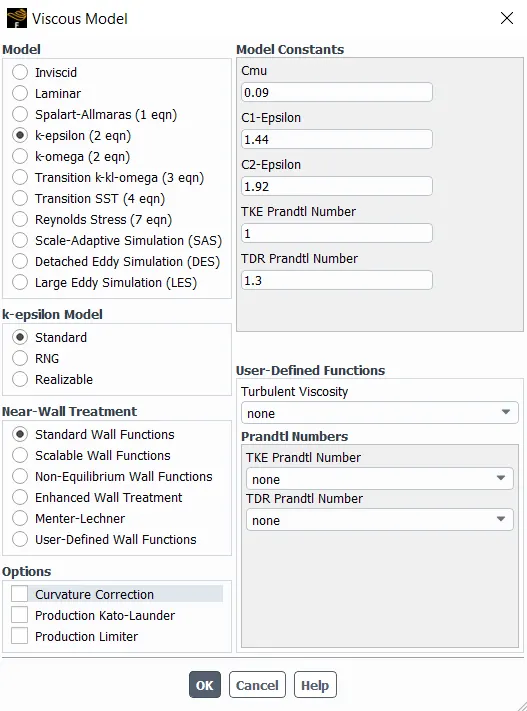
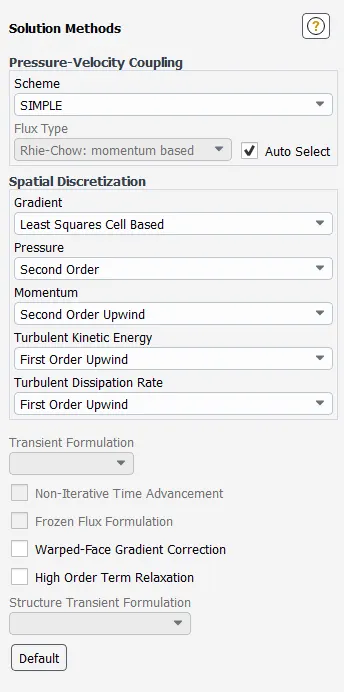
Boundary Conditions: Reference Values: 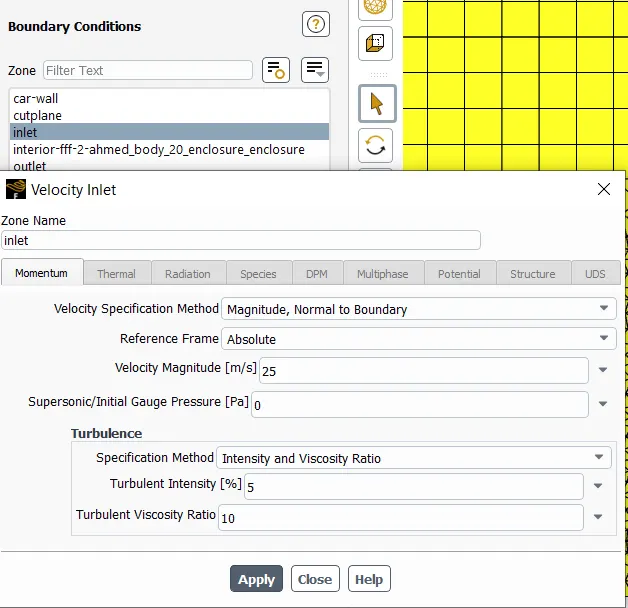
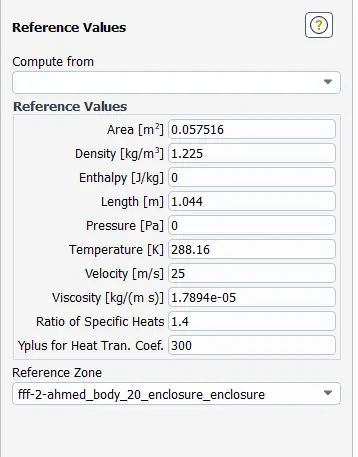
- Solution is initialised with hybrid initialisation. The velocity and pressure contour settings are done. Similarly the animation settings are set accordingly. The Reports for the coefficient of drag and Coefficient of lift are assigned to for plots.
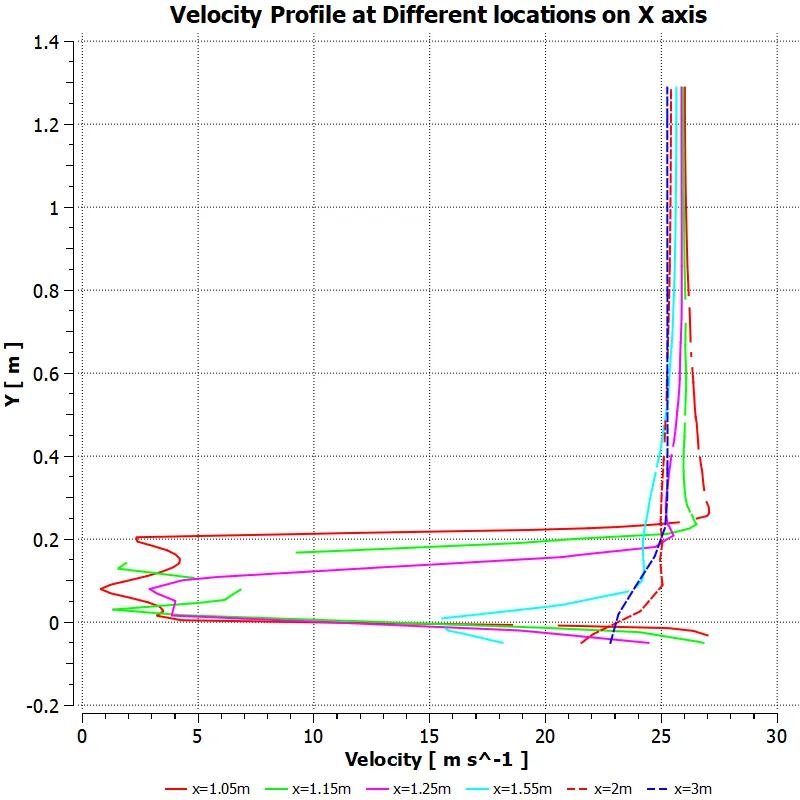
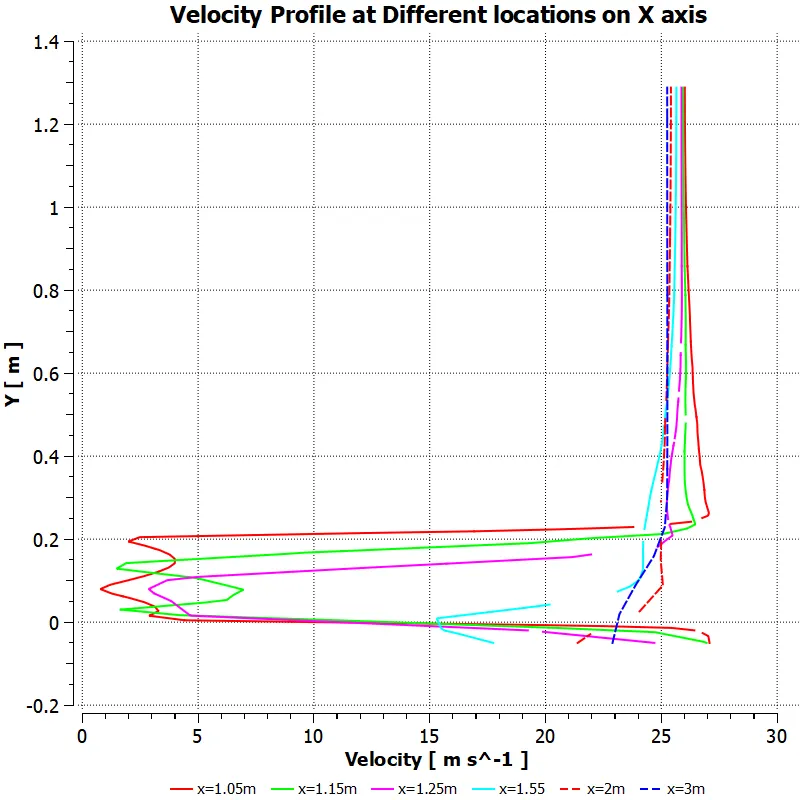
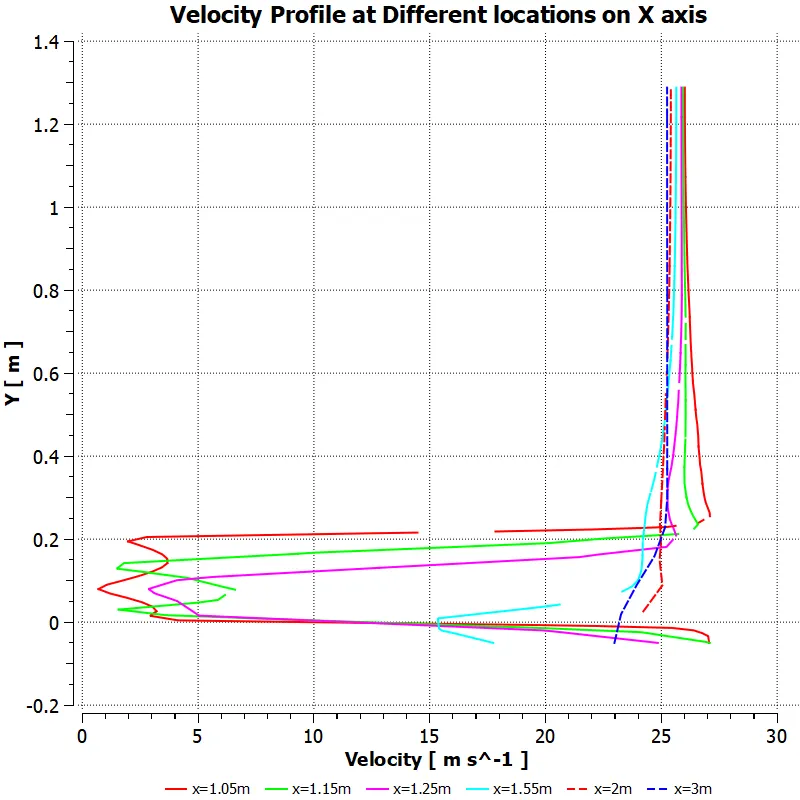
- The Results are post processed in the CFD-Post. The required velocity and pressure contours are plotted. The velocity profiles at various distances from the back of Ahmed Body are plotted.
- Same procedure is followed with all the models with different grid sizings.
- The Results for grid independence test are tabulated in the Observation table and conclusions are drawn.
Results and Reports:
Case I:
|
Mesh: |
|||
 |
|||
|
Mesh Metrics:
|
|||
|
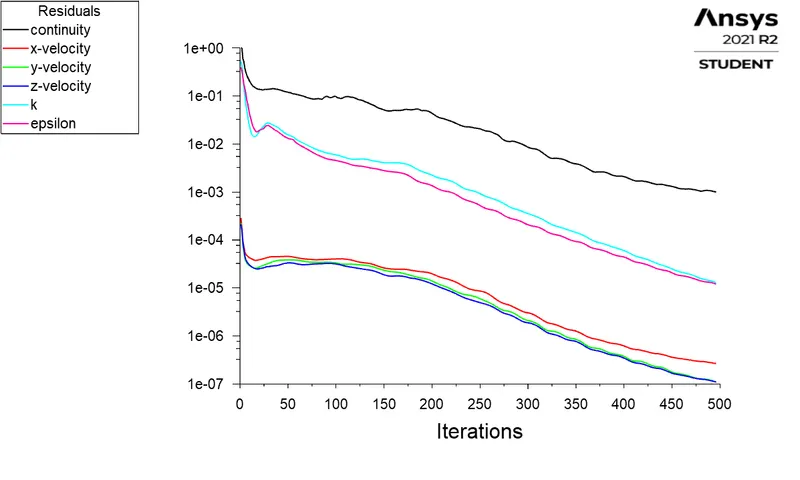
Residuals Plot:
|
|||
|
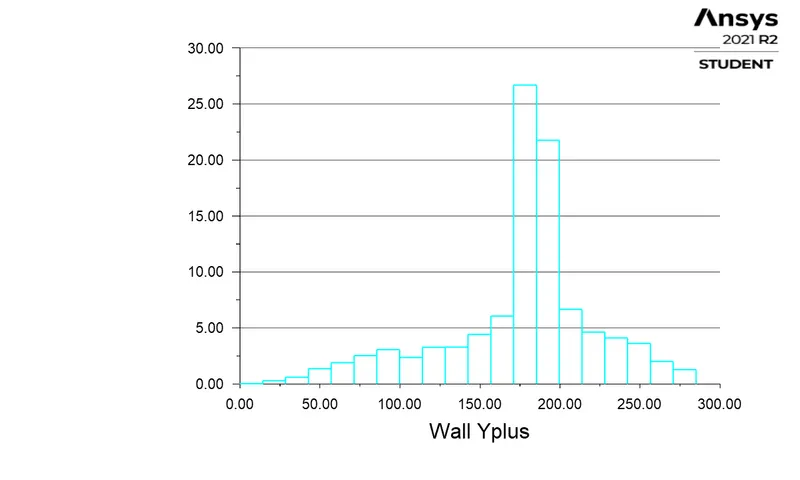
Yplus Histogram For Ahmed Body:
|
|||
|
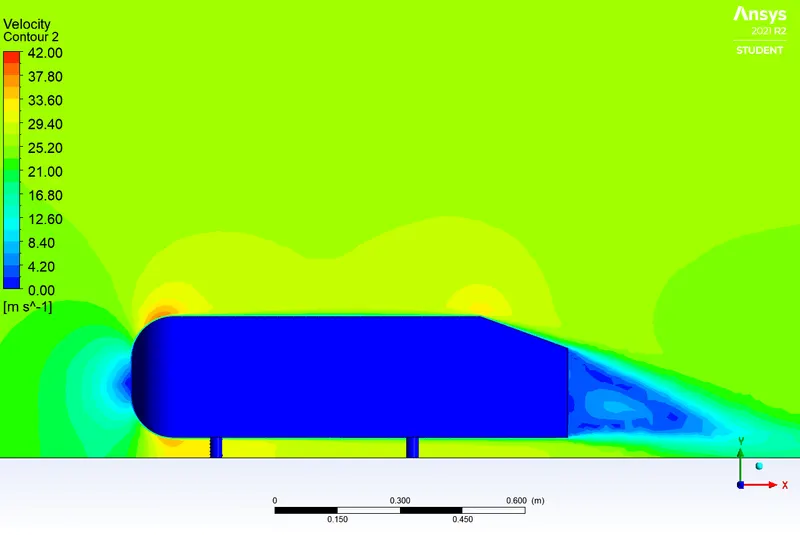
Velocity Contour:
|
|||
|
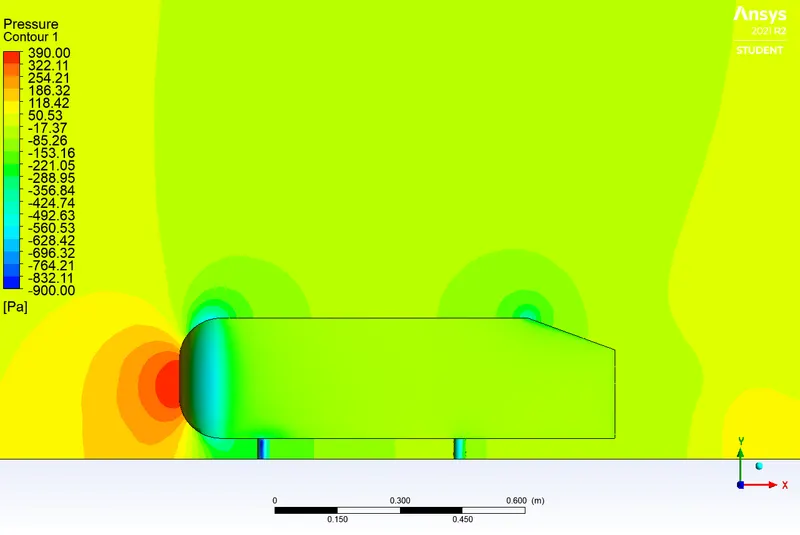
Pressure Contour:
|
|||
|
Coefficient of Drag:
|
|||
|
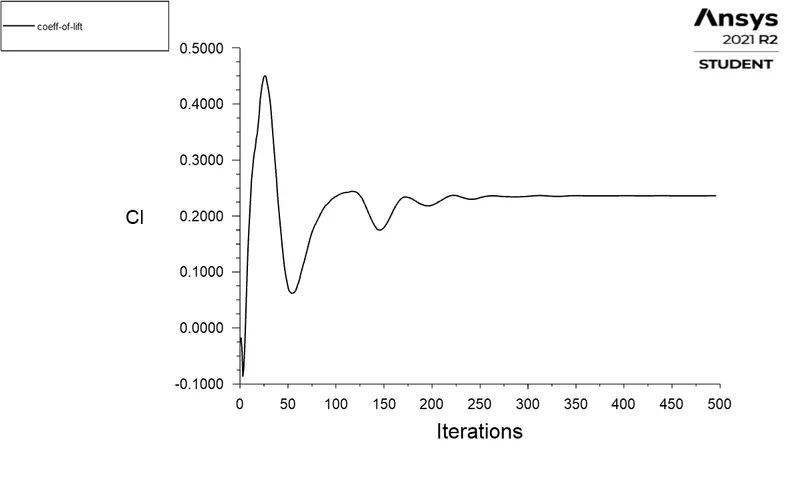
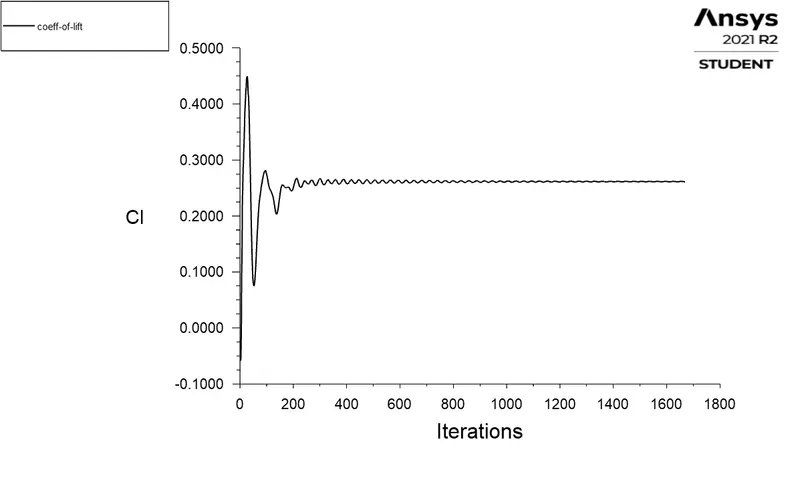
Coefficient of Lift:
|
|||
|
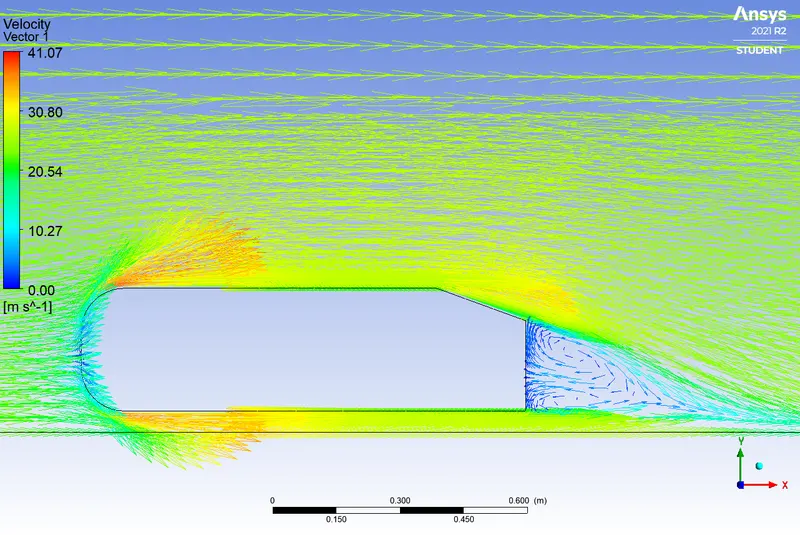
Velocity Vector Plot:
|
|||
|
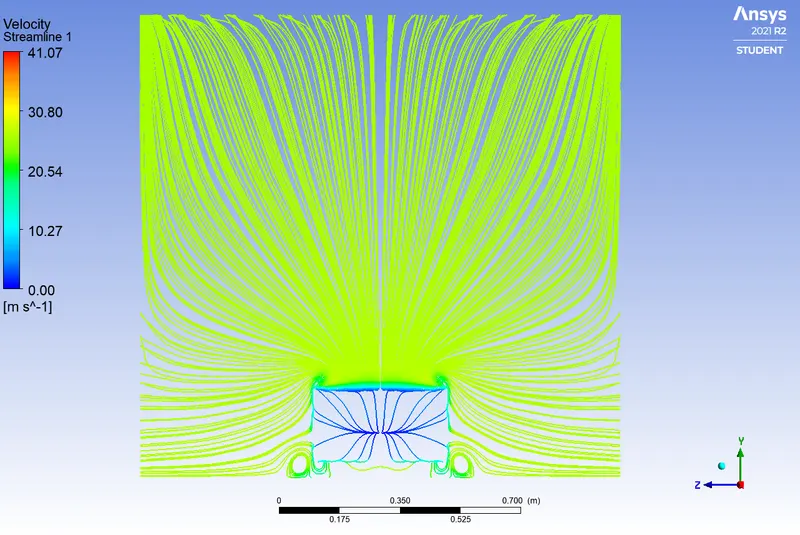
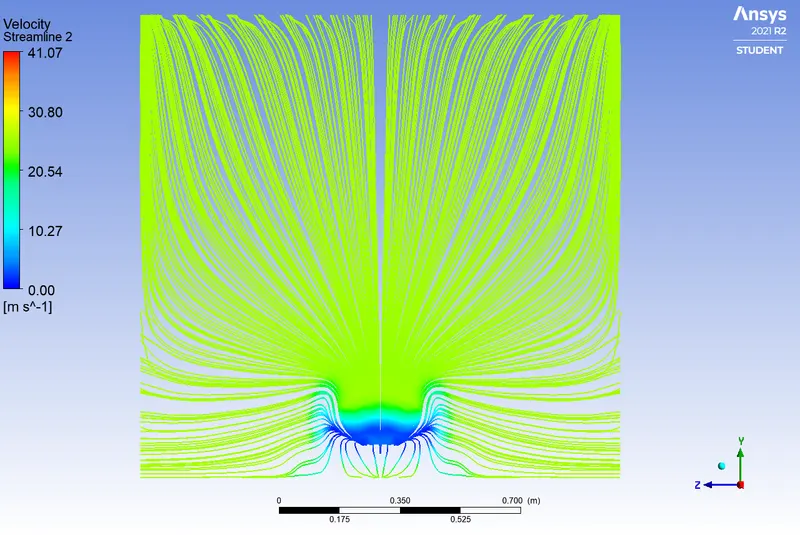
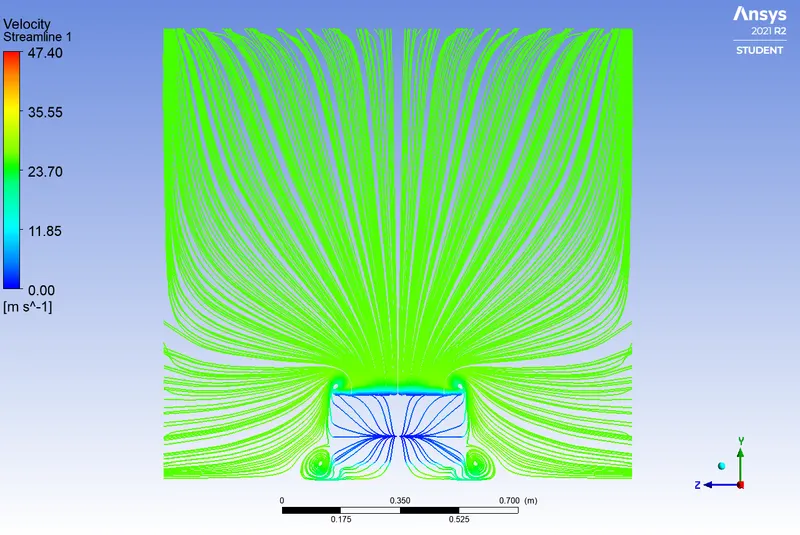
Velocity Streamlines in the YZ plane at x=1.05 & x =1.15:
|
|||
|
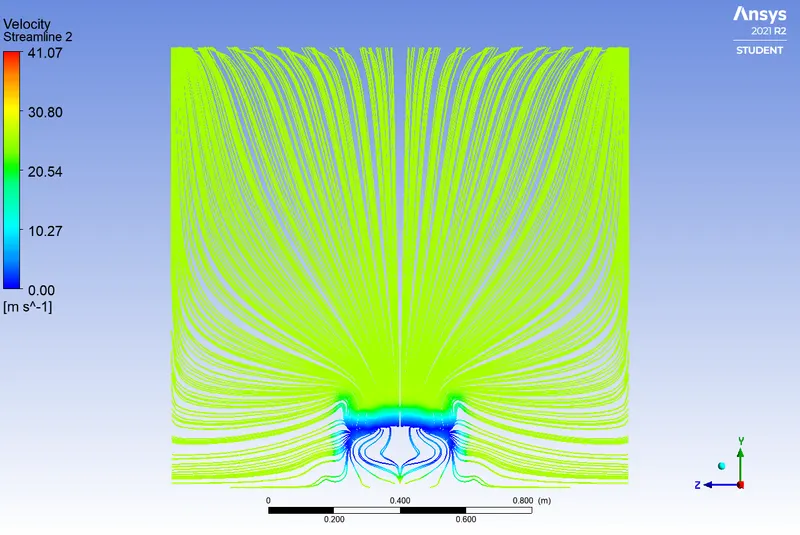
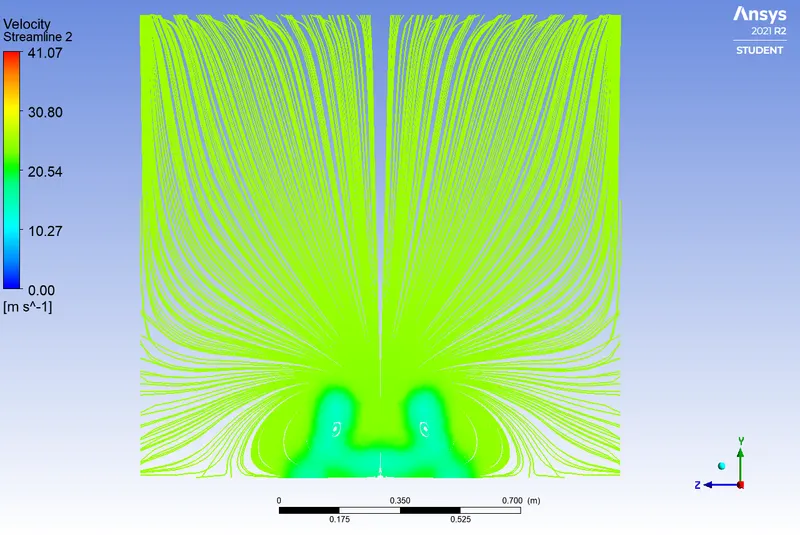
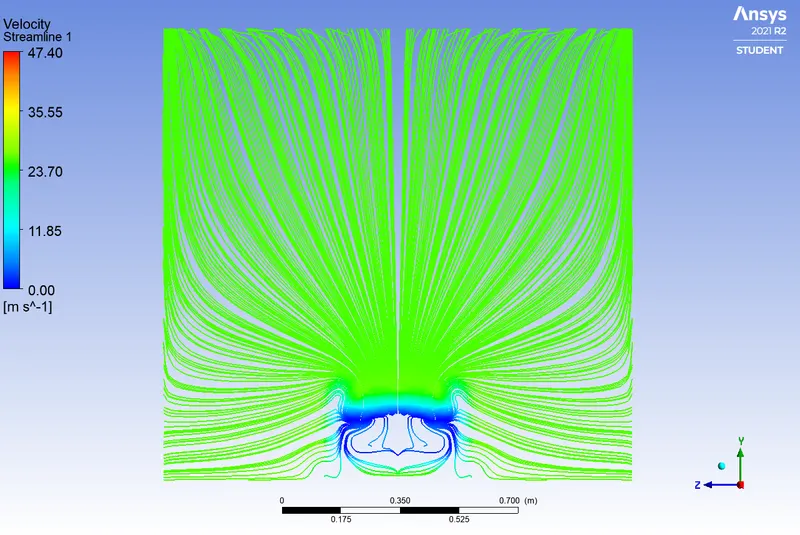
Velocity Streamlines in the YZ plane at x=1.25 & x =1.55:
|
|||
|
Chart:Velocity Profiles at different locations on x axis(Longitudinal axis)
|
|||
Case II:
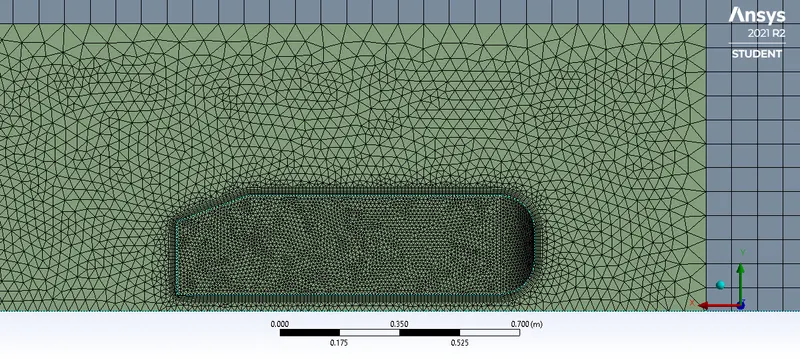
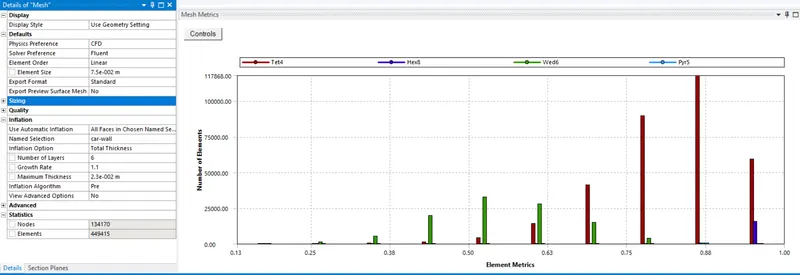
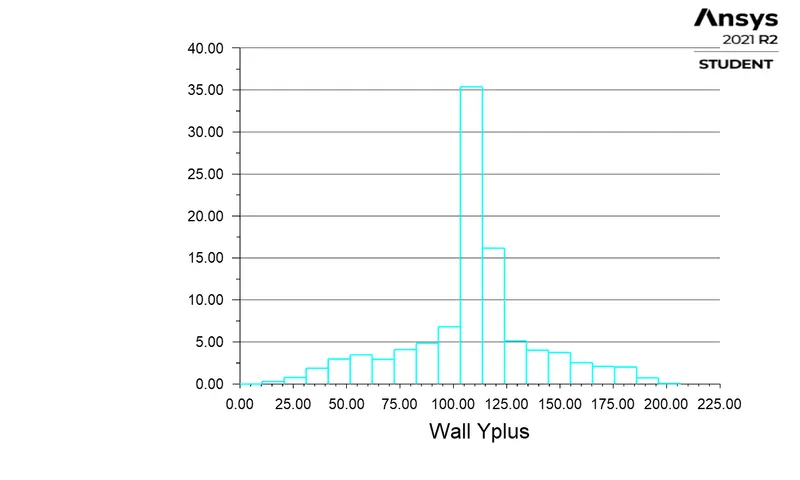
| Mesh: Outer Enclosure Multizone Hexahedral Mesh - 0.075 m max size; Inner Enclosure tetrahedral dominant Mesh - 0.03 m min size; Ahmed Body Mesh - with face sizing of 0.01 m min; Inflation Layers - 6 layers with growth rate 1.1 and Total thickness of 0.0023 m; Expected y-plus = 115. |
||
 |
||
|
Mesh Metrics:
|
||
|
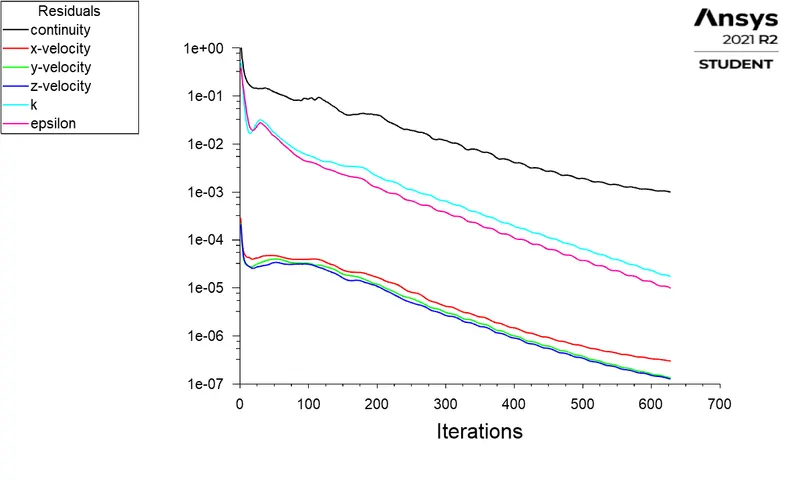
Residuals Plot:
|
||
|
Yplus Histogram For Ahmed Body:
|
||
|
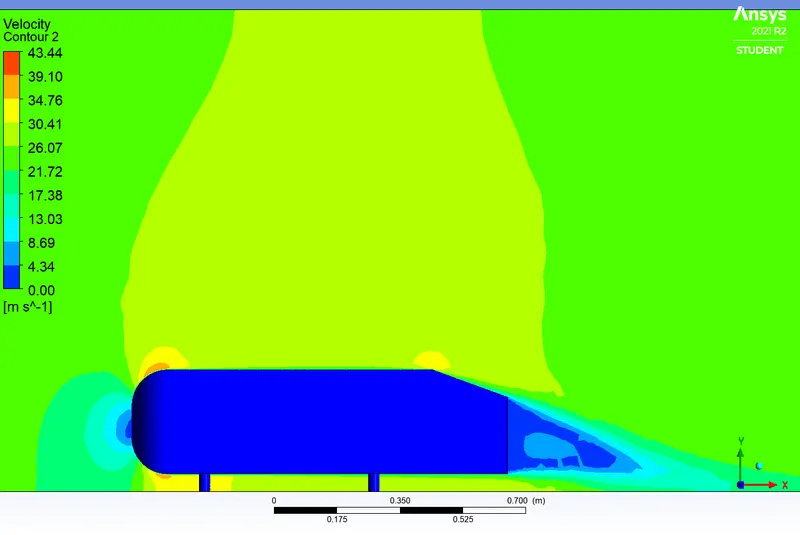
Velocity Contour:
|
||
|
Pressure Contour:
|
||
|
Coefficient of Drag:
|
||
|
Coefficient of Lift:
|
||
|
Velocity Vector Plot:
|
||
|
Velocity Streamlines in the YZ plane at x=1.05 & x =1.15:
|
||
|
Velocity Streamlines in the YZ plane at x=1.25 & x =1.55:
|
||
|
Chart:Velocity Profiles at different locations on x axis(Longitudinal axis)
|
||
Case III:
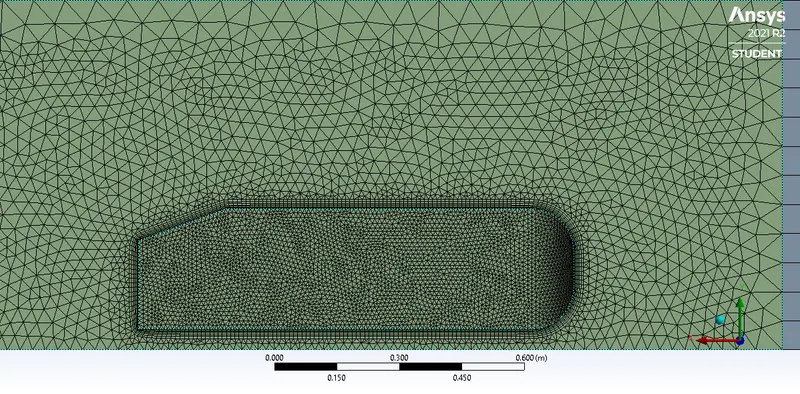
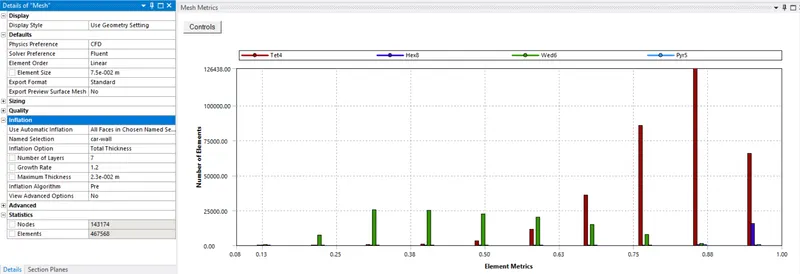
| Mesh: Outer Enclosure Multizone Hexahedral Mesh - 0.075 m max size; Inner Enclosure tetrahedral dominant Mesh - 0.03 m min size; Ahmed Body Mesh - with face sizing of 0.01 m min; Inflation Layers - 7 layers with growth rate 1.2 and Total thickness of 0.0023 m; Expected y-plus = 60. |
||
 |
||
|
Mesh Metrics: |
||
|
Residuals Plot:
|
||
|
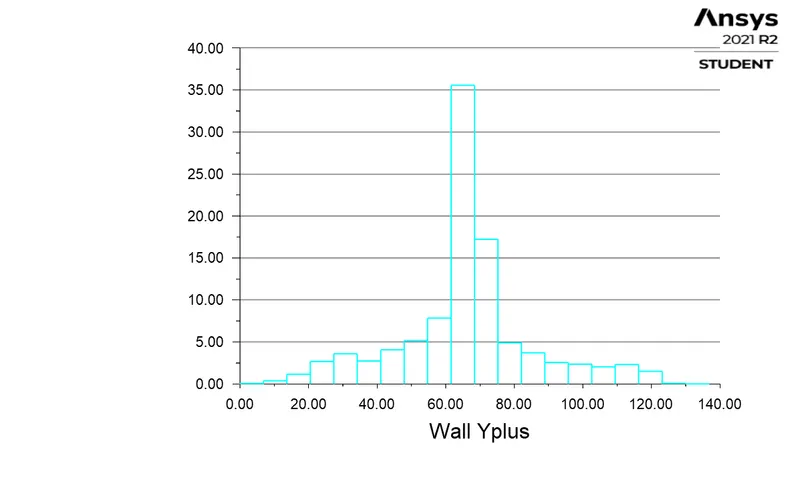
Yplus Histogram For Ahmed Body:
|
||
|
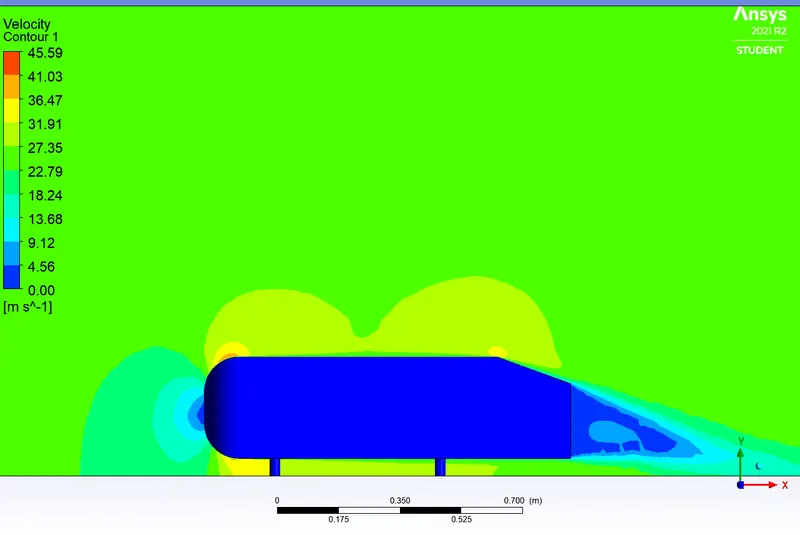
Velocity Contour: |
||
|
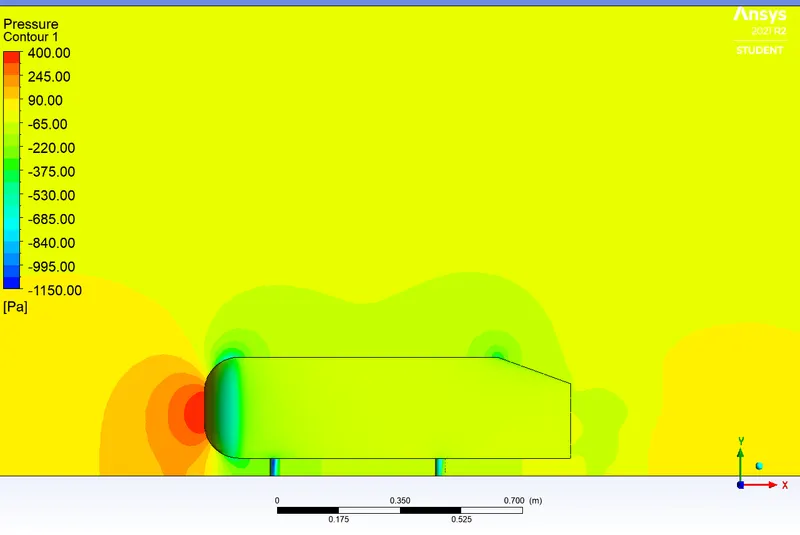
Pressure Contour: |
||
|
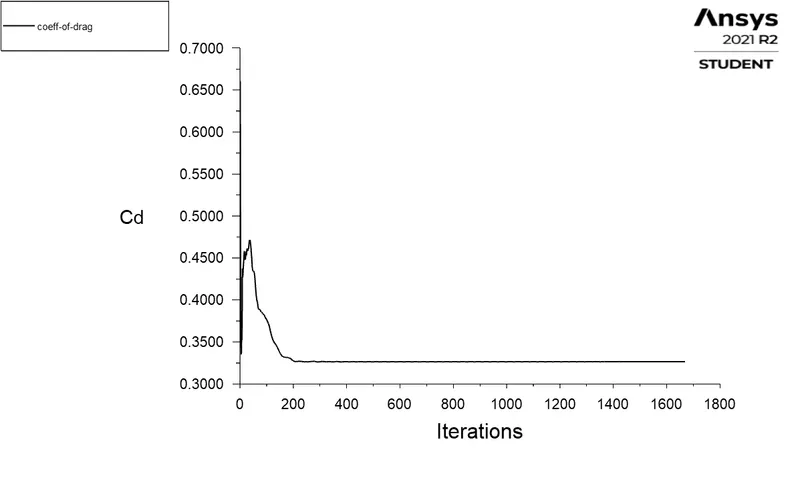
Coefficient of Drag: |
||
|
Coefficient of Lift: |
||
|
Velocity Vector Plot: |
||
|
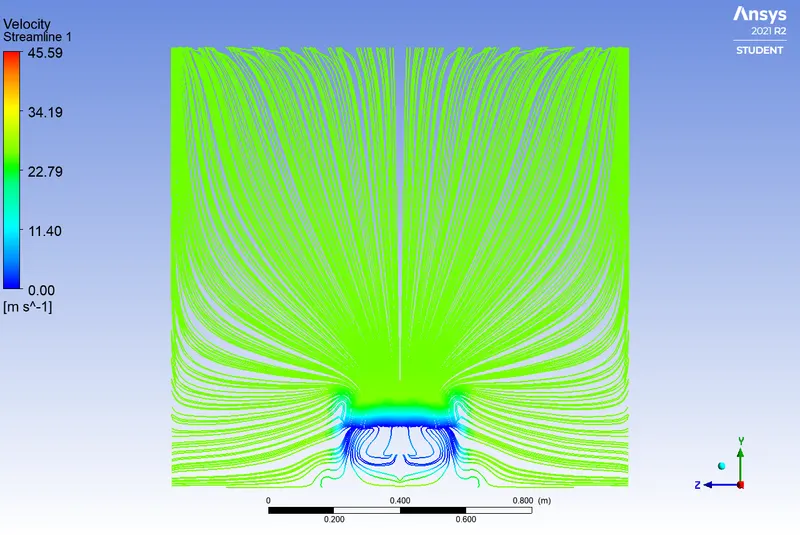
Velocity Streamlines in the YZ plane at x=1.05 & x =1.15:
|
||
|
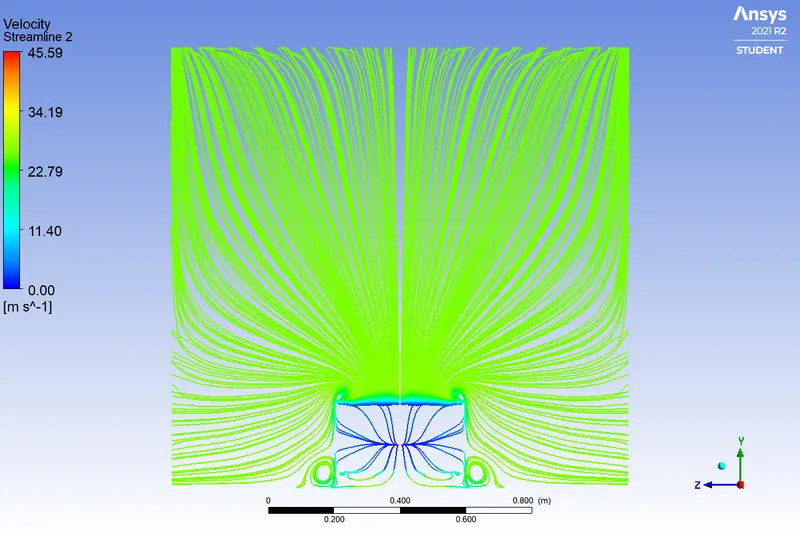
Velocity Streamlines in the YZ plane at x=1.25 &x =1.55:
|
||
|
Chart:Velocity Profiles at different locations on x axis(Longitudinal axis) |
||
Case IV:
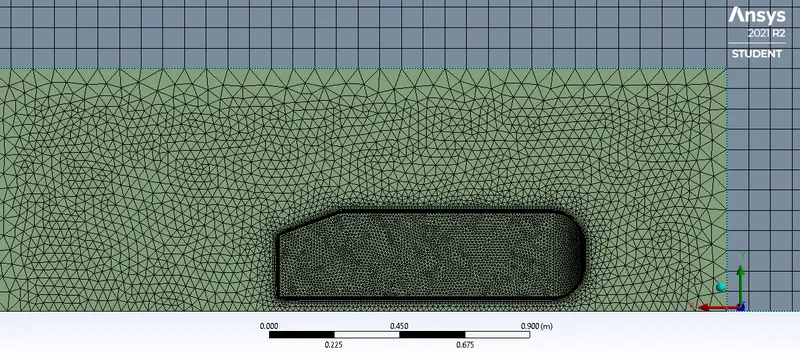
| Mesh: Outer Enclosure Multizone Hexahedral Mesh - 0.075 m max size; Inner Enclosure tetrahedral dominant Mesh - 0.031 m min size; Ahmed Body Mesh - with face sizing of 0.01 m min; Inflation Layers - 10 layers with growth rate 1.2 and Total thickness of 0.0023 m; Expected y-plus = 31. |
||
 |
||
|
Mesh Metrics: |
||
|
Residuals Plot: |
||
|
Yplus Histogram For Ahmed Body: |
||
|
Velocity Contour: |
||
|
Pressure Contour: |
||
|
Coefficient of Drag: |
||
|
Coefficient of Lift: |
||
|
Velocity Vector Plot: |
||
|
Velocity Streamlines in the YZ plane at x=1.05 & x =1.15:
|
||
|
Velocity Streamlines in the YZ plane at x=1.25 & x =1.55:
|
||
|
Chart:Velocity Profiles in at different locations on x axis(Longitudinal axis) |
||
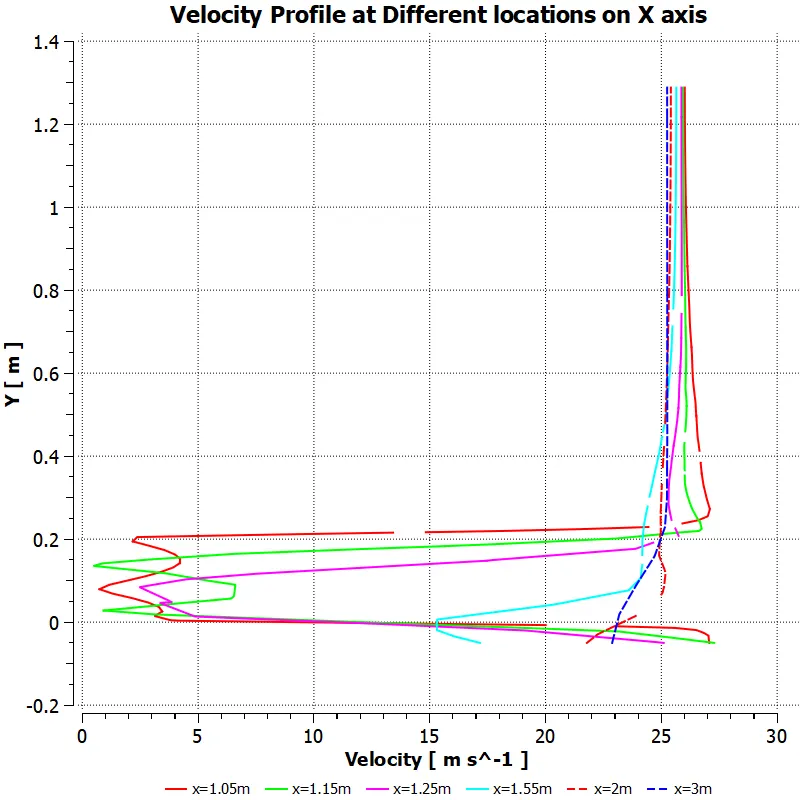
Mesh Independence study:
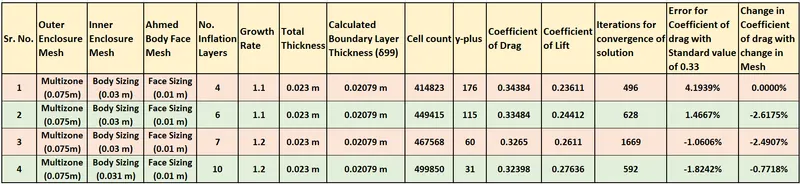
Observation table:
Plot : Coefficient of Drag Vs Mesh cell count
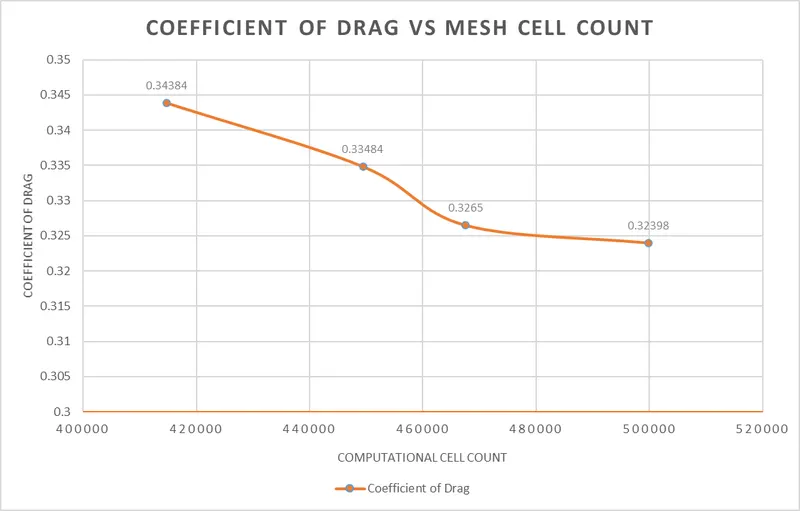
Observations and Conclusions:
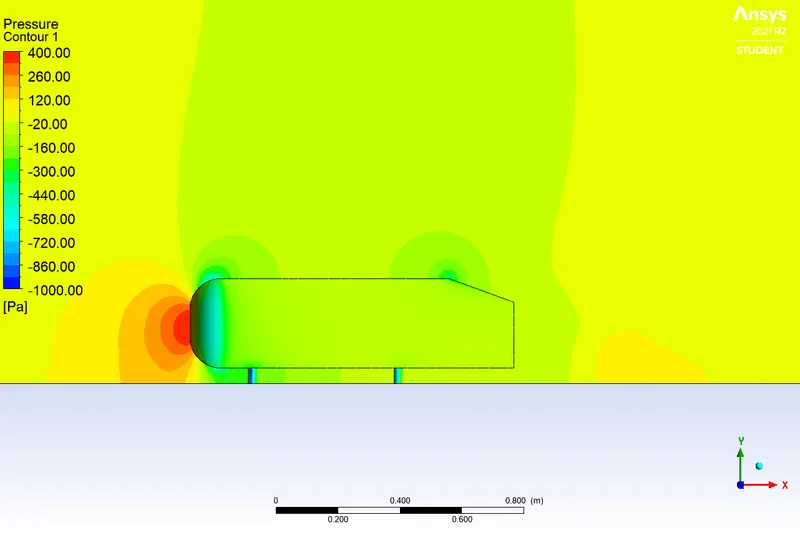
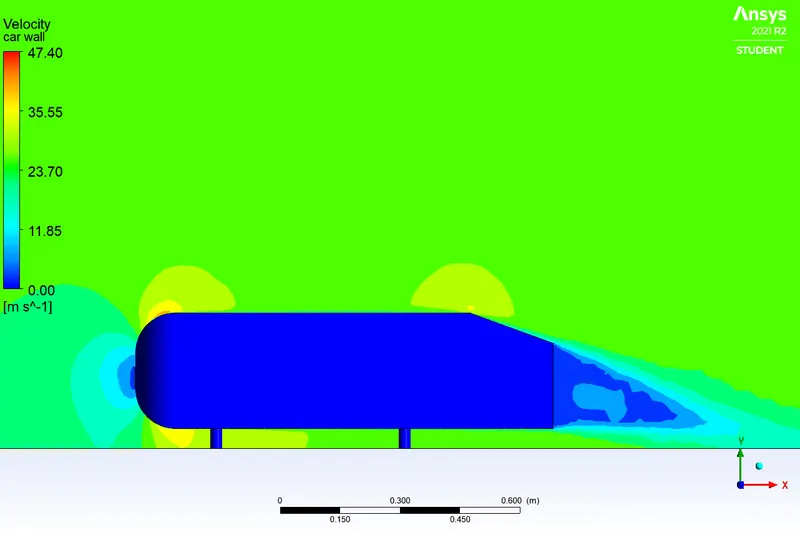
- Pressure & Velocity contours show the stagnation point at the leading face of the Ahmed body where the high pressure and low velocity zone is observed while after the trailing edge of the Ahmed body the low pressure low velocity zone is observed which is the main reason for wake formation.
- Vector plot in the centre plane, around the Ahmed body clearly shows the two different wakes formed behind the Ahmed Body.
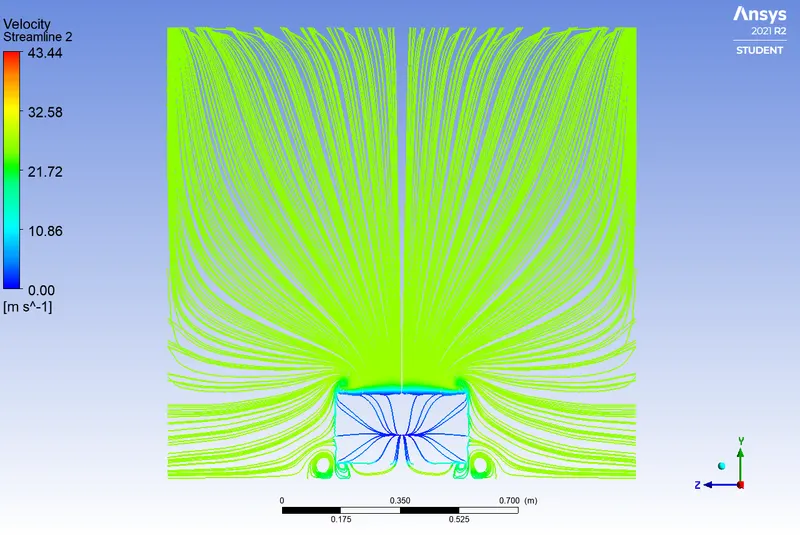
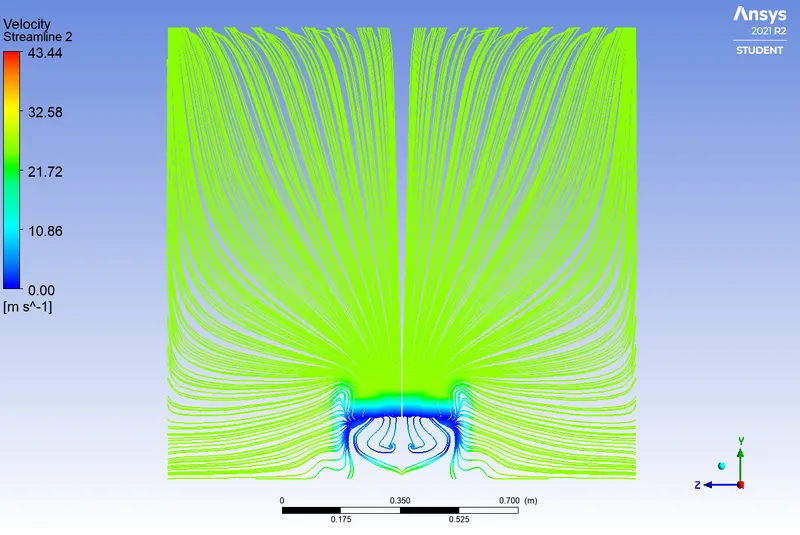
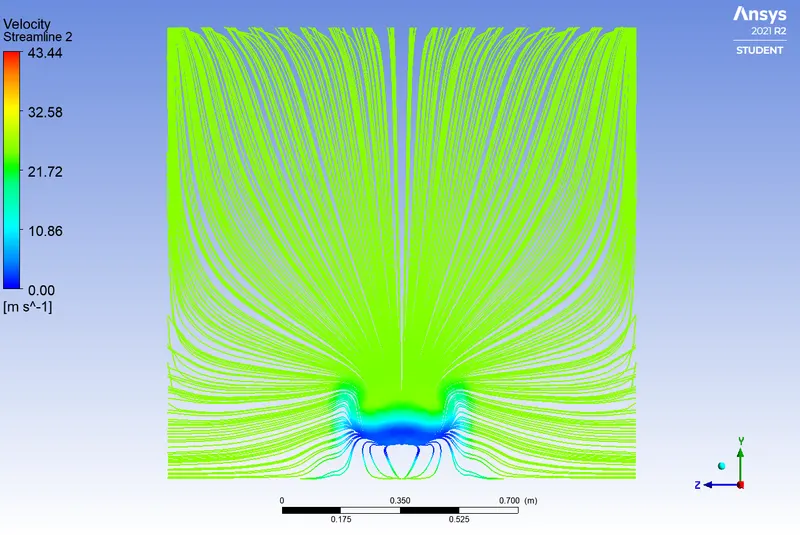
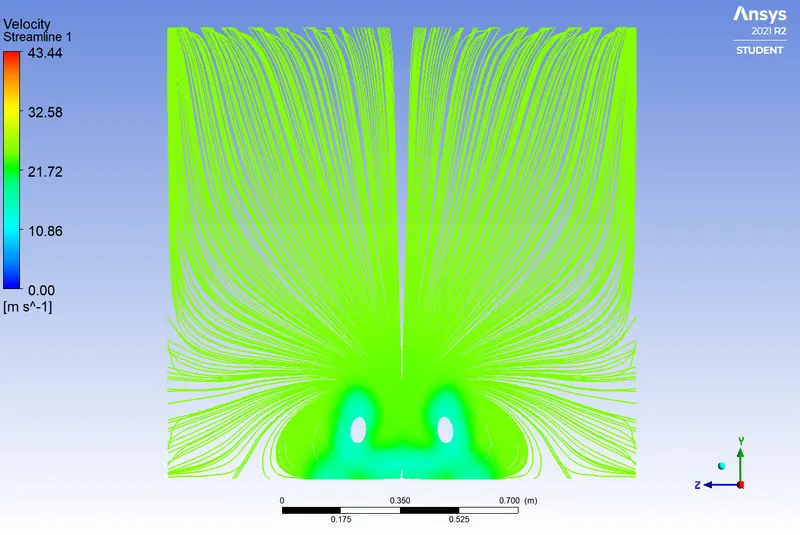
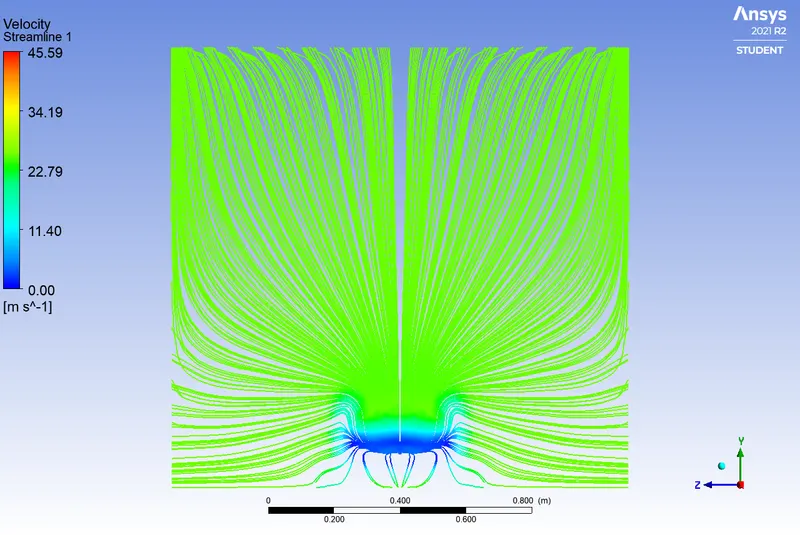
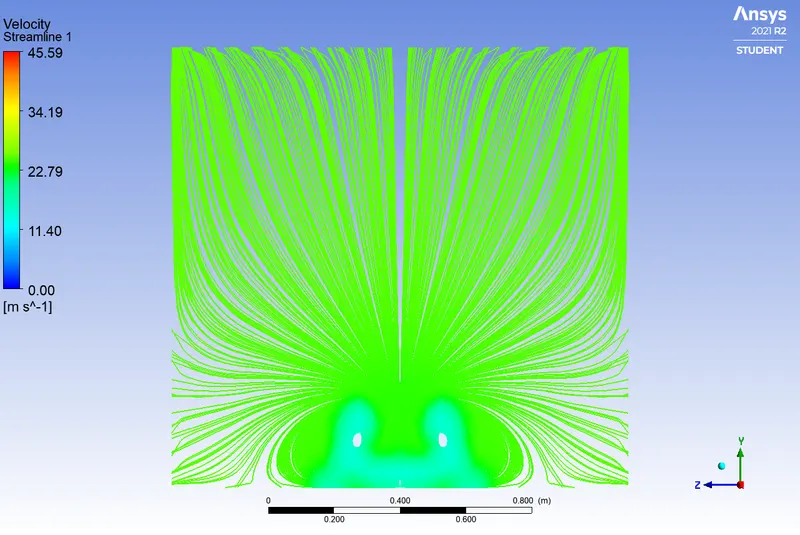
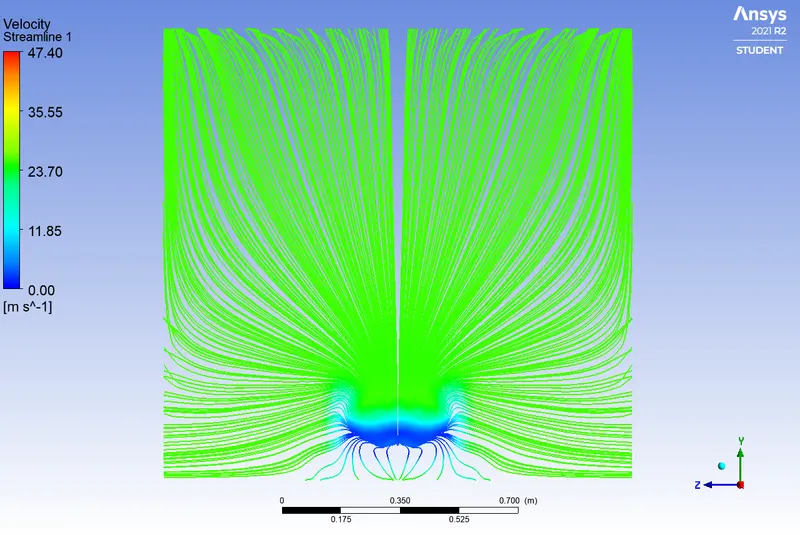
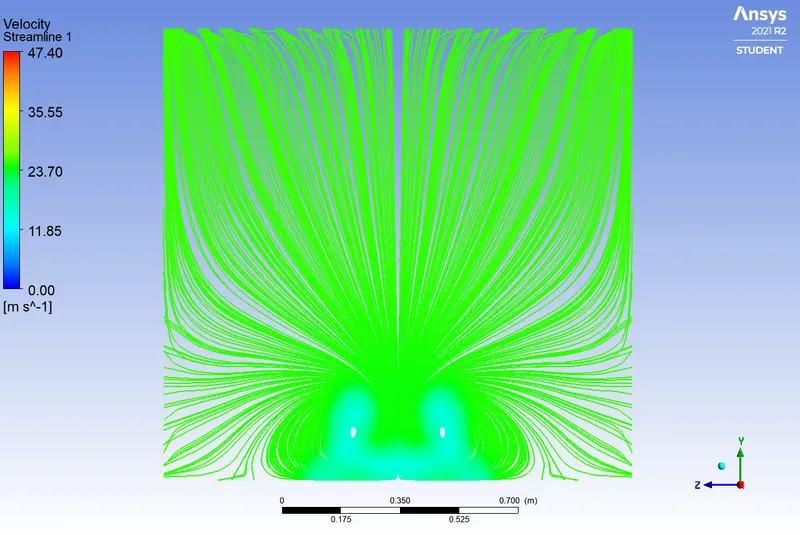
- Streamline Plots in sectional planes along various locations along the x axis, show the formation of wakes above and below-sideways the Ahmed body.
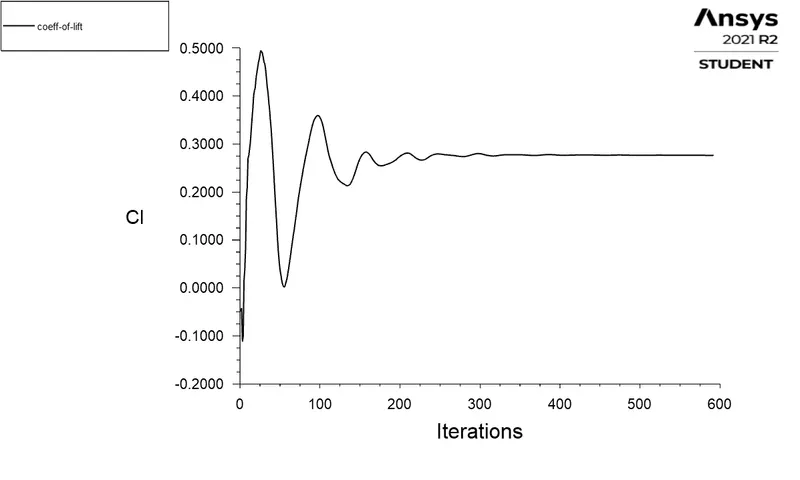
- Change in the values of coefficient of drag with increasing number of cell count is less than 3% for each step shows that the results are mesh independent.
- Also the trend of percentage change of the value of coefficient of drag with the standard value of 0.33 shows the decline from the 4.2 % to 1% which also indicates the grid independence.
- Hence the flow over the Ahmed Body (with `V = 25 m/s` & Slant angle of `20^@`) is simulated and results are found to be inline with the results of wind tunnel results for different slant angles and velocities from the literature.