Week-3 Challenge: ADVISOR Tool
Answer:
The ADVISOR tool is launched using MATLAB.
1)
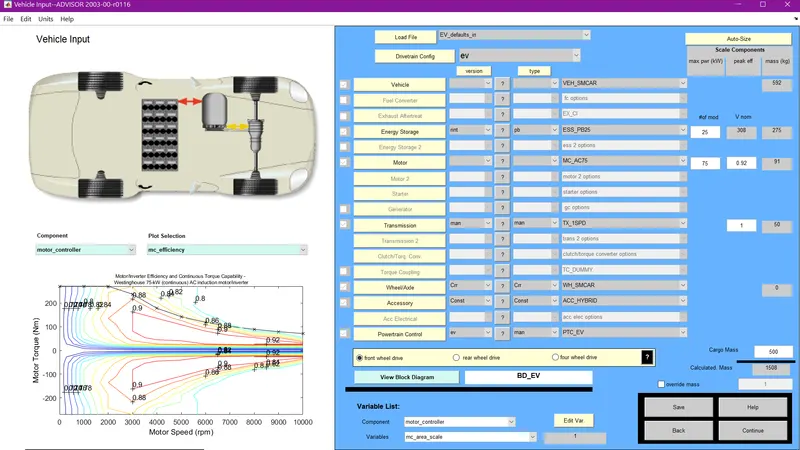
The EV_defaults_in is launched with cargo mass set to 500 kgs with all other default conditions.
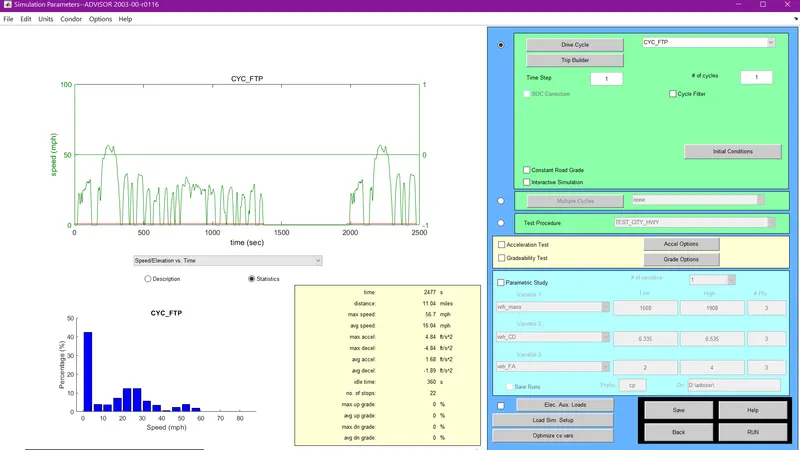
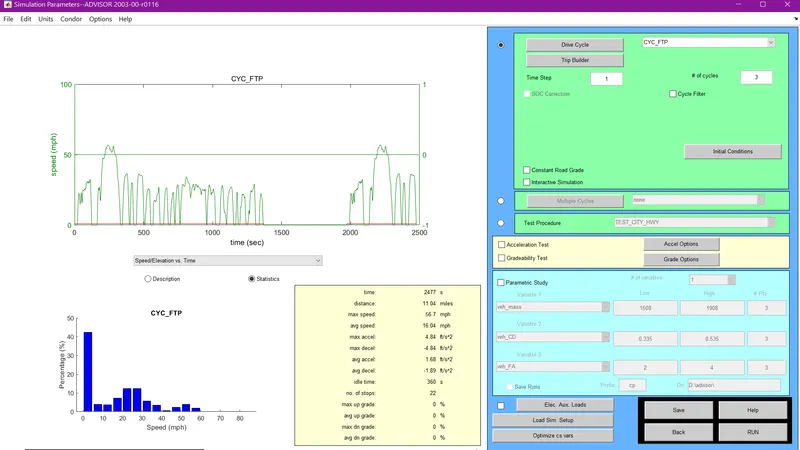
The FTP drive cycle is used to run the simulation and the no. of cycles is set to be 1.
The simulation is run and the result is shown below,
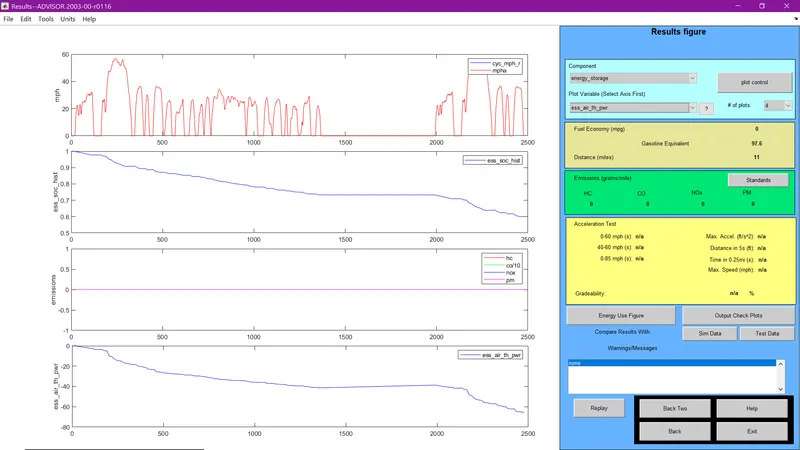
It is seen that the vehicle covered a distance of 11 miles which is equivalent to 17.7 kilometers.
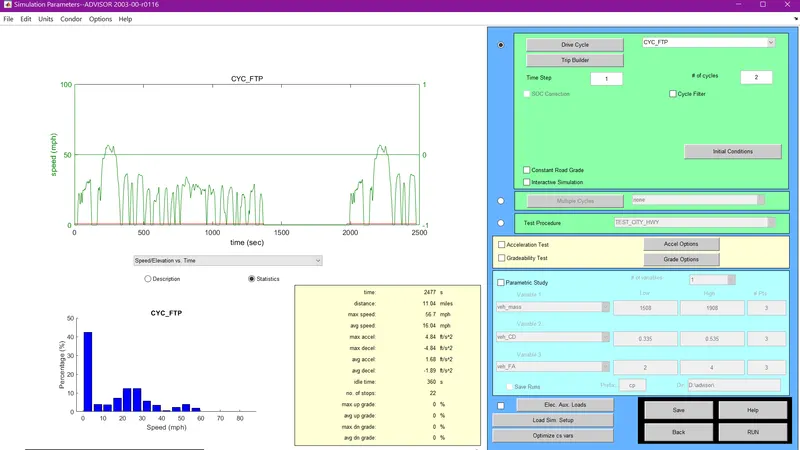
Now the no. of cycles is changed to 2.
The simulation is run and the result is shown below,
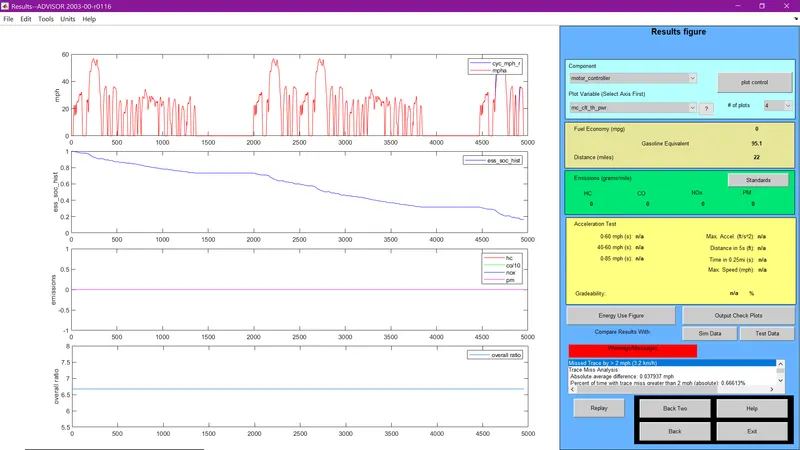
It is seen that the vehicle covered a distance of 22 miles which is equivalent to 35.4 kilometers.
Now the no. of cycles is changed to 3.
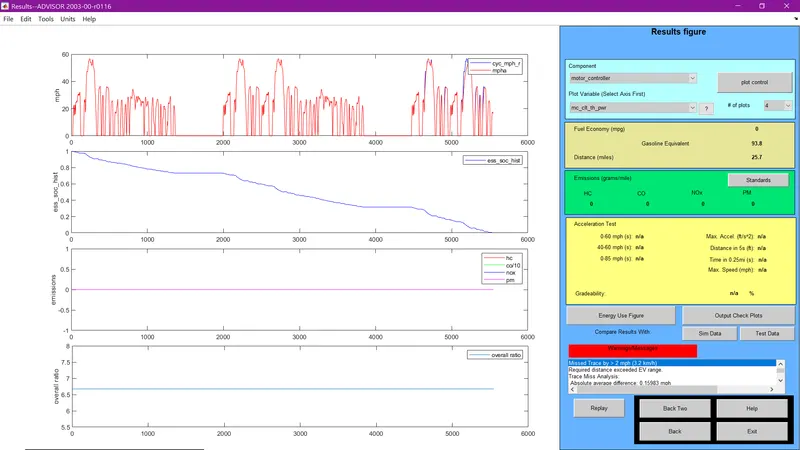
It is seen that the vehicle covered a distance of 25.7 miles which is equivalent to 41.3 kilometers.
As you can see the vehicle can travel for a near 45 km range with 3 or more drive cycles.
The FTP drive cycle seems to have more percentages for lower velocities.
2)
Now we change the battery capacity of the vehicle while keeping the rest of the conditions the same.
The battery capacity is changed to 26 modules from 25 modules.
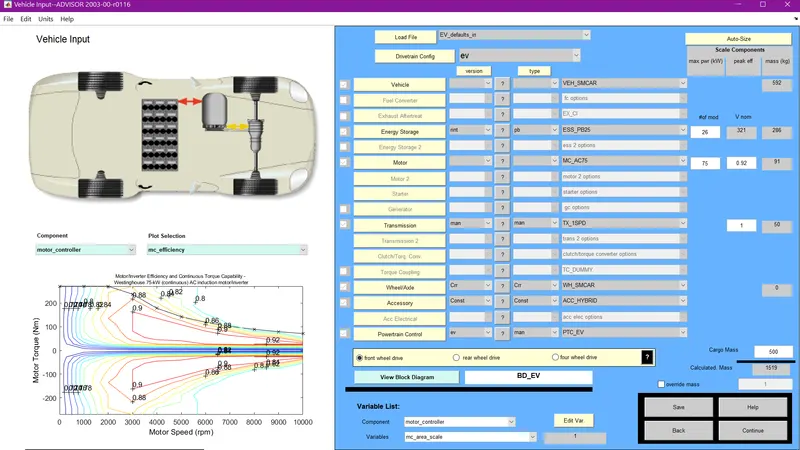
We selected the same FTP drive cycle and the no. of cycles to be 3.
Now the simulation is run and the result is shown below.
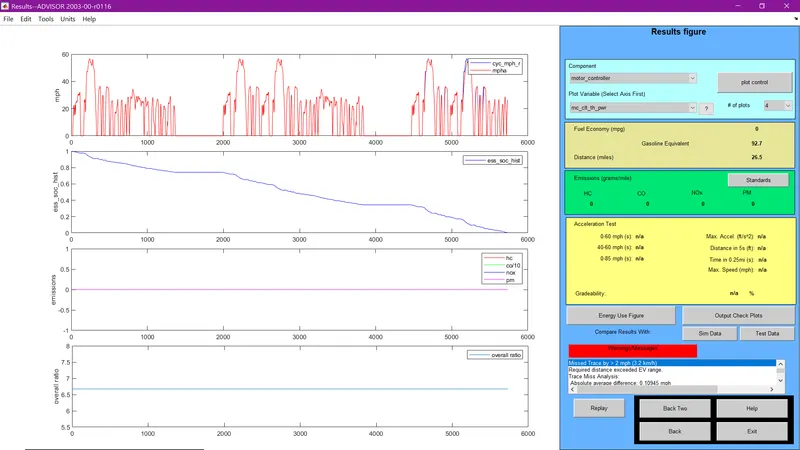
It is seen that the vehicle covered a distance of 26.5 miles which is equivalent to 42.6 kilometers.
Now the battery capacity is changed to 27 modules.
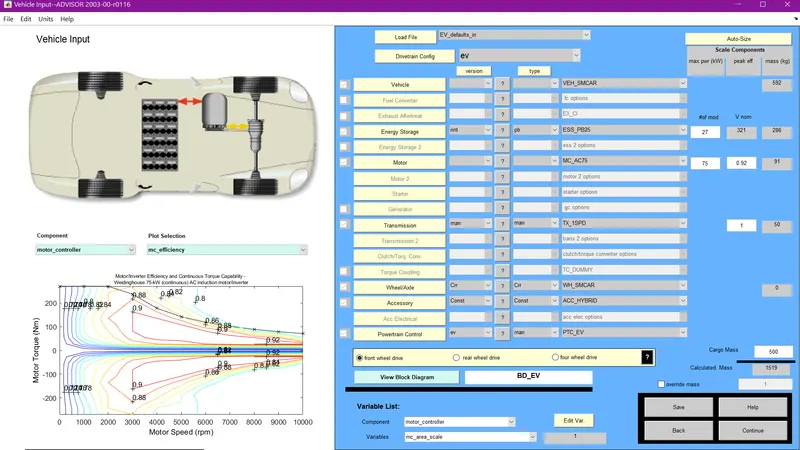
Now the simulation is run and the result is shown below.
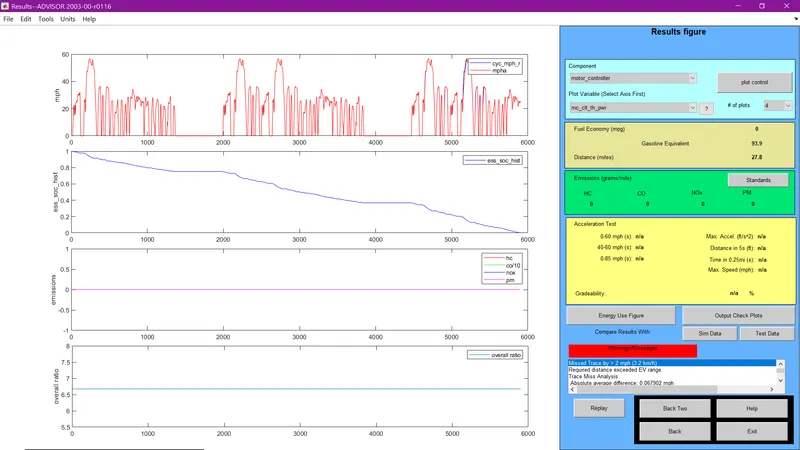
It is seen that the vehicle covered a distance of 27.8 miles which is equivalent to 44.7 kilometers.
The vehicle can travel for 45 km with the FTP drive cycle when the battery capacity is 27 modules and the no. of cycles is 3.
3)
The PRIUS_Jpn_defaults_in is loaded in the window.
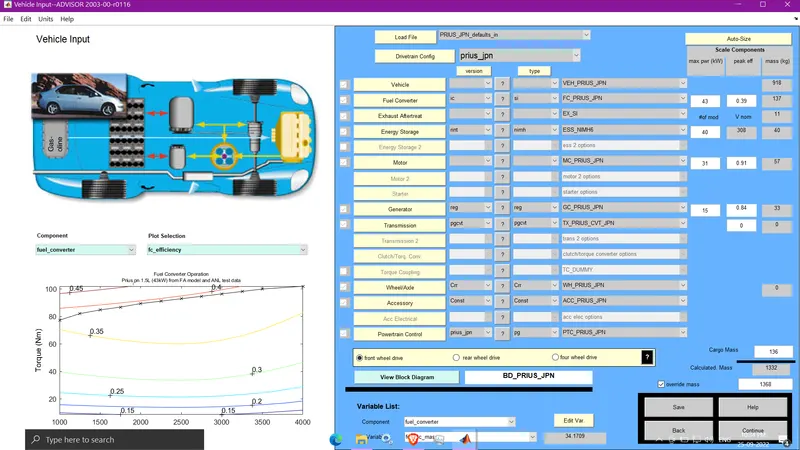
Now we check the Gradeability test box.
We can compare the gradeability test by either changing the speed or changing the duration.
We change the speed for comparison.
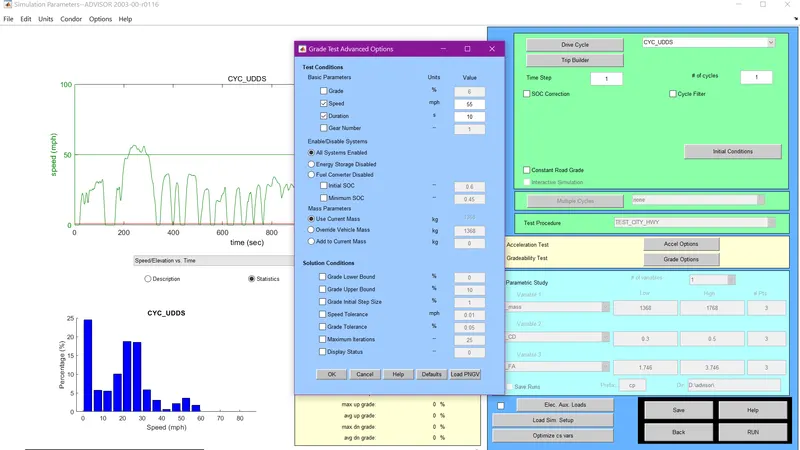
The speed is set to 55 mph and the simulation is run.
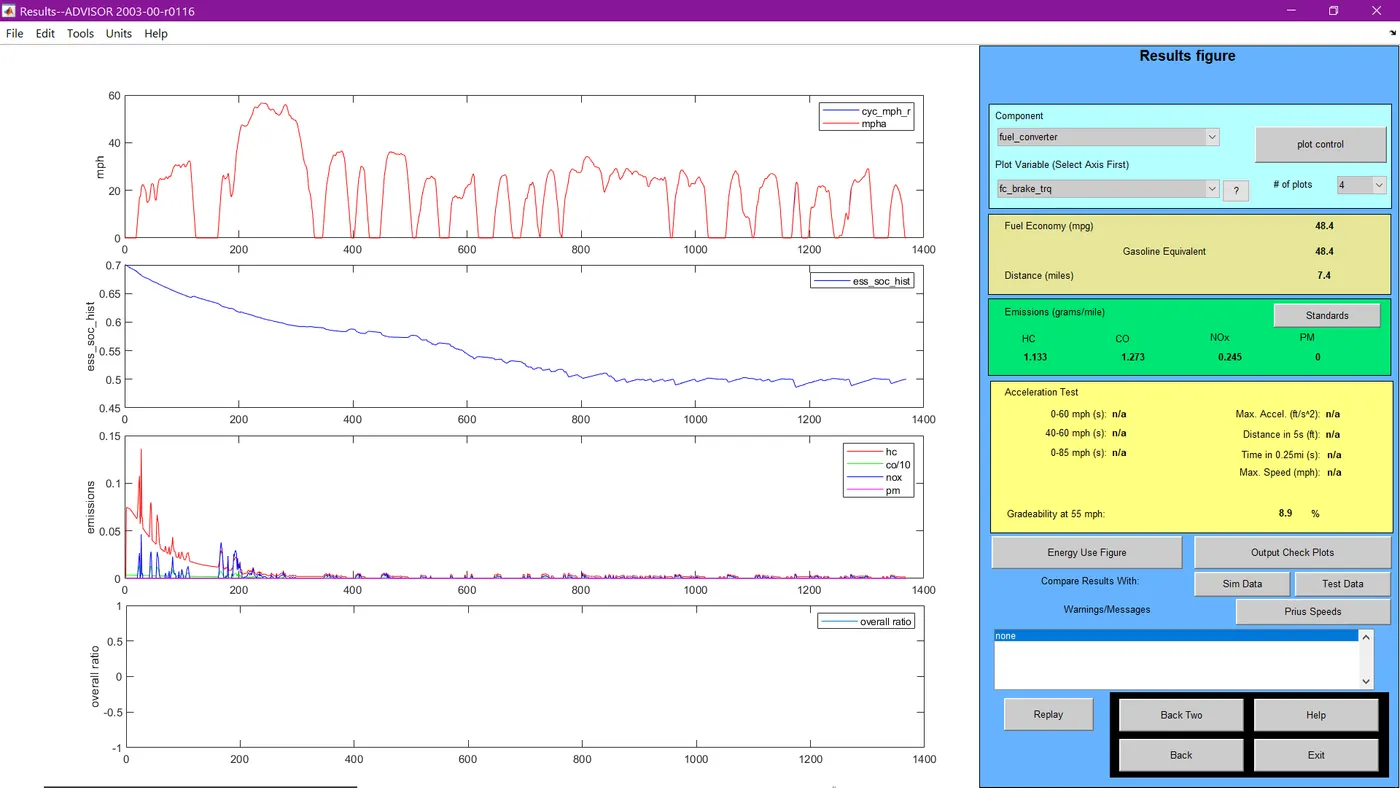
The gradeabilty has resulted as 8.9%.
Now, the speed is changed to 45 mph and the simulation is run.
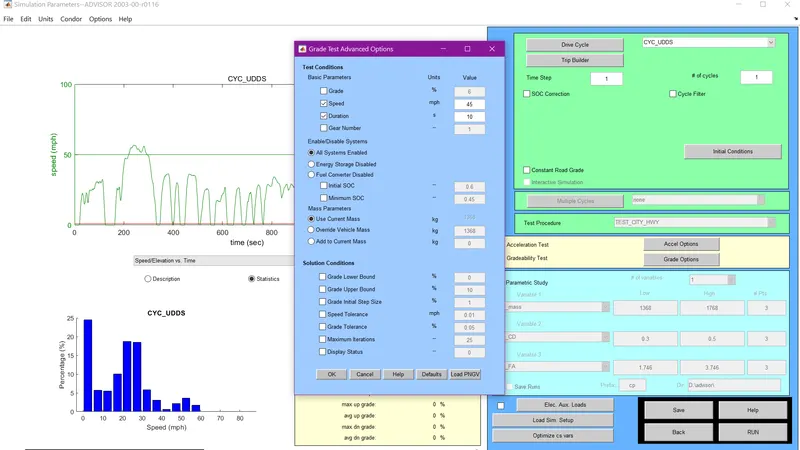
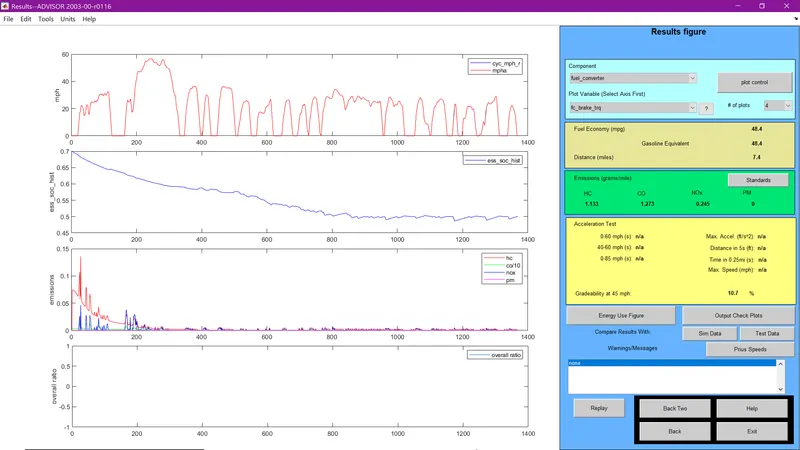
The gradeability has resulted in 10.7%.
Now, the speed is changed to 35 mph and the simulation is run.
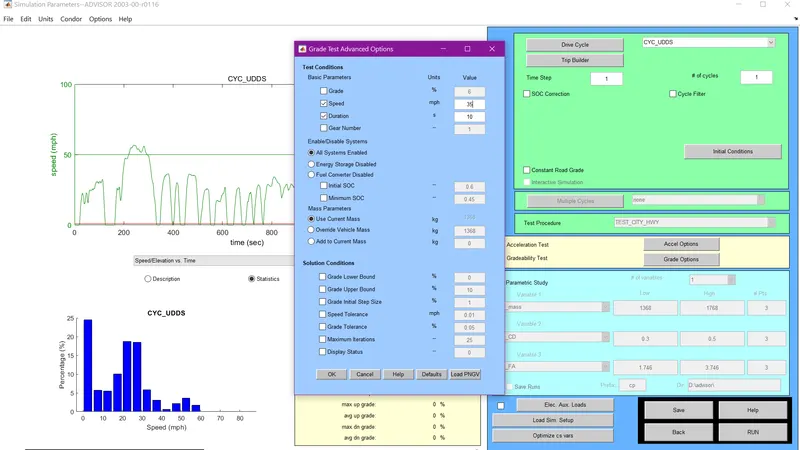
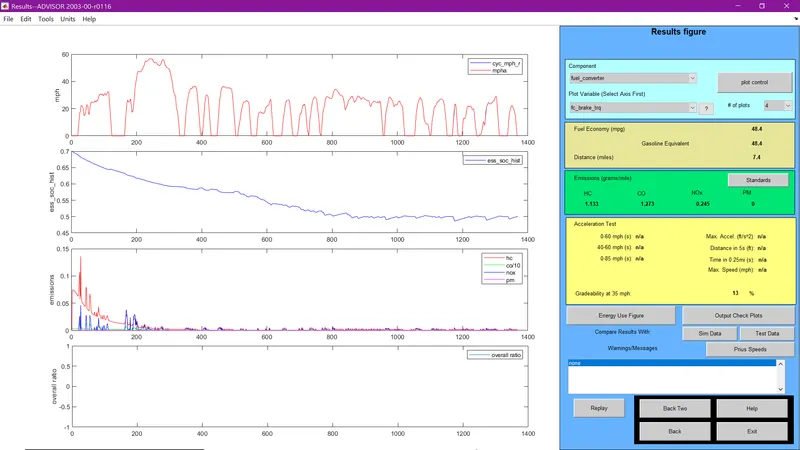
The gradeability has resulted in 13 %.
Duration(seconds) Speed(mph) Gradeability(%)
10 55 8.9
10 45 10.7
10 35 13
From these results, we can conclude that more the speed of the vehicle, the less the gradeability of the vehicle.
And also more the duration of the vehicle, the more the gradeability of the vehicle.