Week-3 Challenge: ADVISOR Tool
Answers
Q1
Detail of ADVISOR Tool
- Advisor tool is advanced vehicle simulator.
- This software is use to simulate diffrent electric and hybrid electric vehicle.
- This is used to test diffrent driving cycle and it can also simulate most of the other test like gradability and acccleration test.
- It is also determine milage and range of electric vehicle on single charge.
In this question we discuss "EV_defaults_in" model and run the simulation for FTP drive cycle and analysis the result.
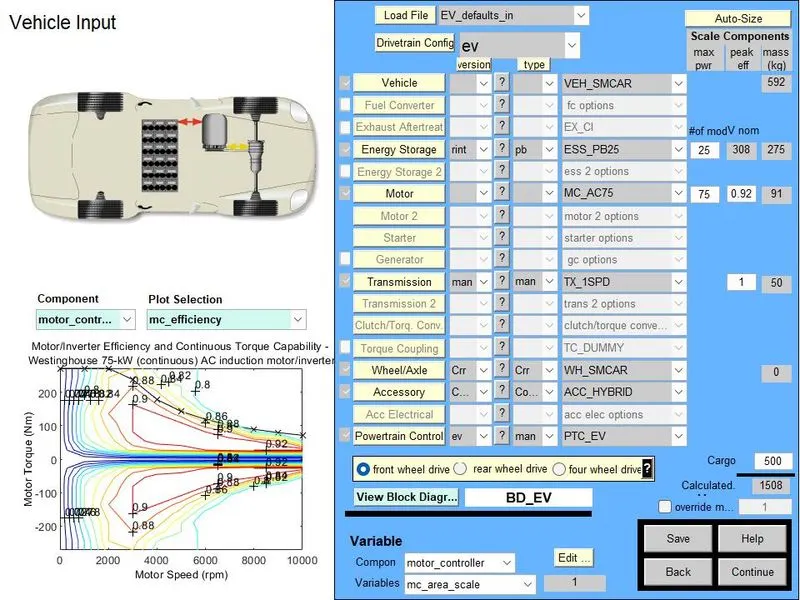
- In the fig shows all the defult parameter only change cargo weight to 500Kg
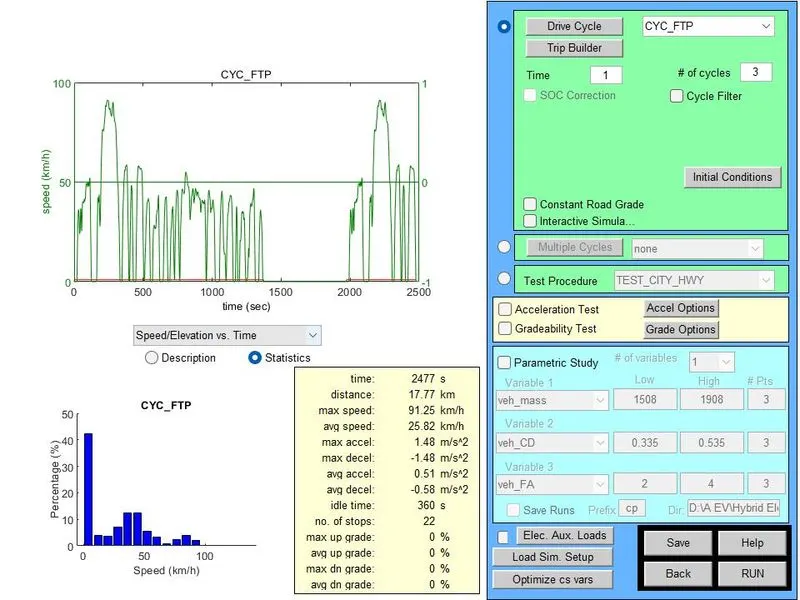
- This fig is shows that FTP drive cycle is coverd 17.77 km dostance for one complate cycle.
- For 45 km we reapeat this cycle for 3 times. which equal to 53.31 km.
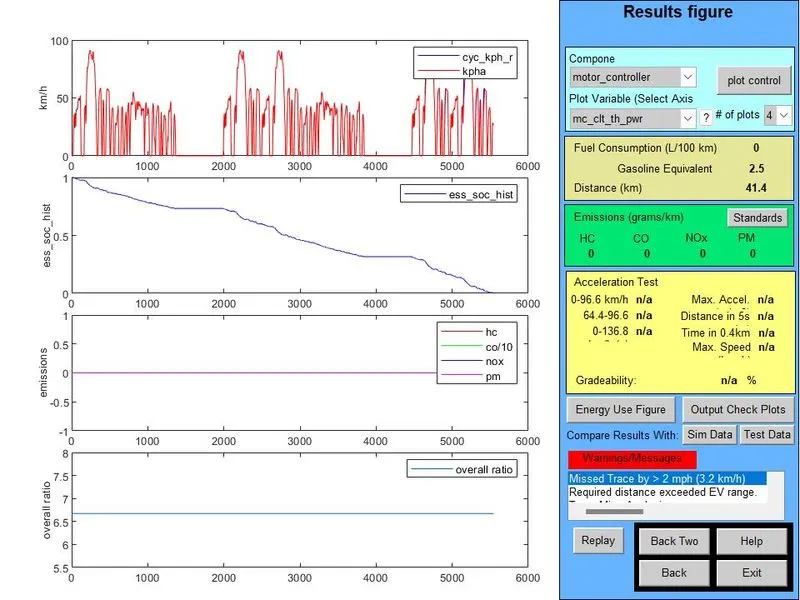
- In the results tab we shows that car distance cover is only 41.4 km and it not run 45 km for 500 kg cargo weight with ftp drive cycle.
Q2
- Reapeat the simulation with changing battery capacity with all other condition same.
- In this condition we change the number of battery module from 25 to 30 and again run the simulation.
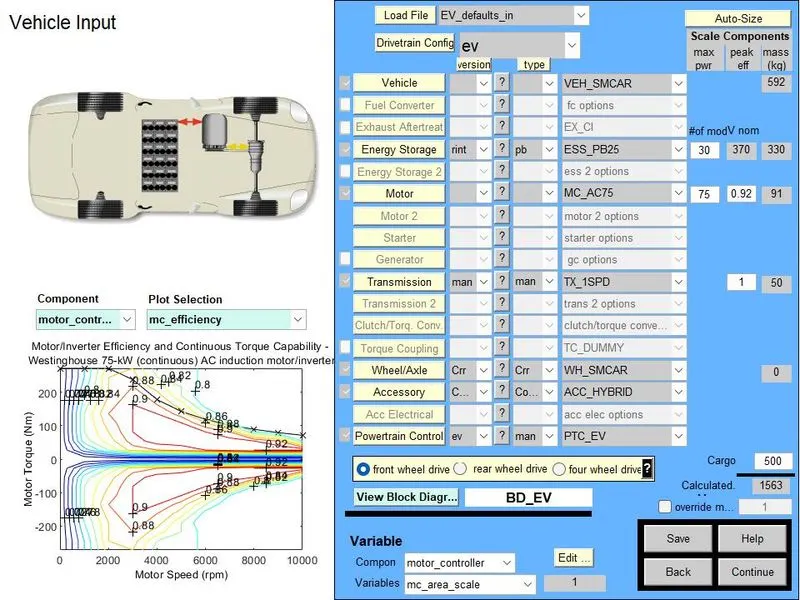
- As shown in the fig we increase number of battery module so battery nominal voltage is change to 370 and we can say battery capacity is increased.
- After increasing battery capcity again run the simulator with all other parameter.
- As the shown in fig we run FTP cycle for 3 times to achive 45 km distance
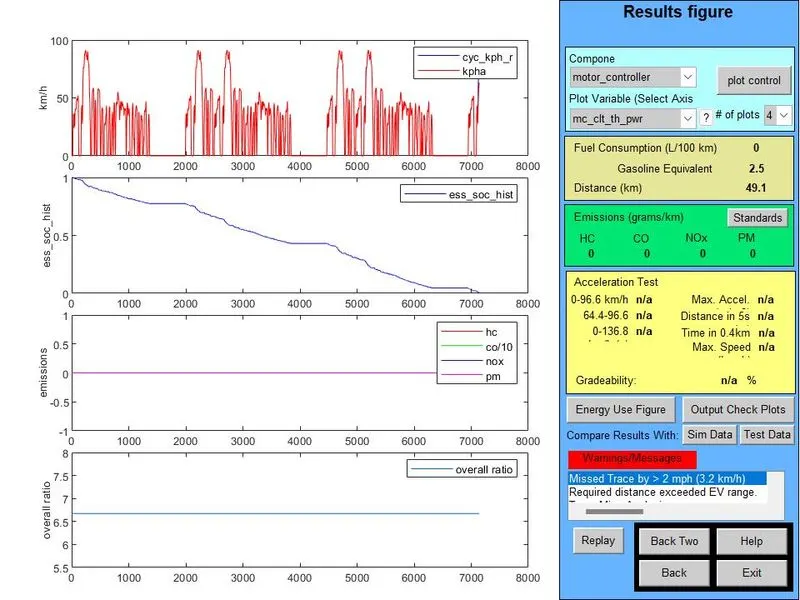
- As shown in the results window vehicle can achive 49.1 km distance with increased battery capacity with 500kg cargo weight with all other parameter default.
Conclusion
- After simulating this model we can conclude that if we use 30 module of battery insted of 25 module we can achive beyond 45 km distance with 500kg cargo weight.
Q3
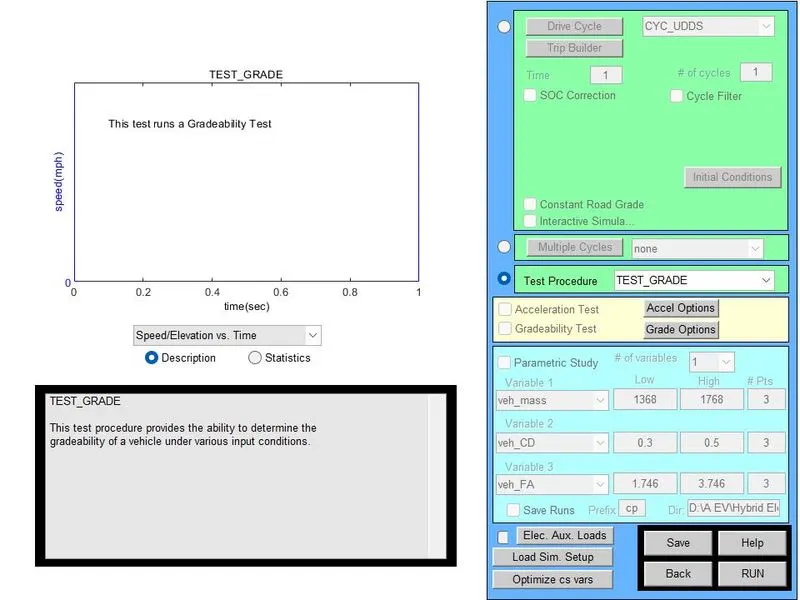
- For determine gradebility we use TEST_GRADE in Test procedure mode.
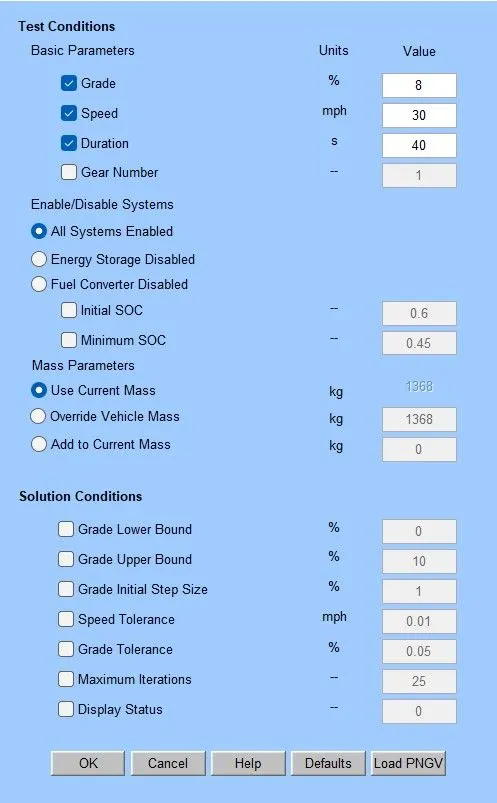
- After applying this setting we change data in grad option and perform gradability test.
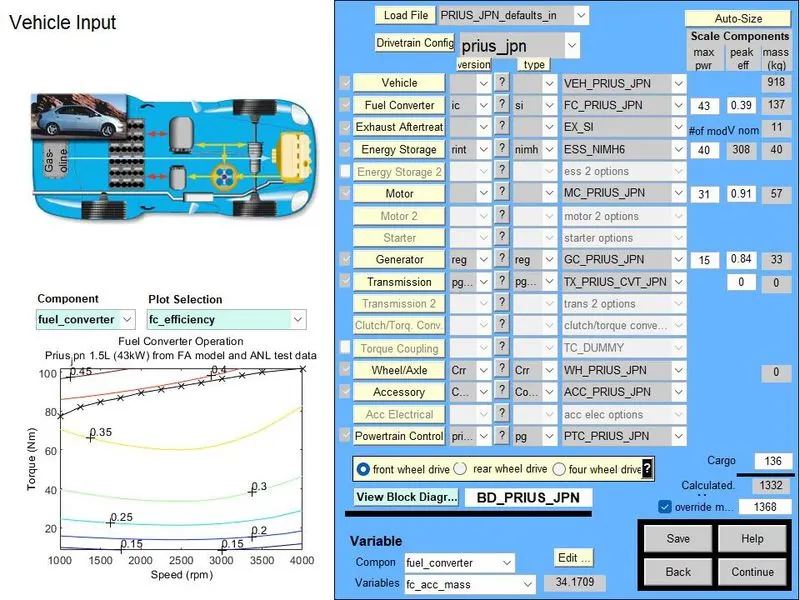
Default parameter of Toyota Prius
Gradability test procedure
Grade option menu where we change Value of grade, Vehicle speed and Duration
Result window of gradability test
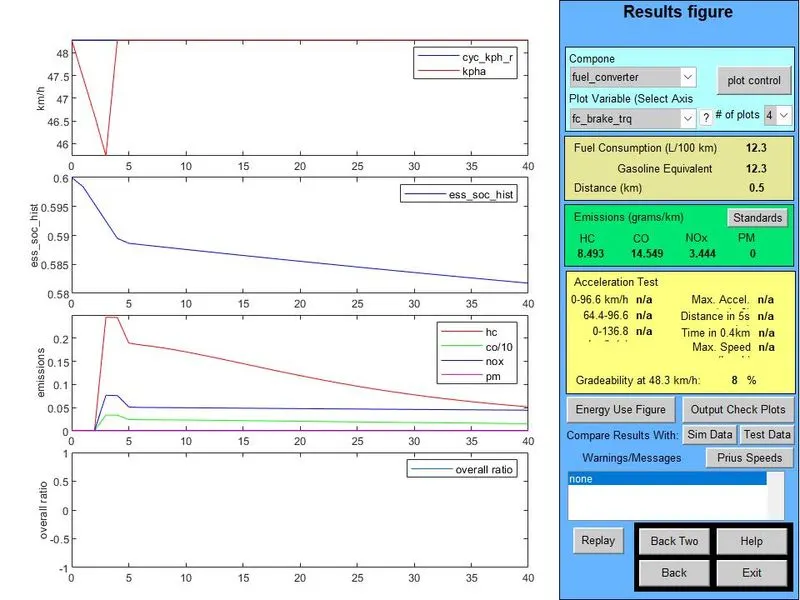
This procedure is reapeated several times with speedchange to get proper gradability test.
This test data is showd in given table.
| Sr. No. | Grade Value in (%) | Vehicle Speed (mi/h) | Duration in (s) | Gradability in (%) |
| 1 | 6 | 30 | 10 | 13.8 |
| 2 | 6 | 40 | 10 | 12.6 |
| 3 | 6 | 50 | 10 | 7.3 |
| 4 | 6 | 60 | 10 | 6.4 |
| 5 | 6 | 70 | 10 | 5 |
| 6 | 6 | 80 | 10 | 2.2 |
Conclusion
- After Complating this task we conclude that when vehicle speed with same grade value is increased gradability is decreased.