Week-3 Challenge: ADVISOR Tool
Answer to question 1
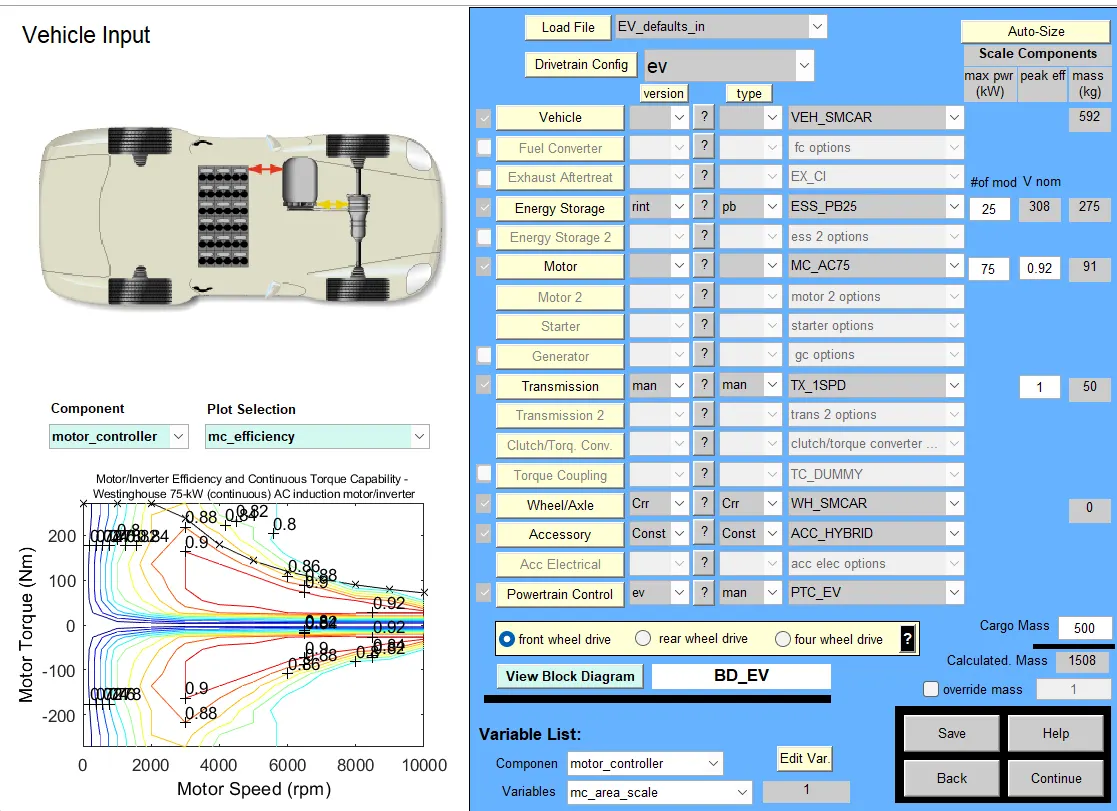
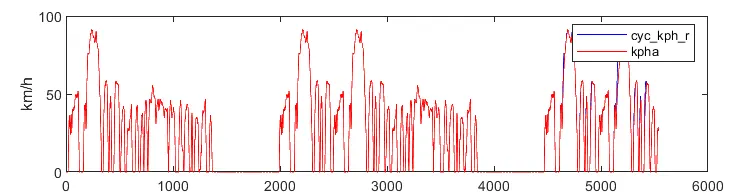
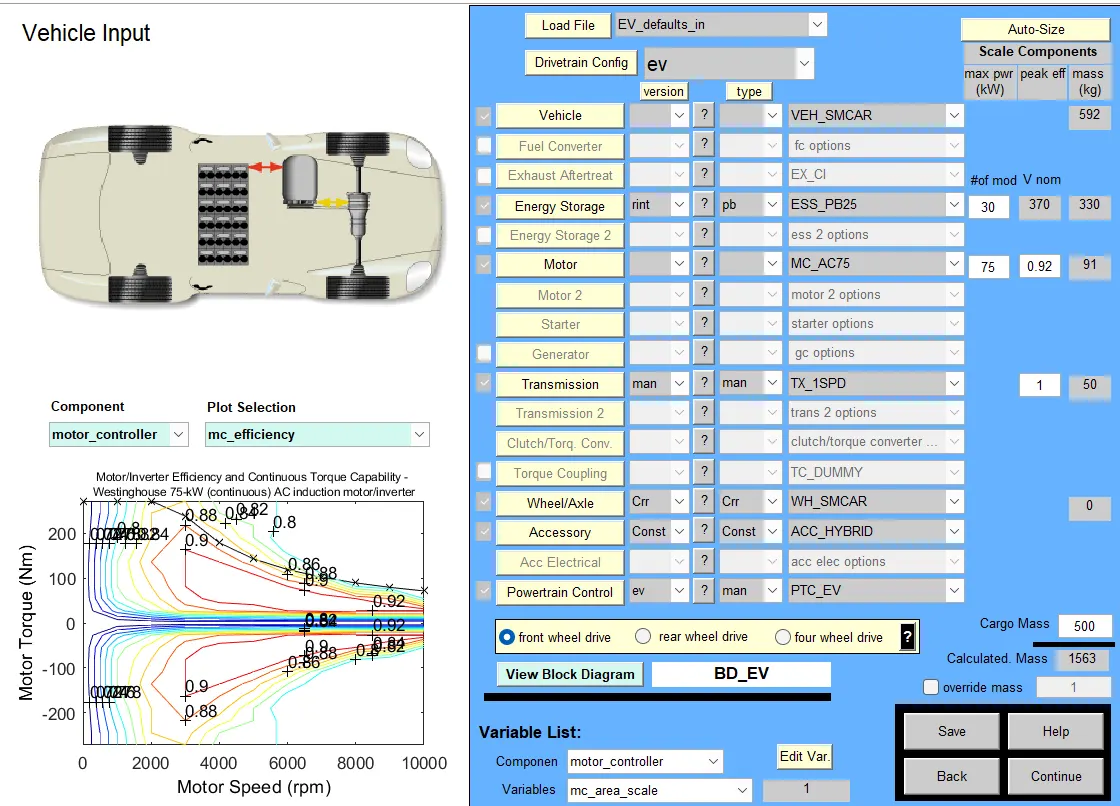
The EV_defaults_in file is used which has a BEV architecture. The default power rating parameters are used for the battery and motor. A cargo mass of 500 kg is implemented and the FTP cycle without consideration of the auxiliary system is used. This is the most aggressive cycle and is repeated 3 times to ensure complete discharge of the battery to test its capability in terms of range and performance. The figure below shows the FTP cycle implemented 3 times.
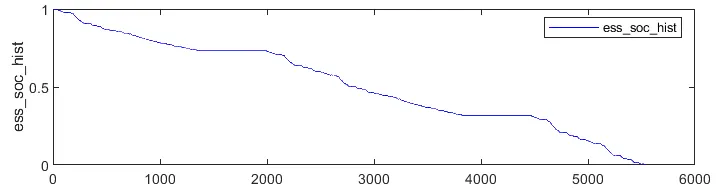
The image below describes the battery pack's State of Charge (SoC) during the simulation time of this FTP cycles. The battery pack is fully discharged from 100 % SoC through three cycles of FTP.
Conclusion :
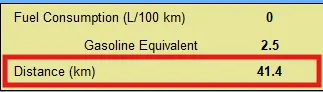
The image below shows the result of the distance traveled in km for the complete discharge of the battery pack. As seen, the vehicle with default values travels up to 41.4 km, and hence, the targeted value of 45 km is not achieved.
Answers to question 2
In this case number of modules in the battery pack was varied to 30 from 25. The performance in terms of range and power is evaluated in this study.
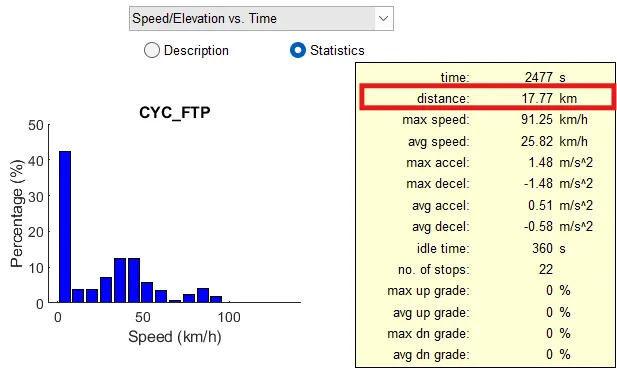
No auxiliary is implemented and vehicle driving on flat road with three FTP cycles the range is evaluated for the same cargo mass of 500kg with higher number battery modules. The image below show the statistics and parametric values that describe 1 full FTP Cycle. As highlighted in the red rectangle is the distance a vehicle can travel in 1 cycle of FTP, which is 17.77 kms. This implies the distance travelled in 3 such cycles is 3 * 17.77 = 53.31 kms.
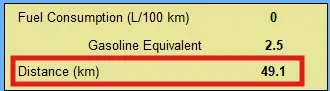
Considering similar conditions as in question 1, except additional battery modules, the distance travelled by the vehicle for this scenario is 49.1 kms which gives approximately additional 8 kms when the number of modules are increased. This is shown in the image below highlighted by the red rectangle.
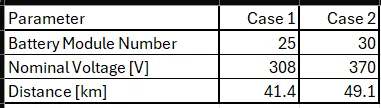
By changing the number of battery modules, a higher range or distance can be achieved, as summarized in the table for case 1 with 25 modules and case 2 with 30 modules.
Conclusion:
With higher capacity, there is higher energy that the battery pack can generate which gives the additional distance that the vehicle can travel.
Answer to question 3
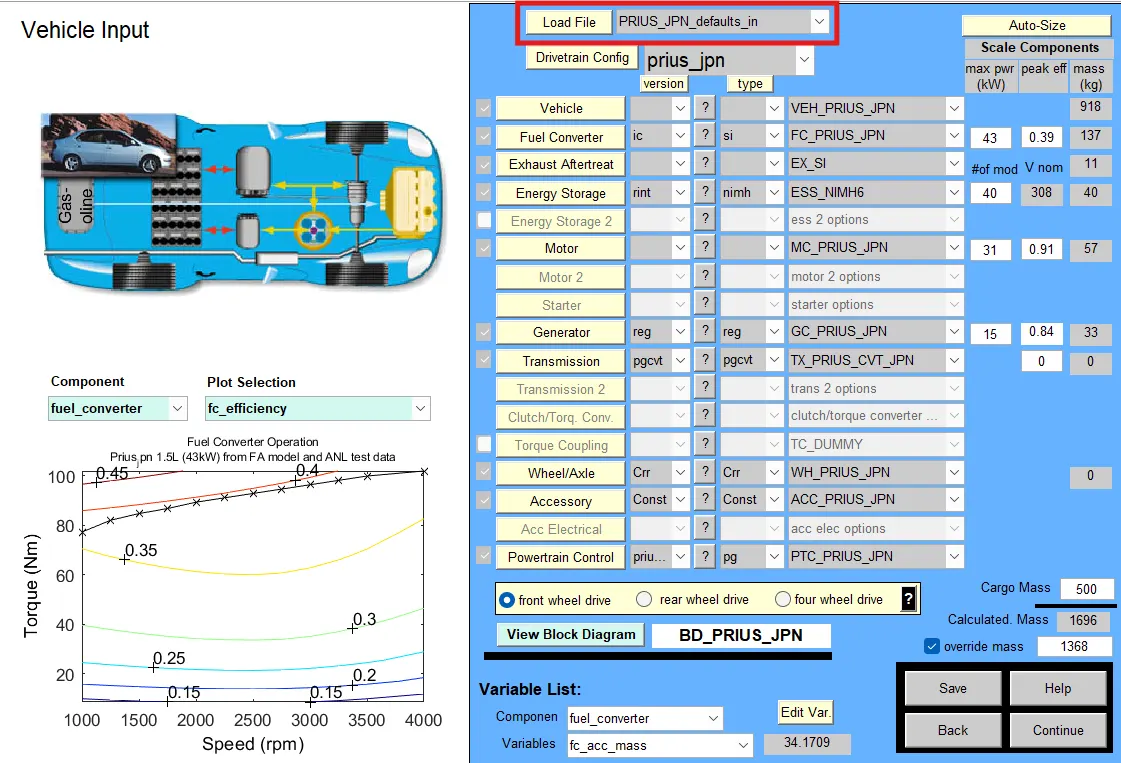
The Toyota Prius model was implemented for the gradeability test, by loading the prius parameters in the load file shown in the red rectangle.
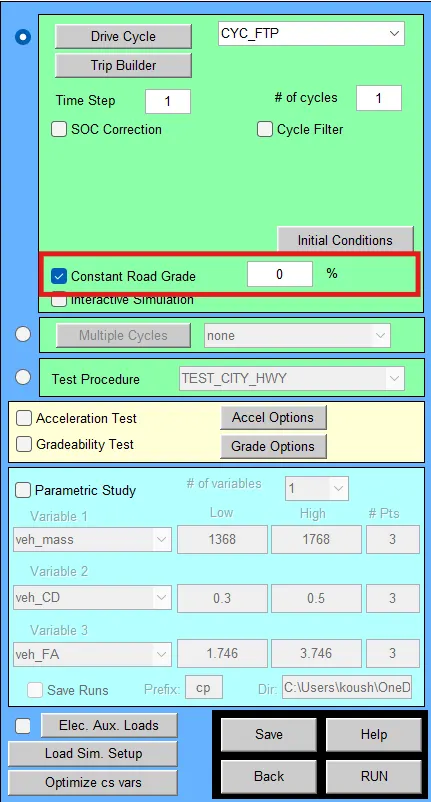
The gradeability test was conducted between 0 to 30 %. This was done by enabling the constant road grade highlighted in the image below. The values are changed between 0 and 30% and the results are evaluated.
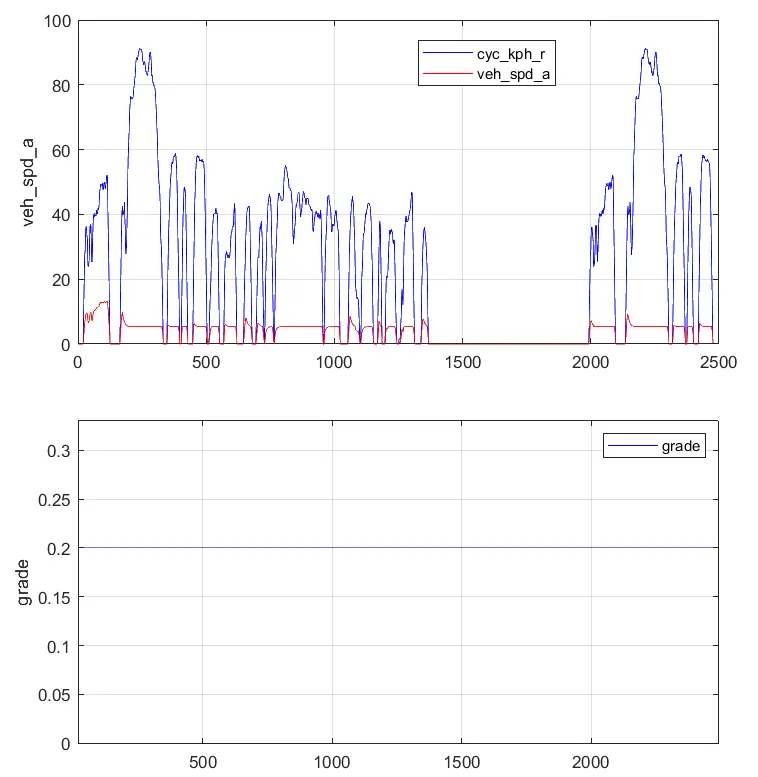
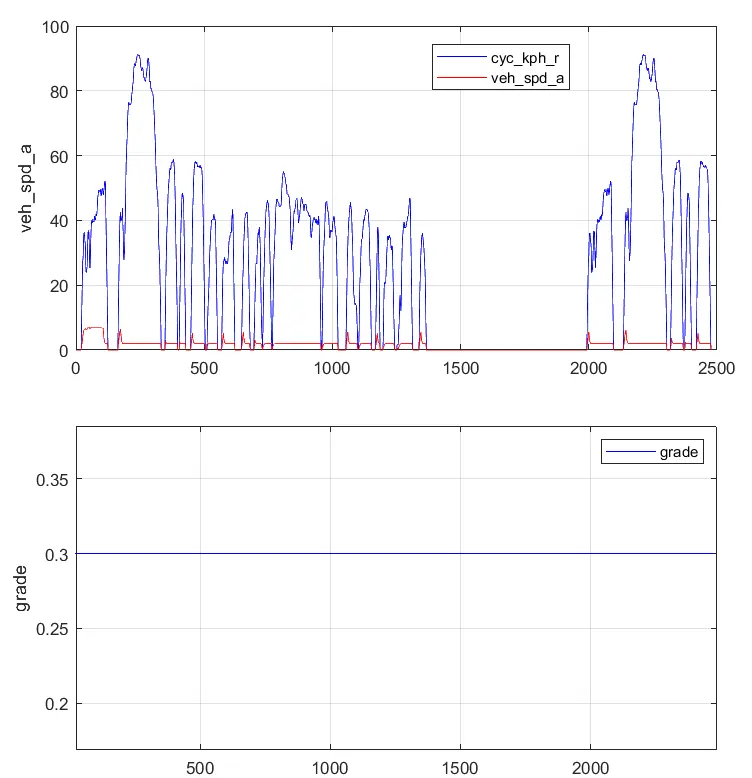
The table below shows the recorded distance travelled for different grades with the same velocity. It shows that increasing grades affect the distance travelled. The distance traveled reduces with increasing grades as the effort required to overcome traction forces increases. Therefore, the energy available for traction reduces with increase grade reducing the distance it can travel.

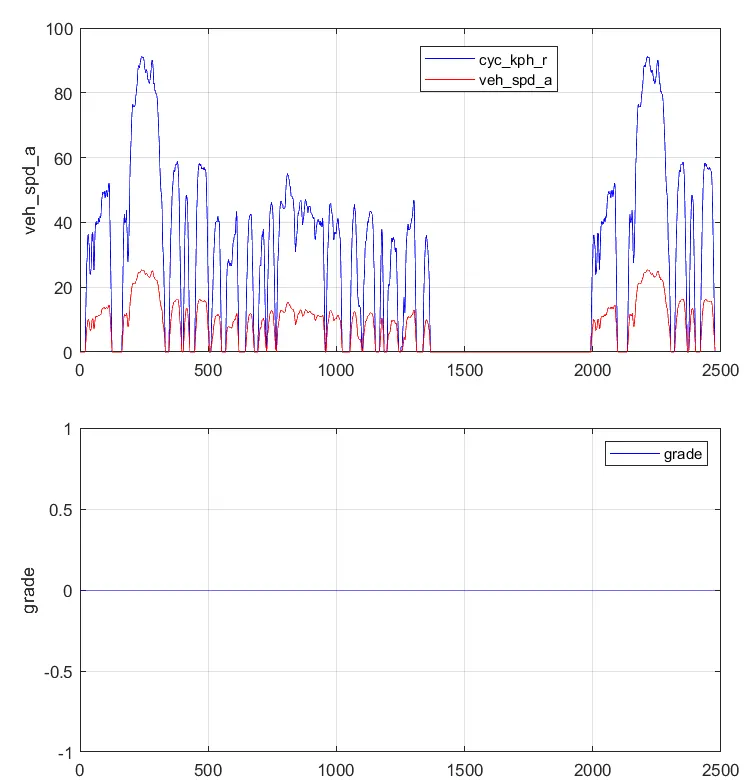
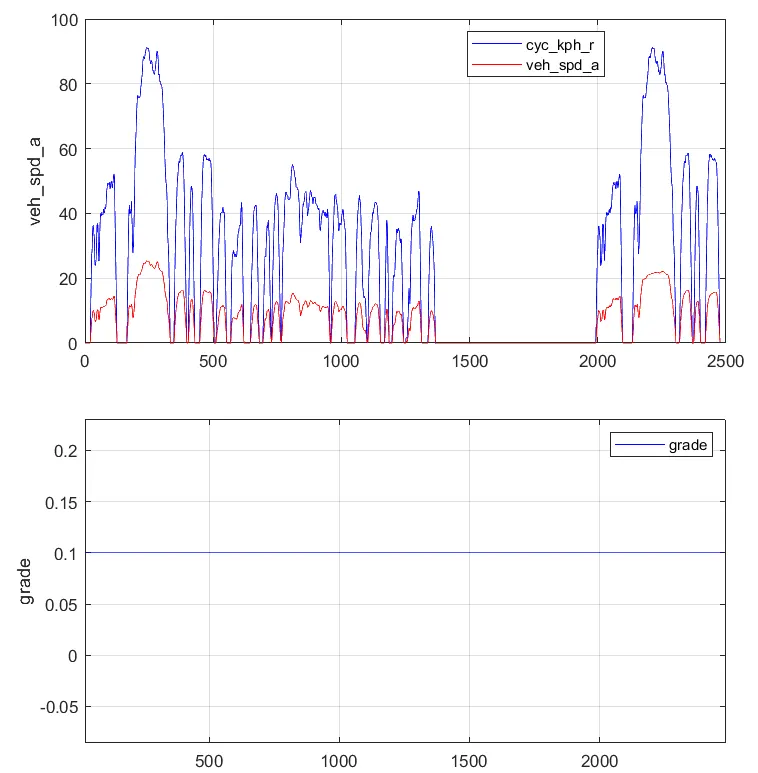
Since the energy request increases with an increase in grade, the achieved vehicle speed reduces with an increase in grade. The images below give the variation in speed achieved with corresponding grades. Blue shows the driving cycle, and red shows the vehicle's achieved speed (in kmph).
Conclusion:
With the increase in grade the energy demand increases. Hence, for a specific energy source, the power is utilized to overcome forces reducing the speed of the vehicle and also the distance it can travel.