Week-3 Challenge: ADVISOR Tool
%%%%%%%ADVISOR TOOL INTRODUCTION%%%%%%%%%%%%%%%%%%%%%%%%%%%%%%
- Advisor tool - also known as Advanced vehicle simulator was created by National Laboratory for Renewable Energy(NREL) and the Department Of Energy of USA.
- Was in its development phase from 1994 to 2004.
- It gives a rapid analysis of the performance and fuel economy of conventional electric, and hybrid vehicles.
- It uses a backward flow (driving cycle to energy storage approach).
- Vehicle models are mostly experiential relying on drivetrain. Drivetrain input/output relationships were measured in the laboratory.
- Only look-up tables are available, no built-in MATLAB models.
Q:1---For EV defaults vehicle the default mass is 135 kg. So if changed to 500 kg it gives us the analysis accordingly. The overload mass is 1440 kg which means that the overall total weight of the vehicle must not exceed more than this particular value. Although the overload mass button is available to exceed the total weight and still allow the vehicle to run smoothly.
Following are two cases of two dissimilar weights vehicle analyis.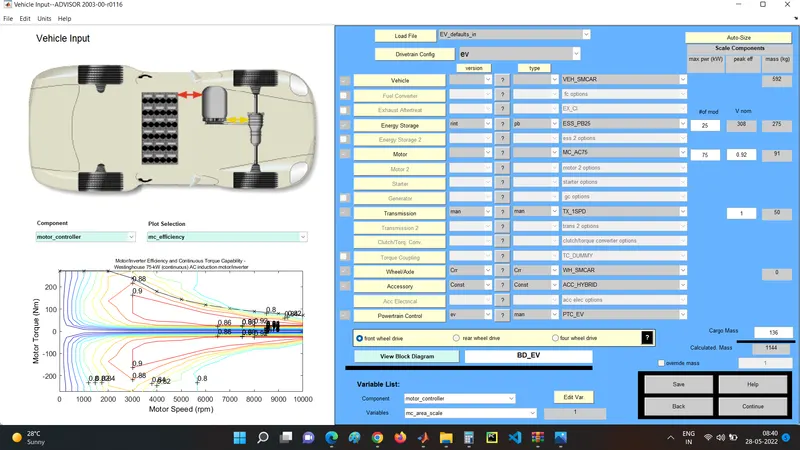
Fig-a-top level gui for ADVISOR tool
In the above figure, various parameters like energy storage, motor efficiency, transmission type, and drivetrain configuration are available. On the left top, the vehicle diagram of its topology is shown followed by the component list and plot selection drop-down lists are available. The plot in the above figure is of motor torque and it is seen exactly as a mirror image, which implies that the regenerative braking is successfully taking place and is known by the neagative torque is equal to positive torque in the contour plot. After clicking on continue button in the right bottom corner, the window looking like below figure is seen.
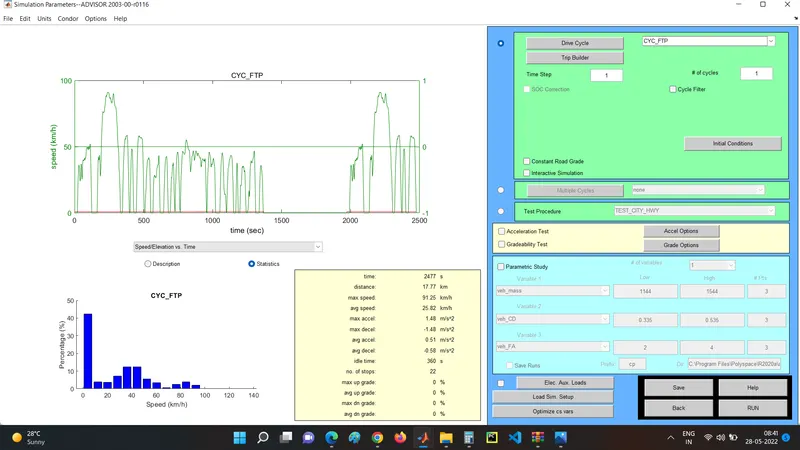
In this window the testing parameters like drive cycle,gradeability test, acceleration test are available for editing. The graph of speed v/s time alongwith gradeability is seen in the left side. A dropdown list is shown from which the speed vs time option is selcted. Below that you can choose from description and statistics , by default it is set to statistics. Various detailed speed parameters are seen from the statistics table like distance,time,average speed,grade,acceleration etc. To run the simulation click on the "RUN" ,a window is shown depicting the test parameters.
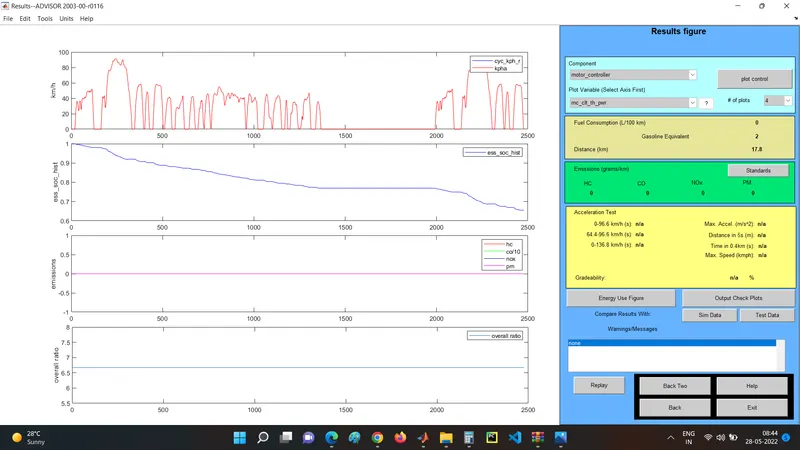
The four different windows represent the speed, state of charge, emissions, and overall ratio respectively. The first window shows the drive cycle so there is no change seen. The state of charge is seen decreasing gradually from 1 to 0.6. The emissions window is seen to be constantly zero throughout which is one of the desirable parameter conditions. The overall ratio is between 6.5 and 7. The fuel consumption is seen as 0 and the gasoline-equivalent is 2. The distance which could be traveled efficiently is 17.8. Now the weight of the payload is changed from 136 to 500kg which leads to an increase in total weight from 1 .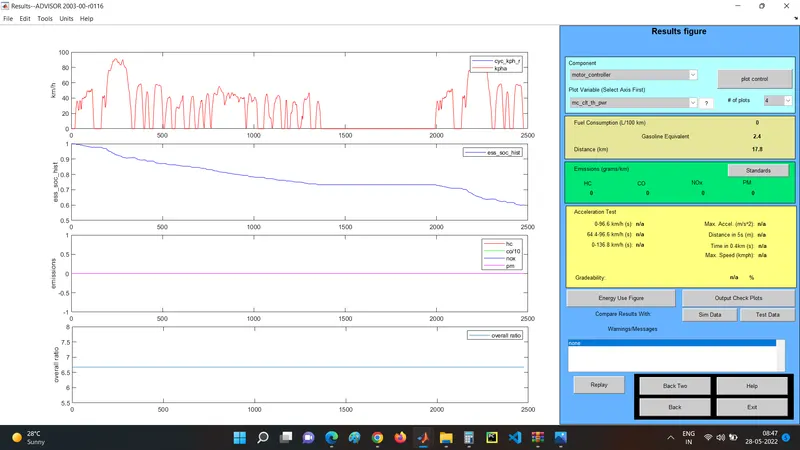
The above figure represents the output characteristics of EV_default file for 500 kg.The drive cycle is same as above which is FTP-75 or federal test procedure-75. The significant change is seen in fuel consumption as a result of increased weight which is 2.4L . Also the distance remains the same as they are standard measures for analysis. The distance is 17.8 Km which is far more less than 45Km.
For the above case if the battery capacity is changed the total voltage capacity also changes. In the advisor tool, we are provided with no modules that decide the total power availability. By default it is set to 25 V, 275 is the nominal voltage.When changed to 30 modules changes to 375 nom volt. The motor efficiency is 0.92 or 91%. The weight of the vehicle also increases by a certain factor which increases fuel consumption.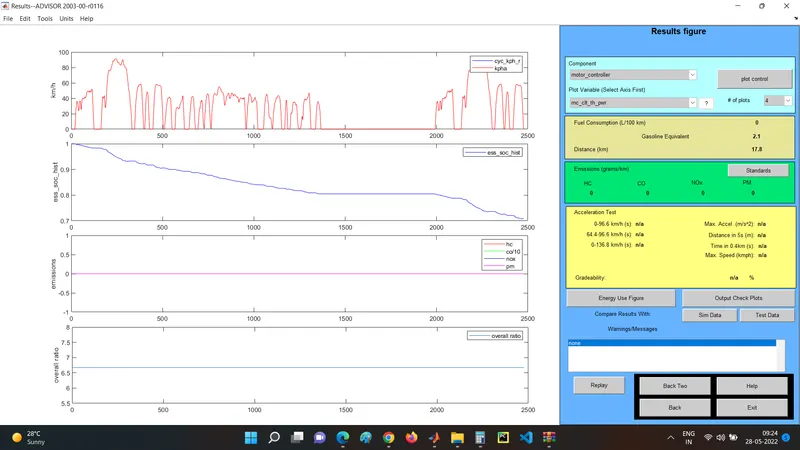
The state of charge remains above 0.7 or 70% which is because of increased voltage storage capacity. Remaining parameters remain unchanged.
---------------------------------------------------------------------------------------------------------------------------------------------
Q:3-Gradeability test:
- Gradeability is defined as the ability of a vehicle to overcome the hill at a constant speed. There are two ways to express gradeabilty:1- Degree and 2- Percentage.
- Percentage of grade = RISE/RUN * 100. E.G. 5'RISE/25'RUN=0.2*100=20%
In ADVISOR tool choice is provided between acceleration test and gradeability test. To perform gradeability test click on gradeability test and click "continue".Choose the necessary parameters such as gradeability percentage. By default it is set to 6%. The following window appears for 7%.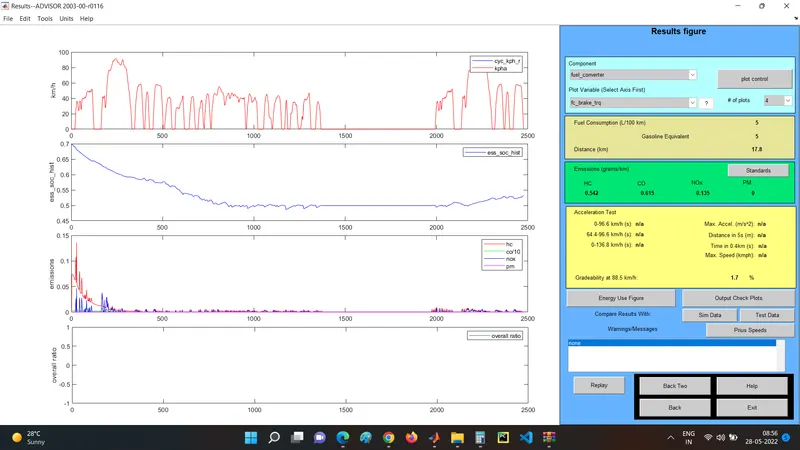
emissions are seen spiking in the begining of the cycle. Here FTP drive cycle is chosen.State of charge is seen fluctuating between 0.7 to 0.5 and slightly increases after approaximately 1300 seconds.