Week-3 Challenge: ADVISOR Tool
1.Default condtion of electrical vehicle in advisor tool :
This is the main GUI for the default electrical vehicle.
this contains lot of input variables regarding each part of the electric vehicle like motor , battery ,transmission,wheel axle etc
We can vary all the input variables from this page .
We can add additional cargo weights or any other weights are possible.
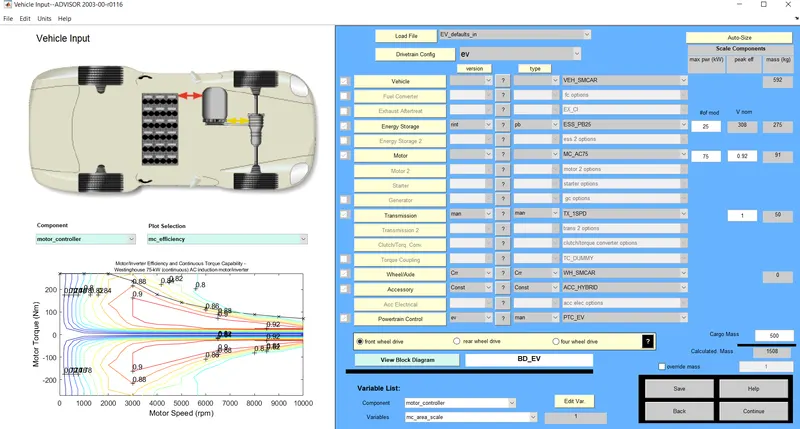
The GUI when cargo mass is given as 500kg :
when the cargo mass is given as 500 kg then the total vehicle weight will be incresed.
The total weight is 1508.
The option is avilable at bottom corner of the right side.
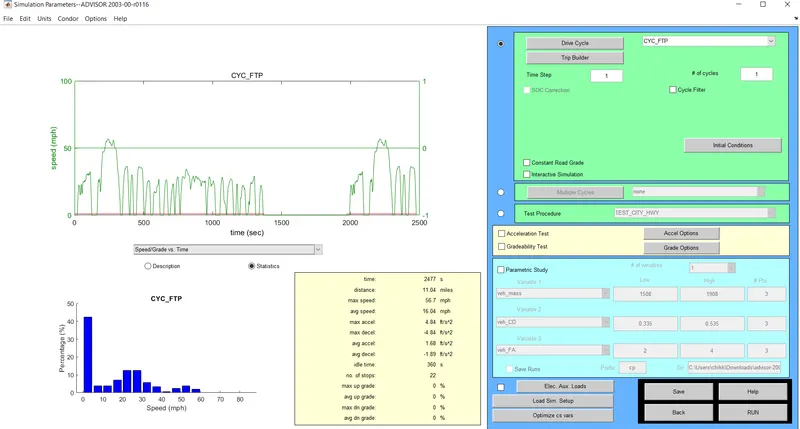
This second GUI is for drive cycle of the vehicle :
Intially the UDD drive cycle is used for the default GUI .
we can change the drive cycle by usig the drive cycle block to cyc_FTP drive cycle
The drive cycle represents the FTP cycle.
The typical drive cycle is for 2477sec of time and distance is 11.04miles..
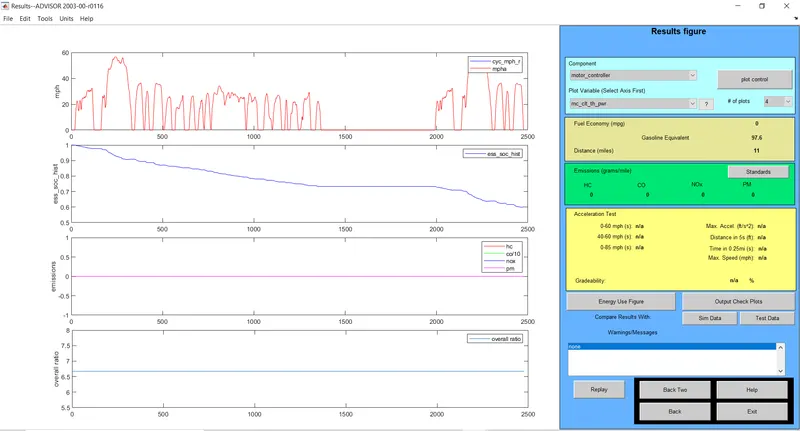
This is the results GUI for the given input model :
From this result page also the total distance of the vehicle is noted that 17.8km .
And the state of chagre is ploted on graph ie, it reaches to 100% to around 60% .
some of the other details are also ploted.
plot when 1FTP cyclewith 500kg cargo is considered :
The distance traveled is 17.8km,with 100%to 60% of battery charge.
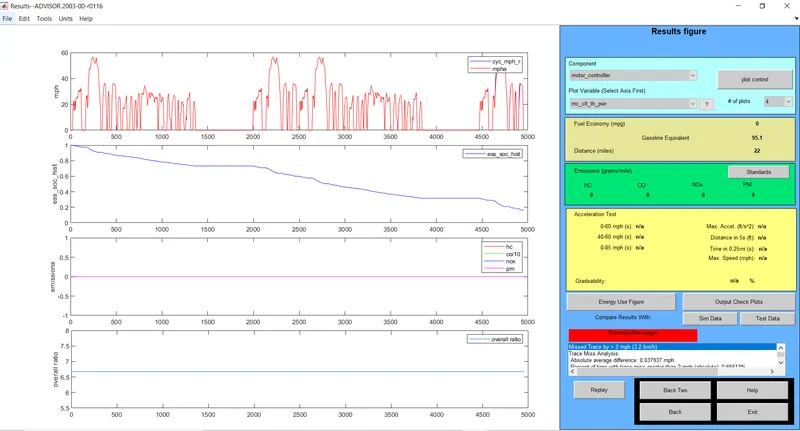
plot when 2FTP cycle with 500kg cargo is considered :
The distance traveled is 35.5km,with 100%to 20% of battery charge
plot when 3FTP cycles with 500kg cargo is considered :
The distance traveled is 41.4km,with 100%to 0% of battery charge.
That means the veicle battery is completely drained.
Even if we give more drive cycles to the vehicle,vehicle can travell this much distance with this load.
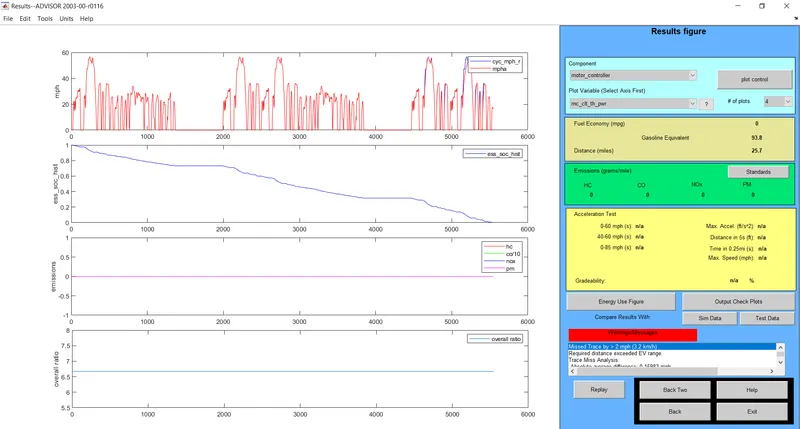
To overcome this drawback we have increse the capacity of the battery of the vehicle.
2 .CHANGING THE BATTERY CAPACITY OF THE VEHICLE :
In the below GUI i modified the no of battery modules to 50 from 25 in the tool.then it looks like
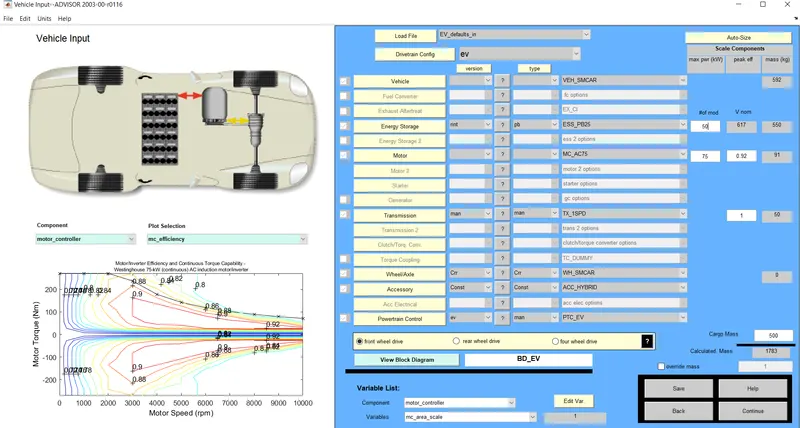
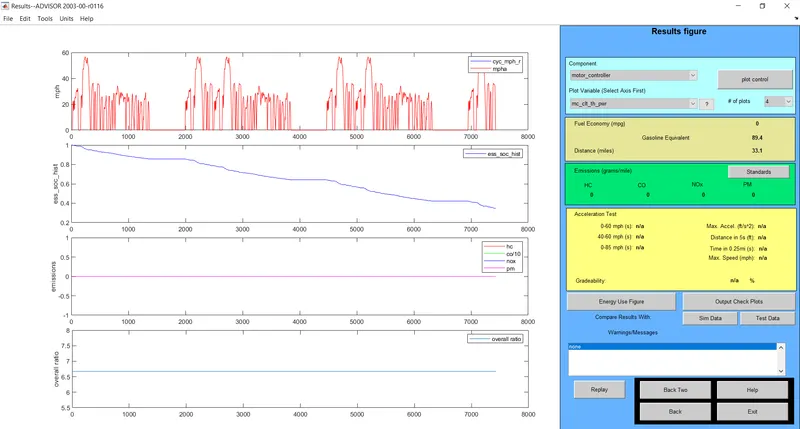
This is the plot or result when battery modules incresed to 50 with 3 FTP drive cycles :
In this situation the vehicle travells 53.3 km within 100% to 30% of battery charge.
From the all the things we observed that it requires three FTP drive cycles with more power modules required to travel the 45km.
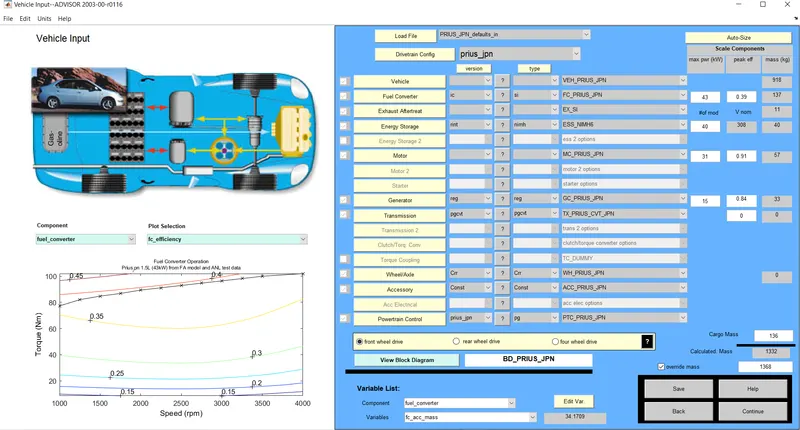
3.PRIUS_Jpn_defaults_ model gradiability test :
This is one of the toyota model hybrid vehicle.
The below GUI is the prius jpn model ,this is main gui
in order to perform the grdiability test gradiuability test option avilable on 2GUI ,click on continue to go to it.
Gradiuability test GUI page :
The below image represent the grdiability test input variables page in we can change our speed interms of 5mph ,10 mph 15mph ......upto its maximum mph and corresponding gradiability will be given on result page.
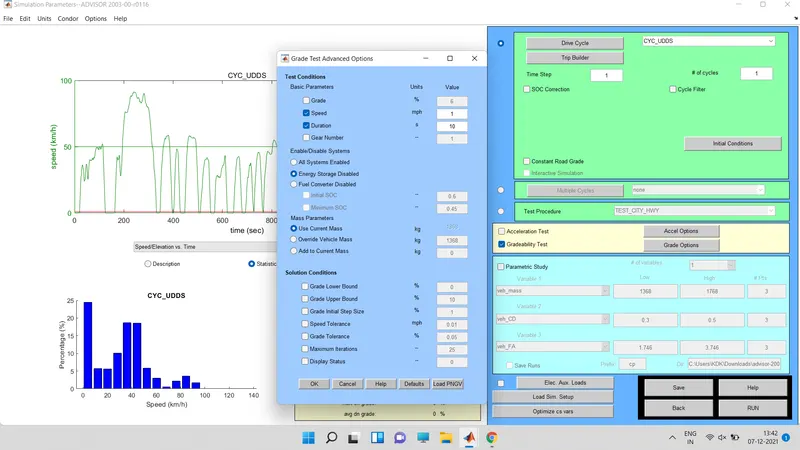
The vehicle moving with 1mph speed :
When the vehicle moving with 1mph ie, 1.6kmph ;gradiability=31.7%
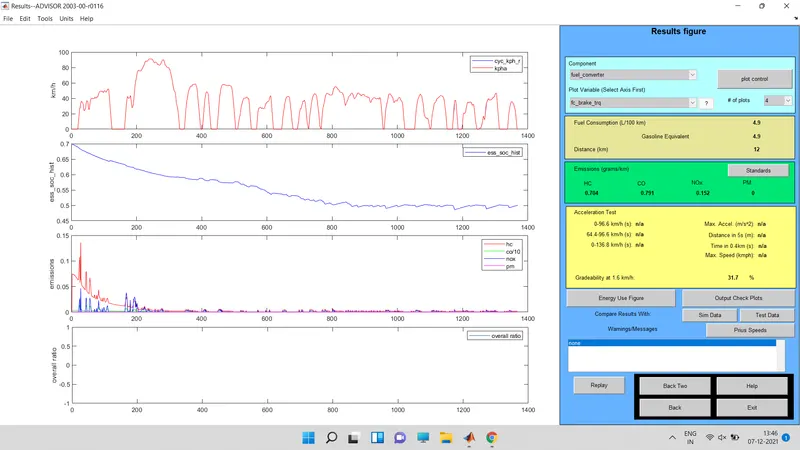
The vehicle moving with 5mph speed :
When the vehicle moving with 5mph ie, 8kmph ;gradiability=32.8%
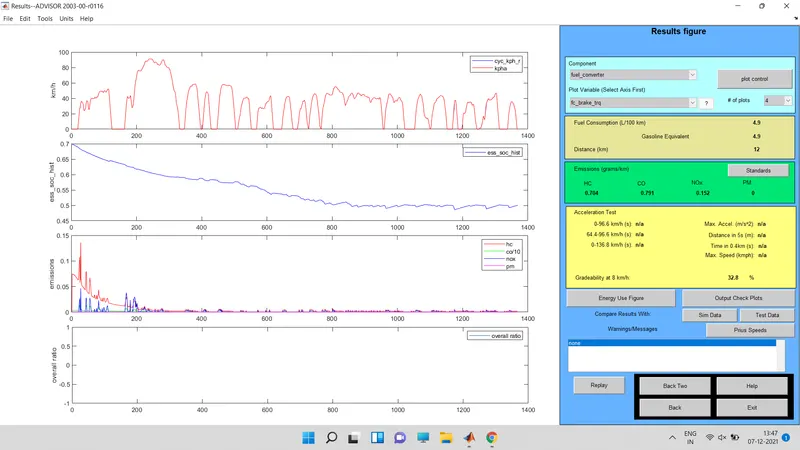
The vehicle moving with 10mph speed :
When the vehicle moving with 10mph ie, 16.1kmph ;gradiability=30.3%
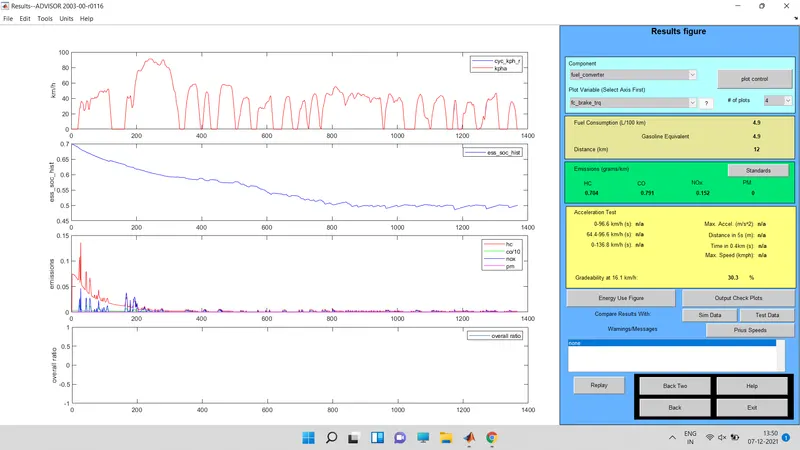
The vehicle moving with 15mph speed :
When the vehicle moving with 15mph ie, 1.6kmph ;gradiability=24.4%
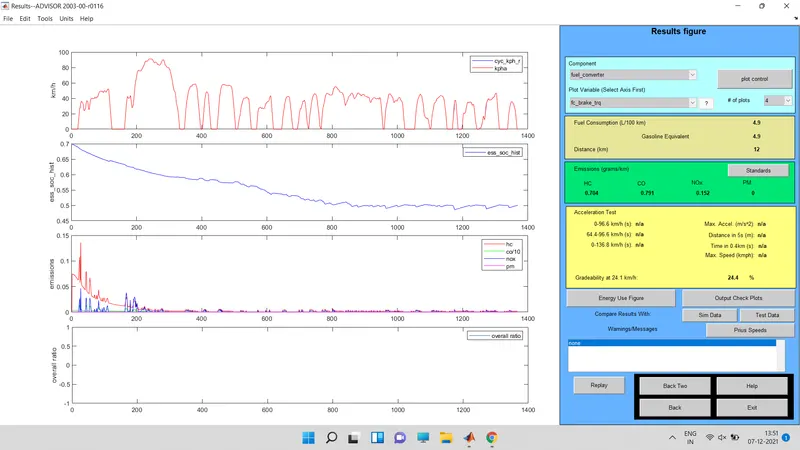
The vehicle moving with 20mph speed :
When the vehicle moving with 20mph ie, 32.2kmph ;gradiability=19.8%
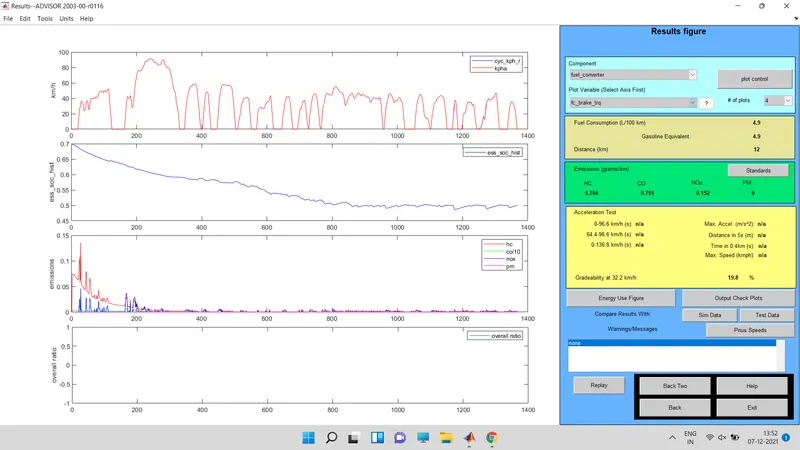
The vehicle moving with 25mph speed :
When the vehicle moving with 25mph ie,40.2kmph ;gradiability=16.5%
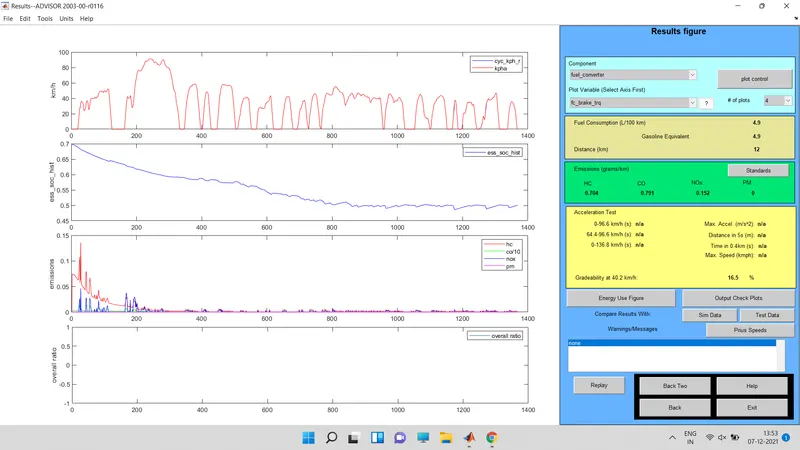
The vehicle moving with 30mph speed :
When the vehicle moving with 30mph ie, 48.3kmph ;gradiability=14.7%
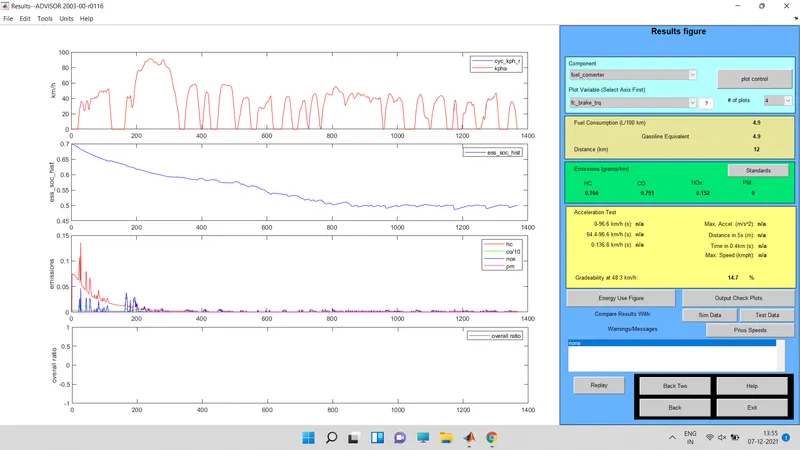
The vehicle moving with 35mph speed :
When the vehicle moving with 35mph ie, 56.3kmph ;gradiability=13%
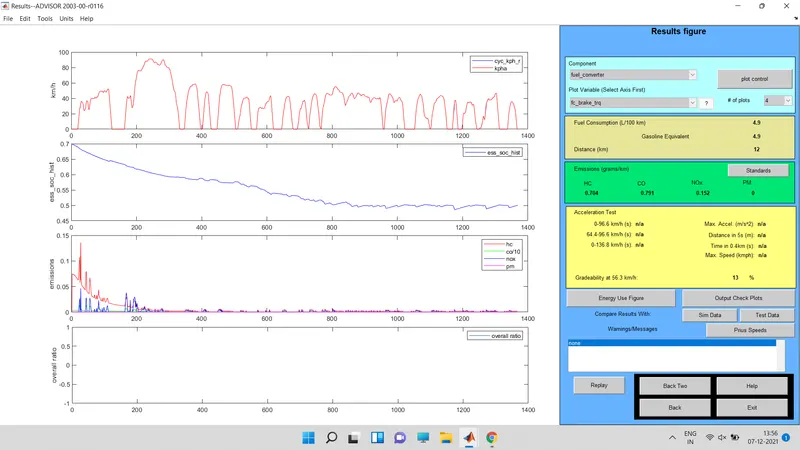
The vehicle moving with 40mph speed :
When the vehicle moving with 40mph ie, 64.4kmph ;gradiability=11.7%
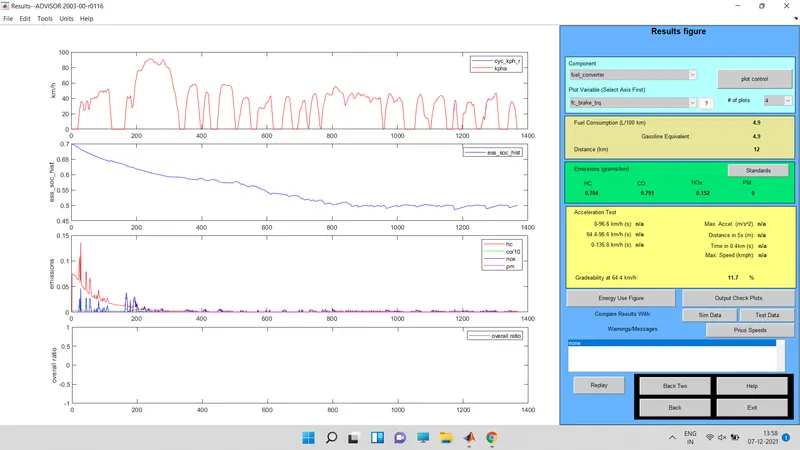
The vehicle moving with 45mph speed :
When the vehicle moving with 45mph ie, 72.4kmph ;gradiability=10.7%
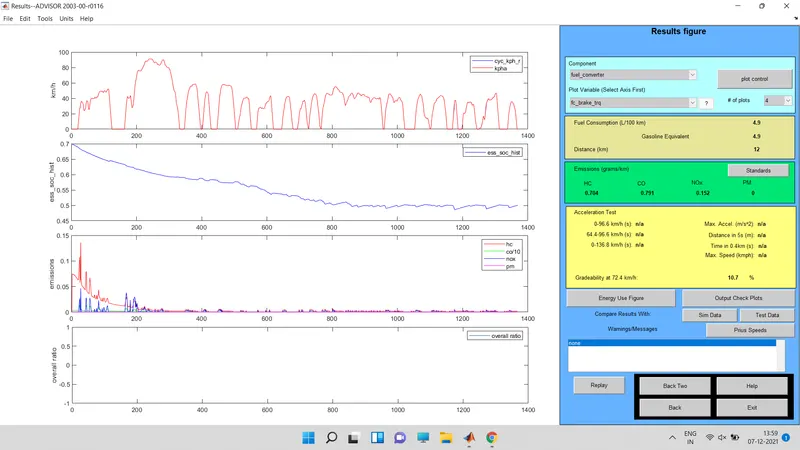
The vehicle moving with 50mph speed :
When the vehicle moving with 50mph ie, 80.5kmph ;gradiability=9.7%
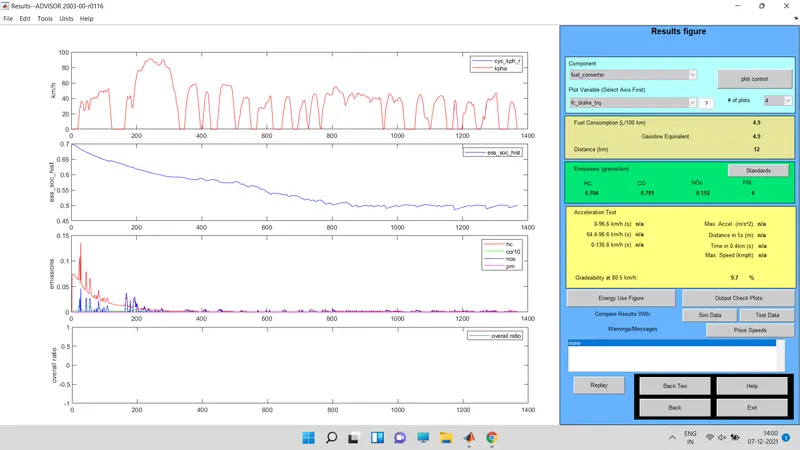
from above results :
| speed (miles/hr) | speed(km/hr) | gradiability % |
| 1 | 1.6 | 31.7 |
| 5 | 8 | 32.8 |
| 10 | 16.1 | 30.3 |
| 15 | 24.1 | 24.4 |
| 20 | 32.2 | 19.8 |
| 25 | 40.2 | 16.5 |
| 30 | 48.3 | 14.7 |
| 35 | 56.3 | 13 |
| 40 | 64.4 | 11.7 |
| 45 | 72.4 | 10.7 |
| 50 | 80.5 | 9.7 |
From all these results the table is drawn , as the gradiability is decreses the speed will be increasing.
ie, for less gradiability the vehicle speed will be high.