Week-3 Challenge: ADVISOR Tool
ans 1). int this part of challenge we will try to find the efficienbcy of a drive cycle with different battery modes and diffrent drive cycles
ans 1). aim to provide the vehicle travel for 45 km with FTP drive cycle with 500 kg weight
In the first cycle with the data provided was inserted in the advisor
with the 1 CYC_FTP duty cycle and battery percentage of 100 % (state of charge) the vehicle manage to travel 17.8 km and battery used for 1 cycle was 40%
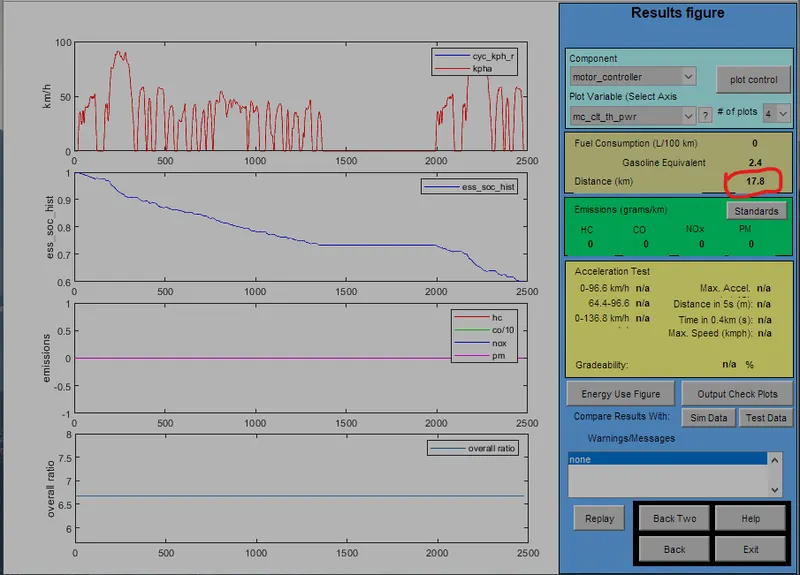
now as we change the number of duty cycle as 2 we can assume the distance that we can get is 35.6 km and the battery consumption rate will we near about 80 %
now increasing the number of cycle as 3
we can get following result
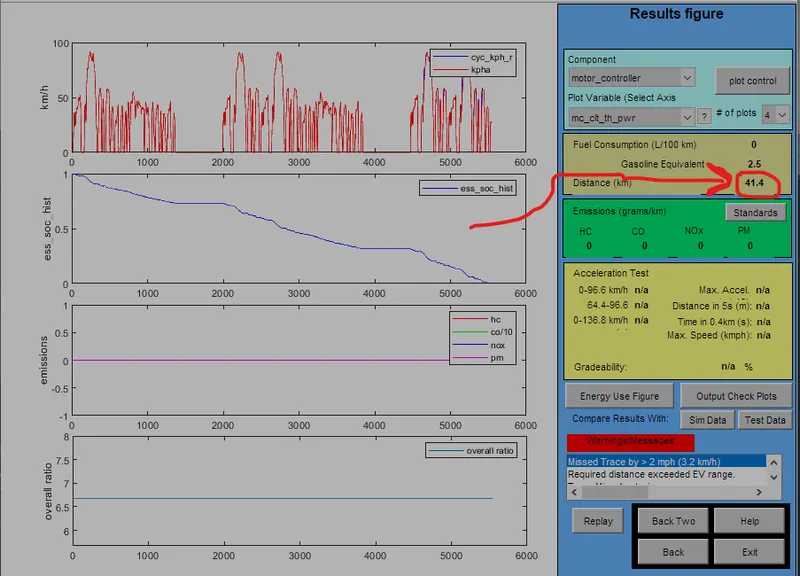
here we can observe that the state of charge left is 0 %at 41.4km and the vehicle couldnt travel more than 45 km with CYC_FTP cycle.
no of cycle distance travelled battery consumed
1 17.8 40%
2 35.6 40%
3 41.4 20%
ans 2).now we have revised the test but this time we have increased the number of cells and voltage and weight varys accordingly
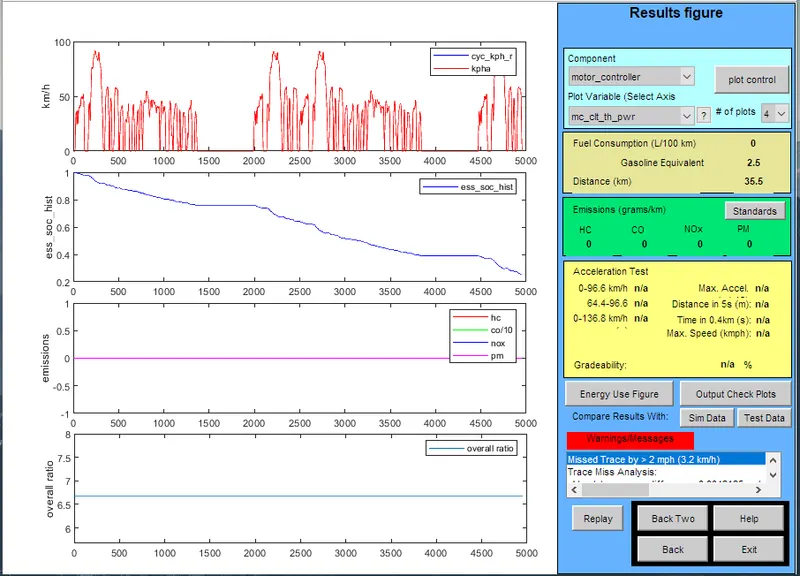
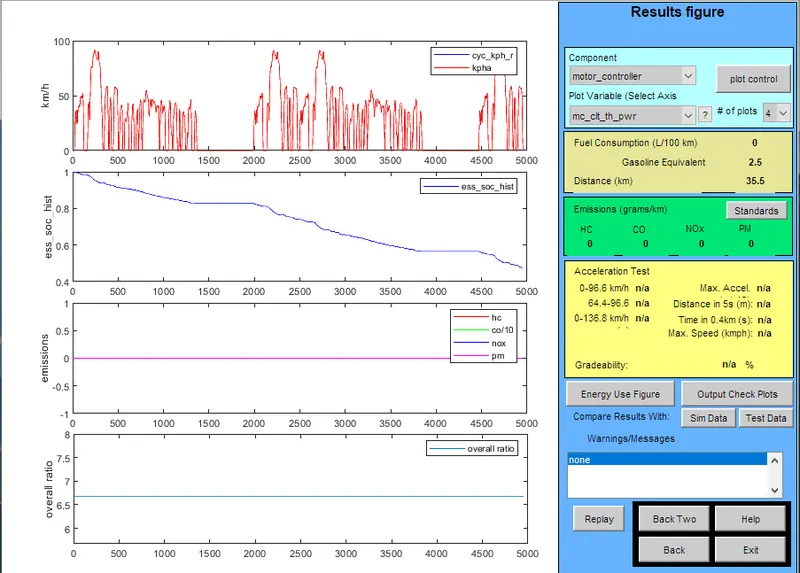
test with 28 cells and 2 drive cycle given below
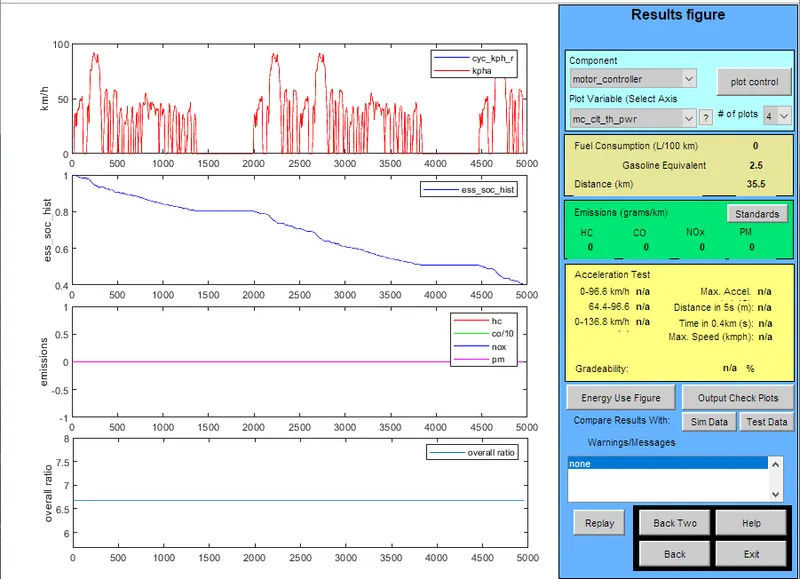
test with 35 cells and 2 drive cycle given below
test with 40 cells and 2 drive cycle given below
note!!!!!!!!!!!!!!
while limiting the number of drive cycle to 2 we can not get the complete trip distance of the vehicle so the distance was similar in all the test performed above
now the number of cycle are takes as 3 and the number of cells will be varied
test with 28 cells and 3 drive cycle given below
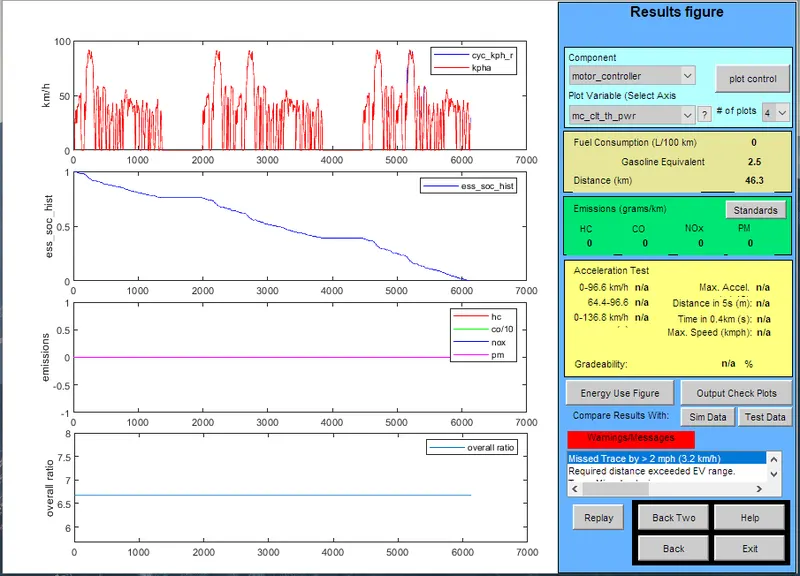
now we can obbserve a increase in overall trip distance
test with 35 cells and 3 drive cycle given below
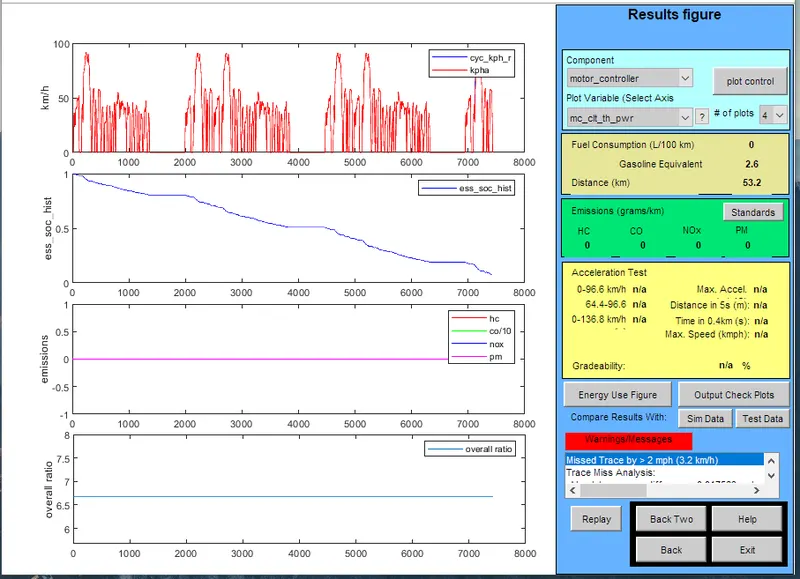
and finally test with 40 cells and 3 drive cycle given below
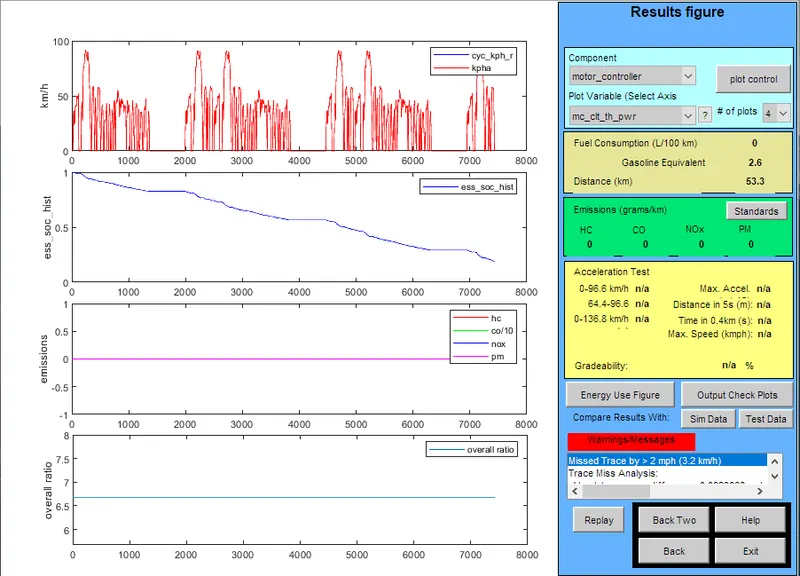
the conclusion that i landed upon were as follows:
no of cycle distance covered #of mod Vnom weight
2 35.5 28 345 275
2 35.5 35 432 385
2 35.5 40 493 440
3 46.3 28 345 308
3 53.3 35 432 385
3 53.3 40 493 440
---------------------------------------------------------------------------------------------------------------------------
ans 3). for this part of the question we will perform 2 seperate test one with the time limit of 10 second and another with 20 second we will keep the distance (in mph) common for both the test
here we have selected the model prius_jpn_default model
and then in the next window we can see as per below image
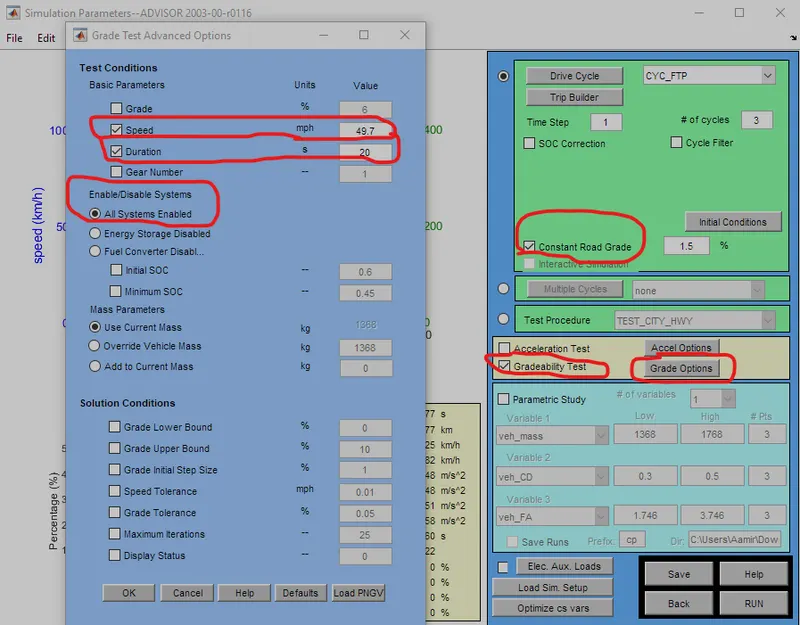
first tick mark on gradeability test
then select constant road grade next go to grade option there input the speed in terms of miles per hour and set time as 10 seconds
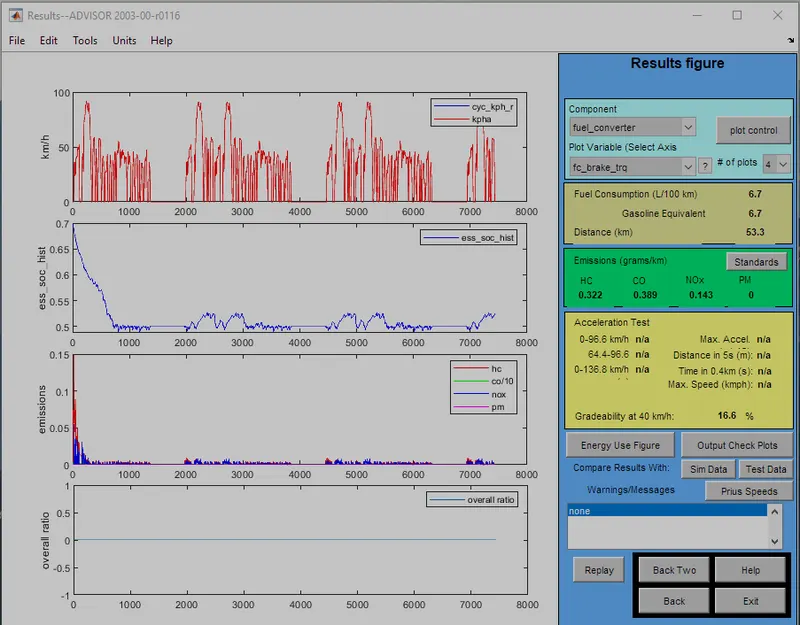
now speed =24.85mph and gradeabilty=16.6%
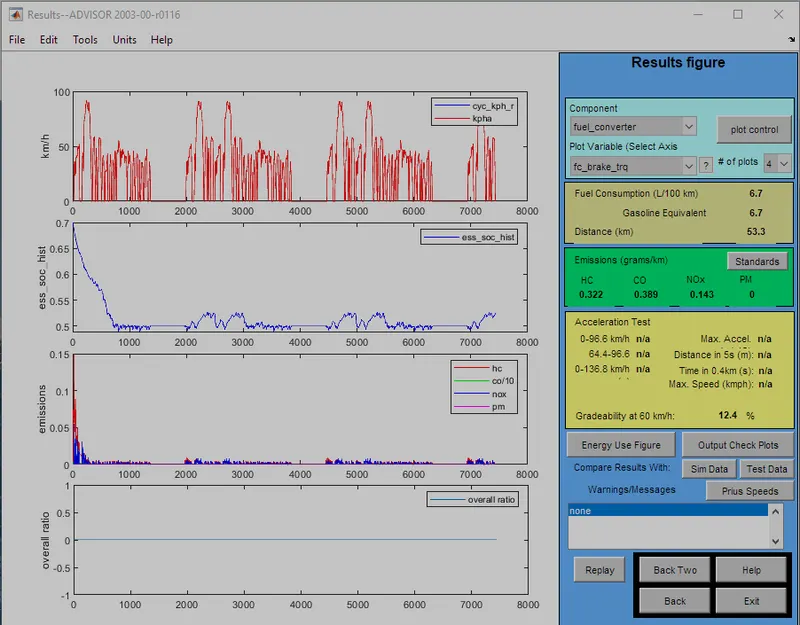
now speed =37.28mph and gradeability=12.4%
now speed =49.70and gradeability=9.8%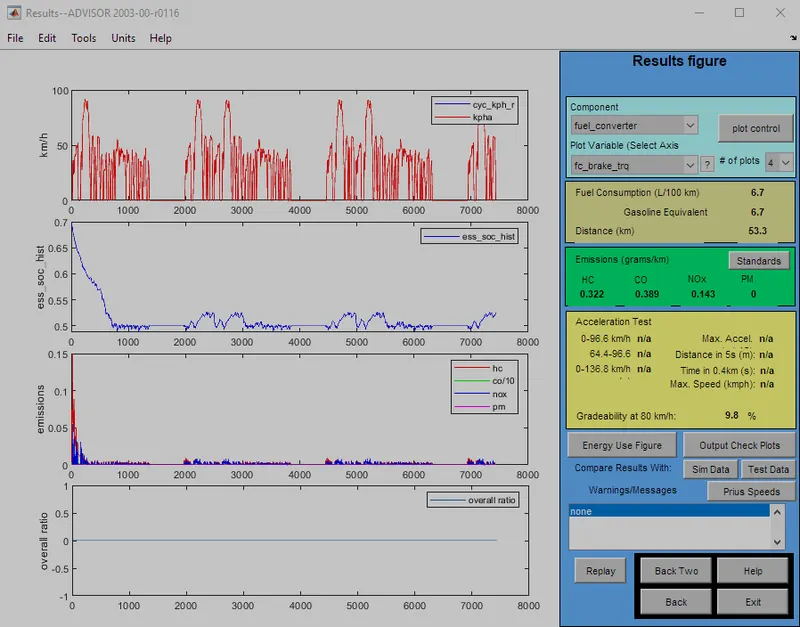
| mph | kmph | gradeability |
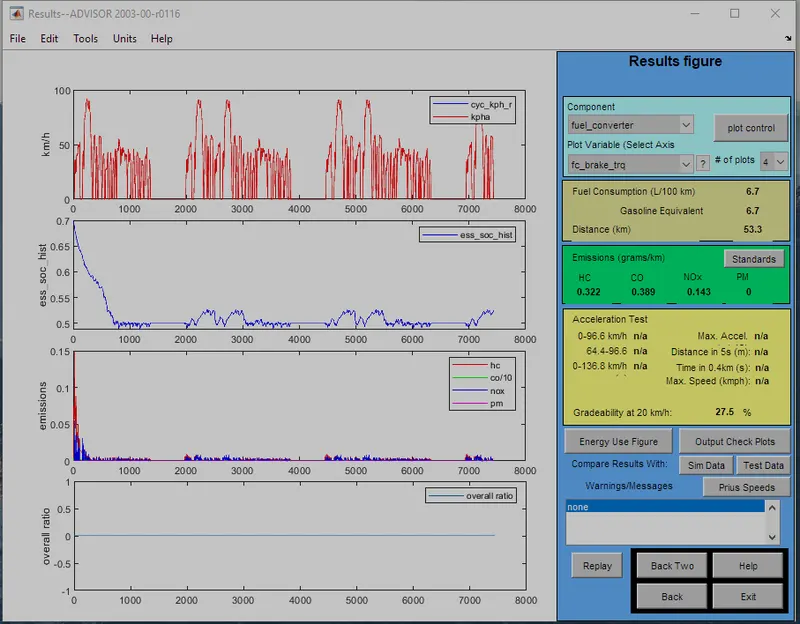
| 12.42 | 20 | 27.5% |
| 24.85 | 40 | 16.6% |
| 37.28 | 60 | 12.4% |
| 49.70 | 80 | 9.8% |
-----------------------------------------------------------------------------------------------------------------------------------
test2 with 20 second as test time and the speed same as test 1
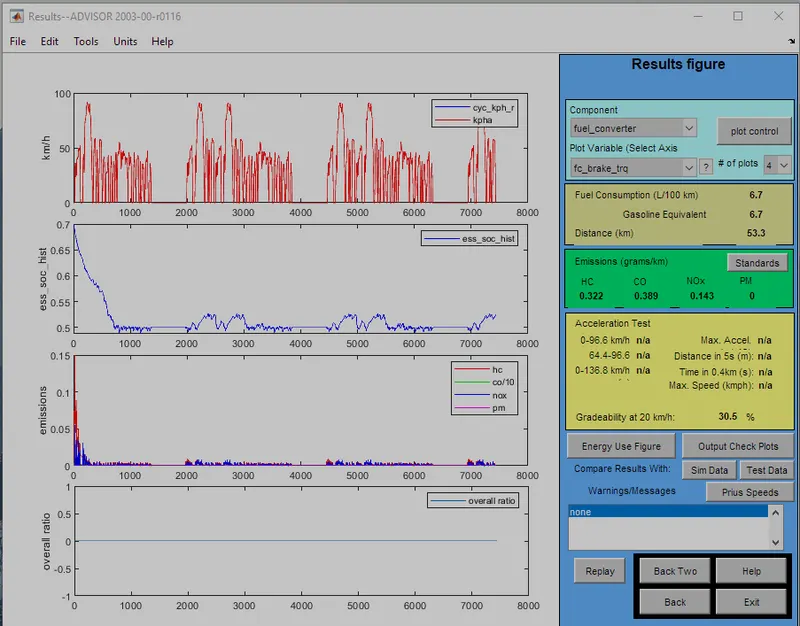
speed12.42mph gradeability=30.5%
speed24.85mph gradeability=19.8%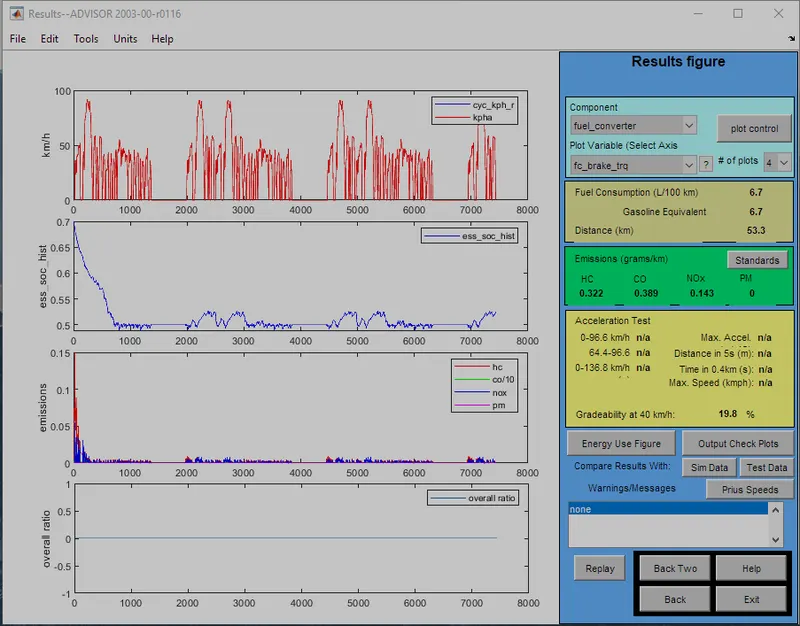
speed37.28mph gradeability=15.3%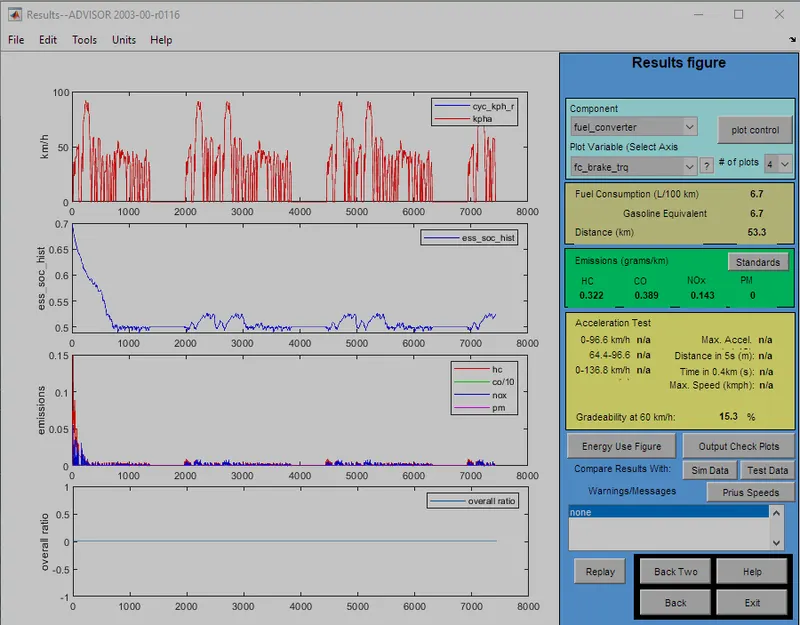
speed=49.70mph gradeability=12.4%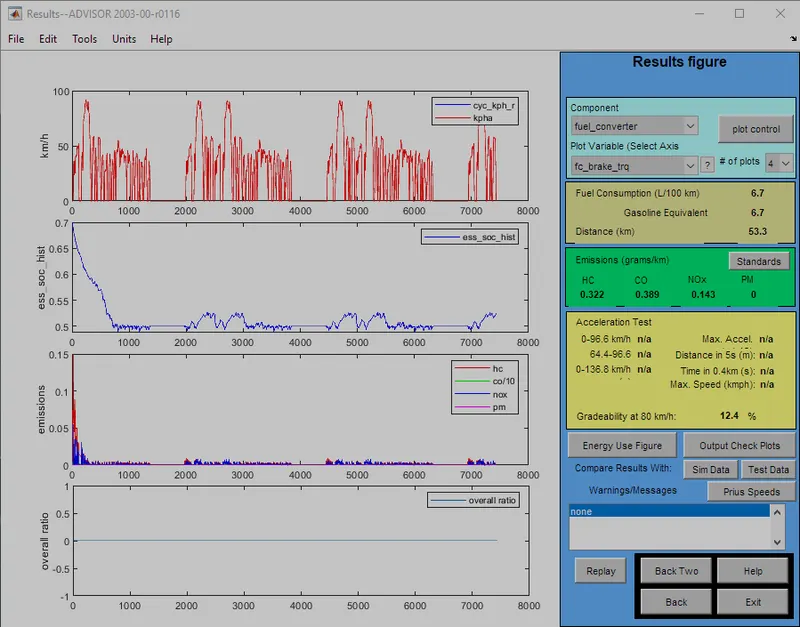
| time assumed =20second | ||
| mph | kmph | gradeability |
| 12.42 | 20 | 30.5% |
| 24.85 | 40 | 19.8% |
| 37.28 | 60 | 15.3% |
| 49.70 | 80 | 12.4% |
here we can conclude that as the speed of vehicle increase the gradeability decreased in both the case the one where we took run time as 10 second and in other test too where we assumed the run time as 20 second in both test it can be concluded that with increase in speed the gradeability decreases