Week 2 - Flow over a Cylinder.
Aim:
Simulate the flow over a cylinder and explain the phenomenon of Karman vortex street.
PART-I
- Simulate the flow with the steady and unsteady case and calculate the Strouhal Number for Re= 100.
PART-II
- Calculate the coefficient of drag and lift over a cylinder by setting the Reynolds number to 10,100,1000,10000 & 100000. (Run with steady solver)
- Discuss the effect of Reynolds number on the coefficient of drag. [ Results should be validated with any standard literature and error should be within 5 %]
Procedure:
We are supposed to two parts cases for simulation,
Part 1) At Re = 100,simulate the flow with steady and transient method and calculate the Strouhal number.
Part 2) Compairing the fluid at steady case with different Reynolds number 10,100,1000,10000 & 100000.
GEOMETRY -> MESHING -> SETUP & SOLUTION -> RESULT.
Meshing:
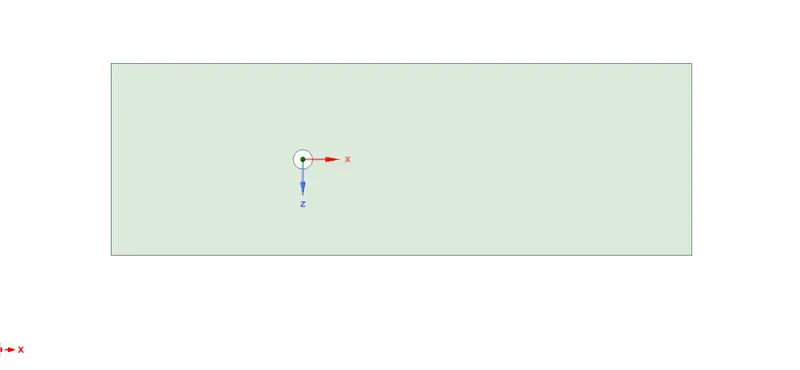
- Select the edges of geometry and named them as inlet,outlet ,wall and symmetry.
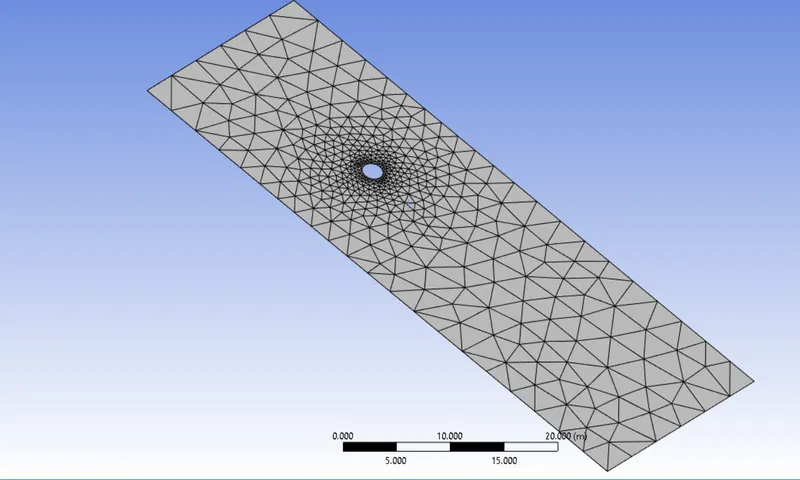
- Now select the body and go to mesh and click on generate mesh with mesh size 0.25 m.To ensure triangular mesh, go to mesh -> insert -> select triangular mesh type.
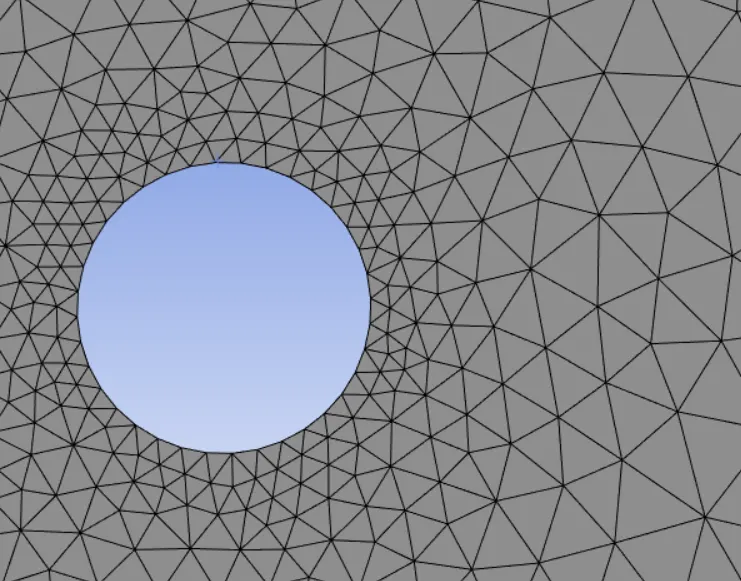
- After generating mesh,it is seen that size of cirle looks distoreted.
- Go to mesh -> sizing -> select circular edge -> deffinition ->type -> no of divisions ->36.
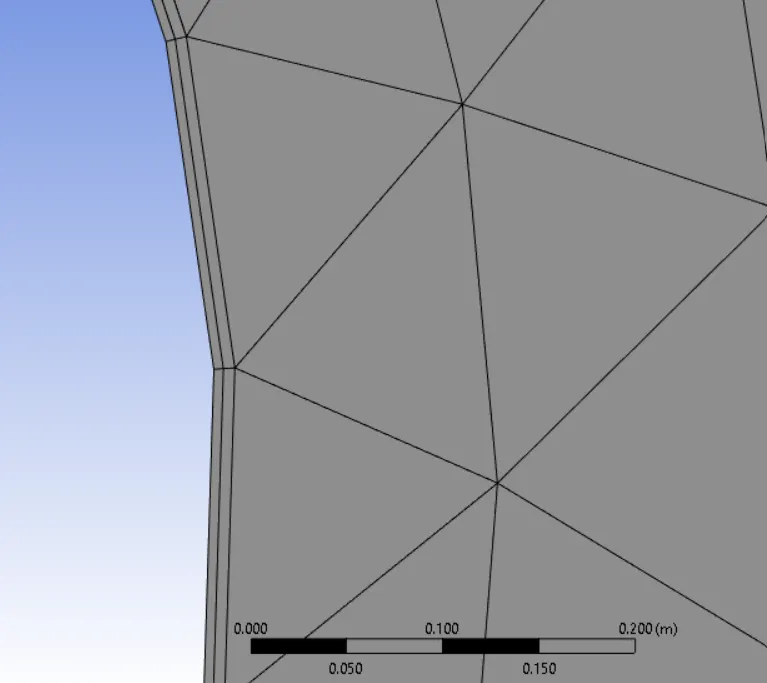
- To capture better results near cylinder wall, go to mesh -> inflation -> select the body and edge -> inflation option : 1st layer thickness ->1 st layer height :0.005 m ->maximum layer :6
Solving :
- Select laminar flow inside the viscous model.
- As we wanted to customimize material property for simulation, go to materials > fluent database > select the material (air) > copy it> rename the name of material.
Steady state simulation:
1.Reynolds number = 10.
velocity = 1 m/s.
density = 1 kg/m3.
viscosity = 0.02 Pa-s.
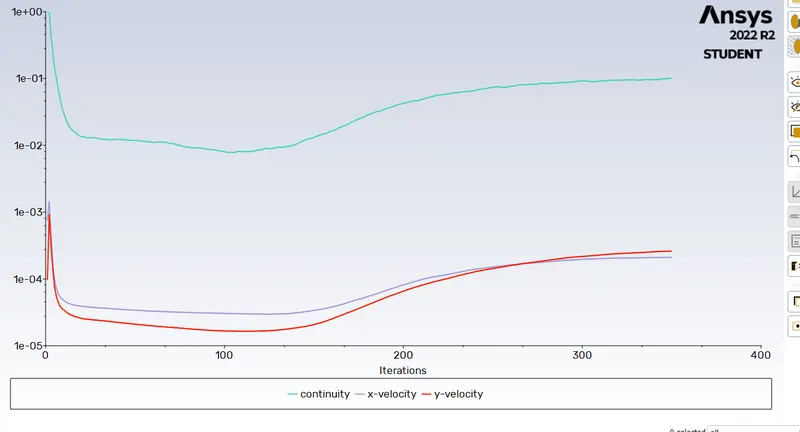
Residual plot:
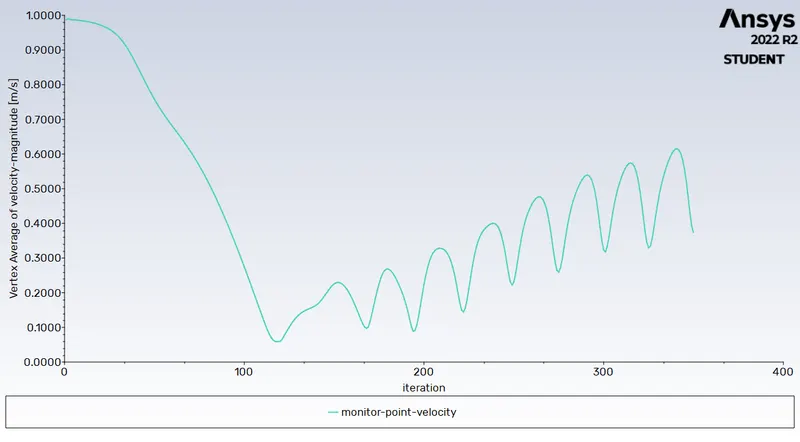
Monitor point velocity:
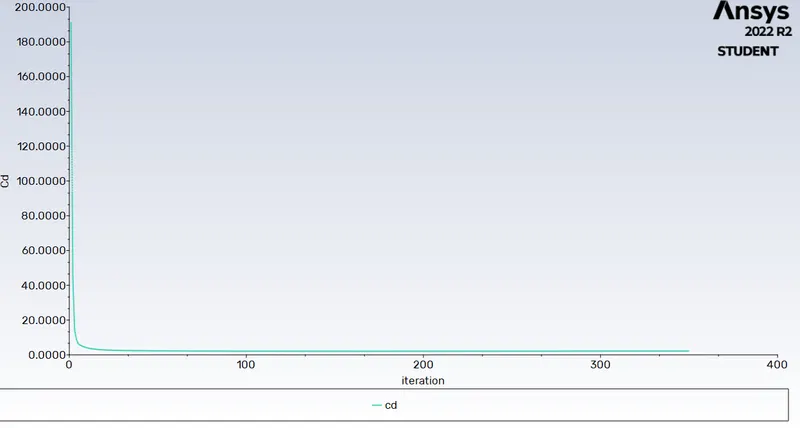
Coefficient of drag:
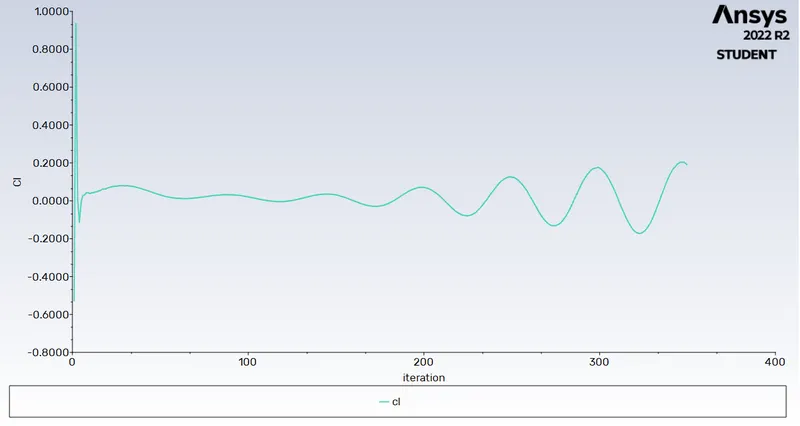
Lift Coefficient:
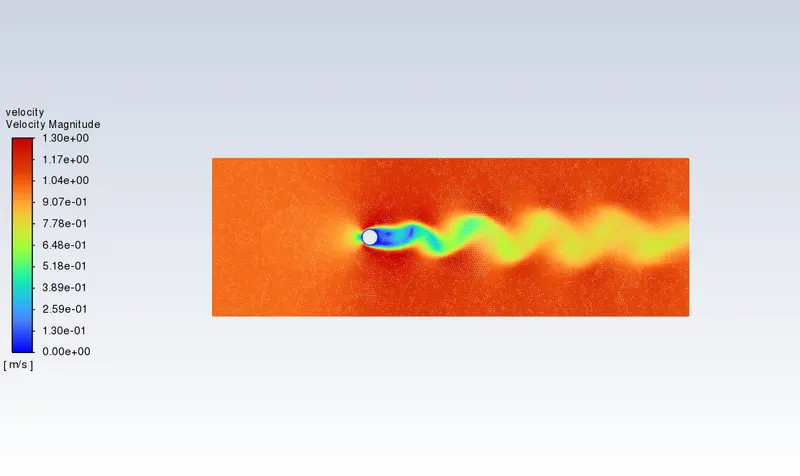
Velocity contour:
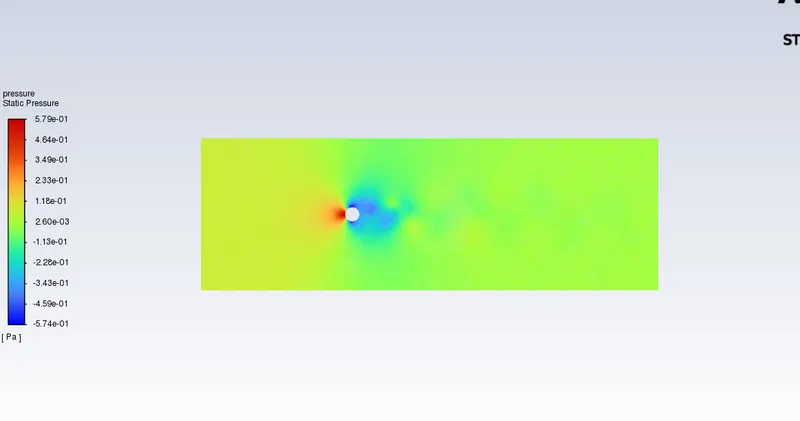
Pressure contour:
Transient state
Reynolds number = 10.
velocity = 1 m/s.
density = 1 kg/m3.
viscosity = 0.02 Pa-s.
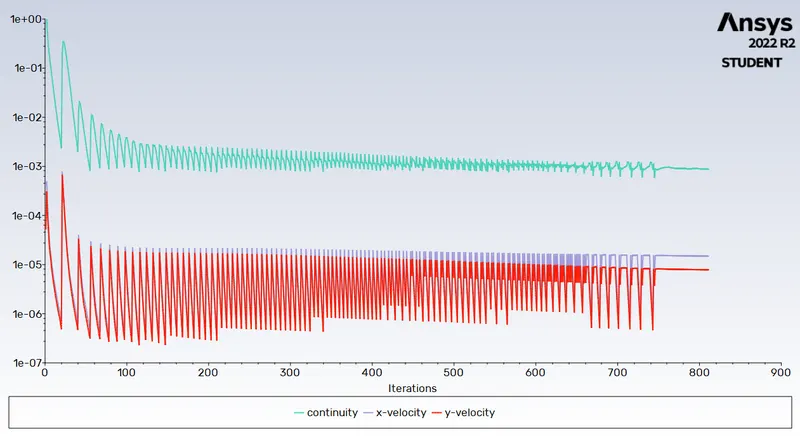
Residual plot:
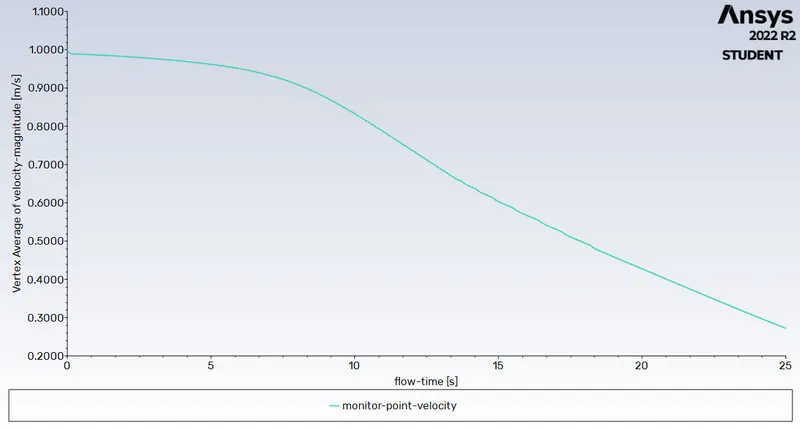
Monitor point velocity:
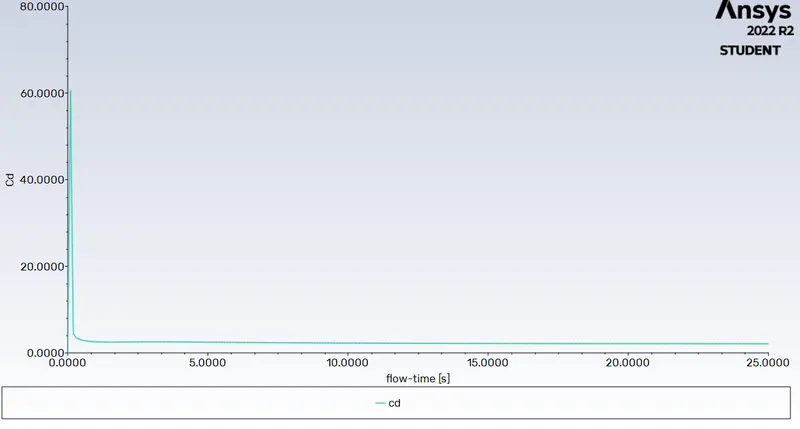
Coefficient of drag:
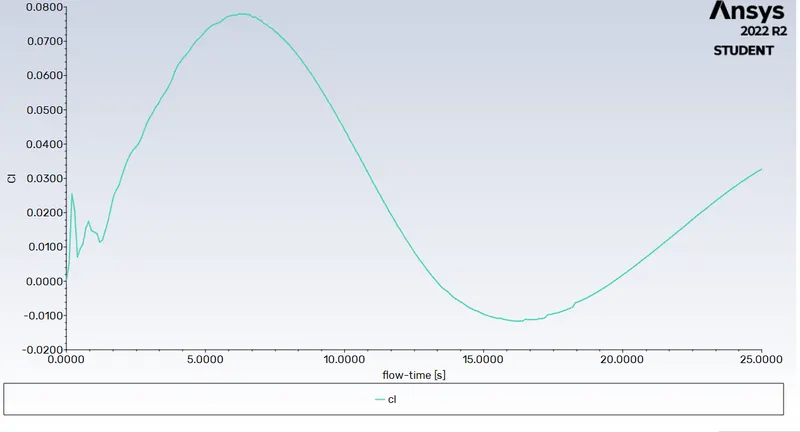
Lift Coefficient:
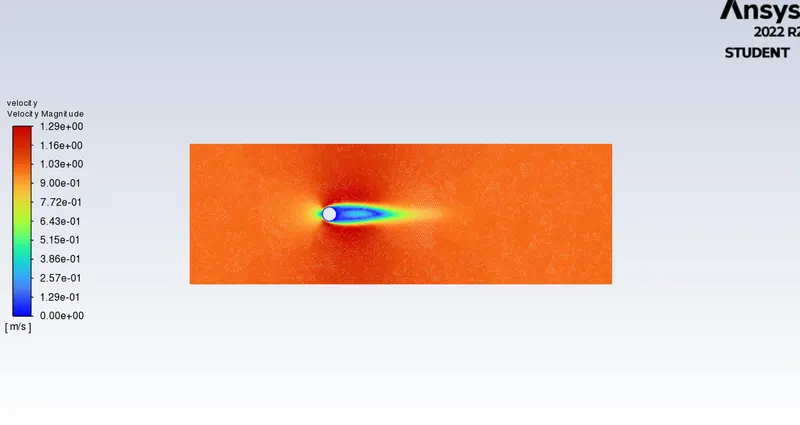
Velocity contour:
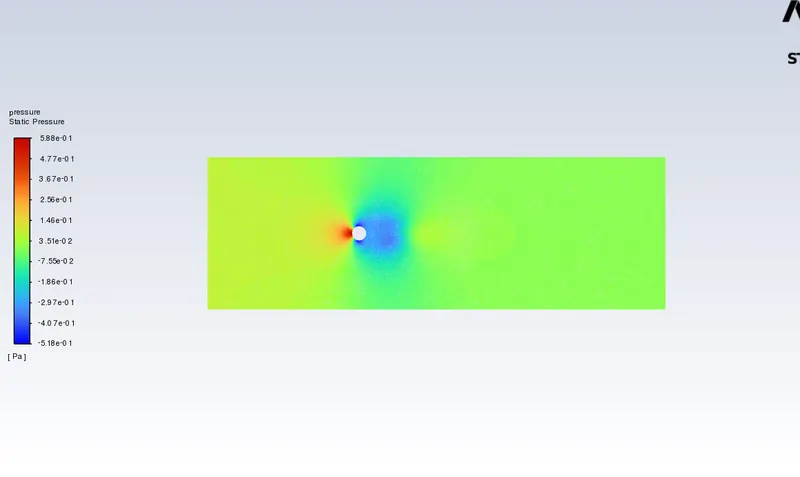
Pressure contour:
2. Reynolds number = 100.
velocity = 10 m/s.
density = 1 kg/m3.
viscosity = 0.02 Pa-s.
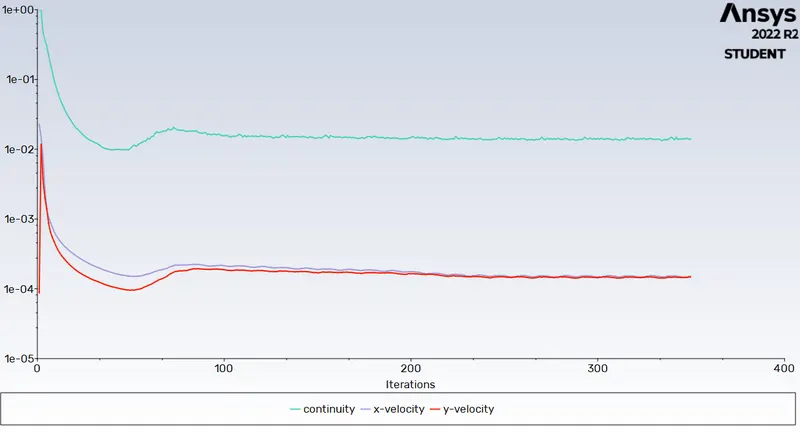
Residual plot:
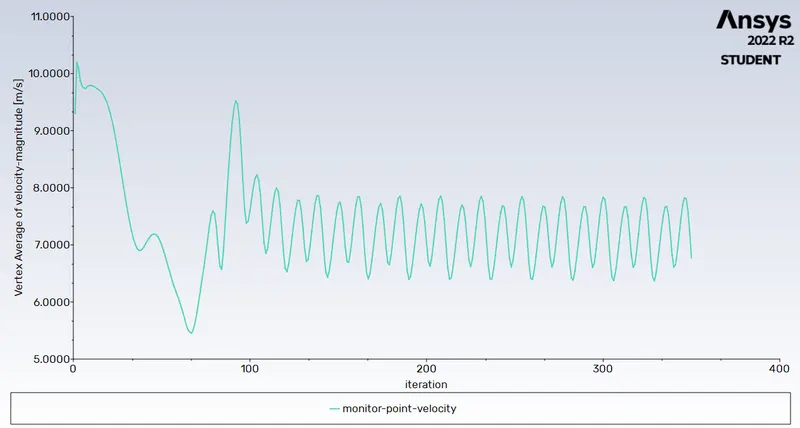
Monitor point velocity:
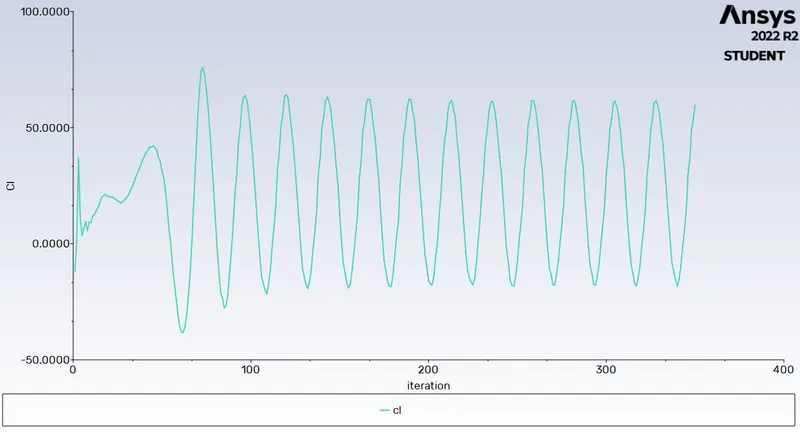
Lift Coefficient:
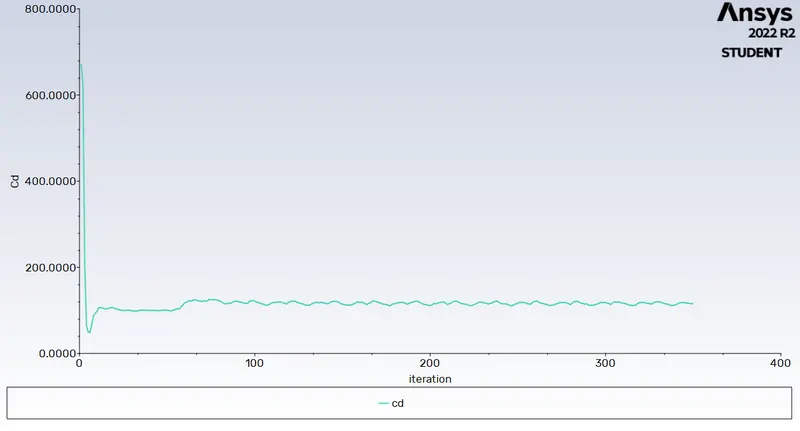
Coefficient of drag:
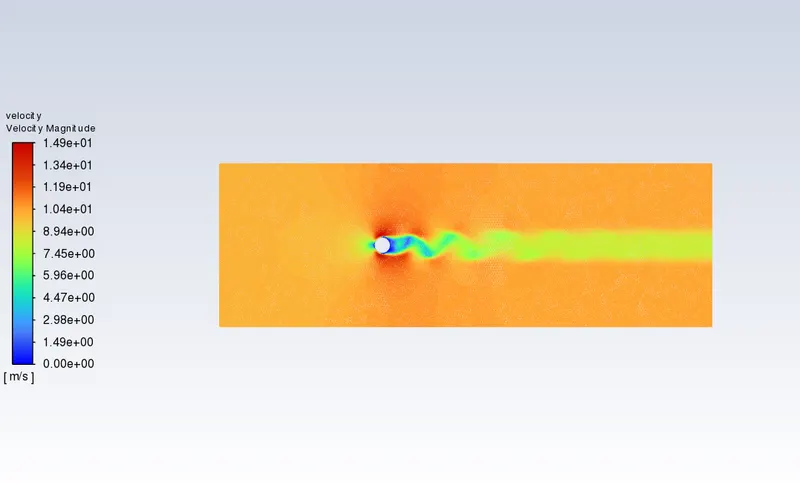
Velocity contour:
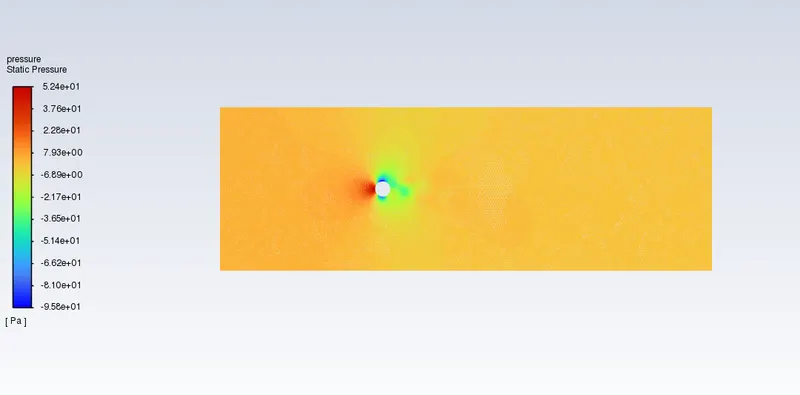
Pressure contour:
Transient state
Reynolds number = 100.
velocity = 10 m/s.
density = 1 kg/m3.
viscosity = 0.02 Pa-s.
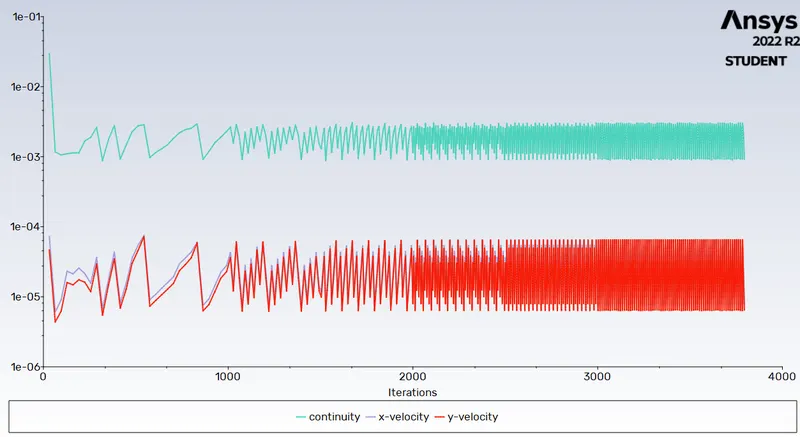
Residual plot:
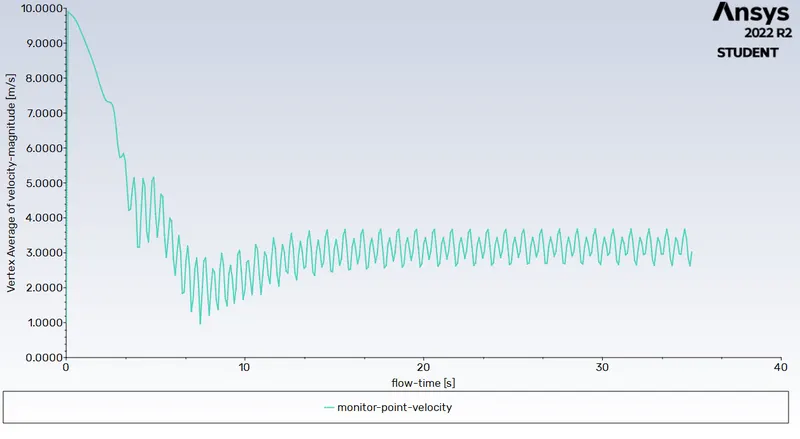
Monitor point velocity:
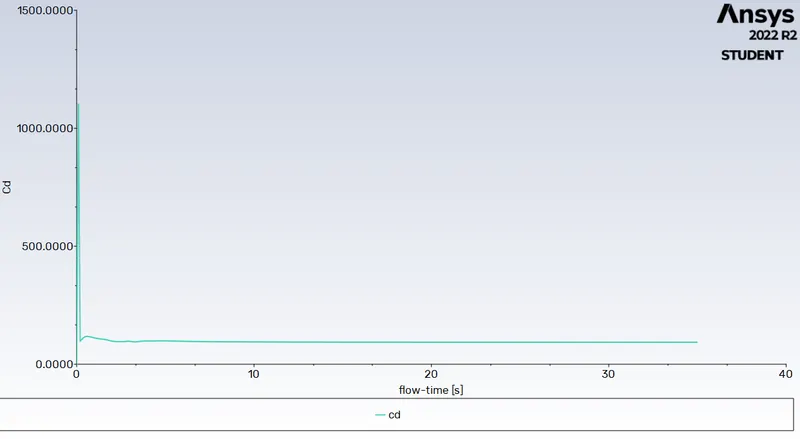
Coefficient of drag:
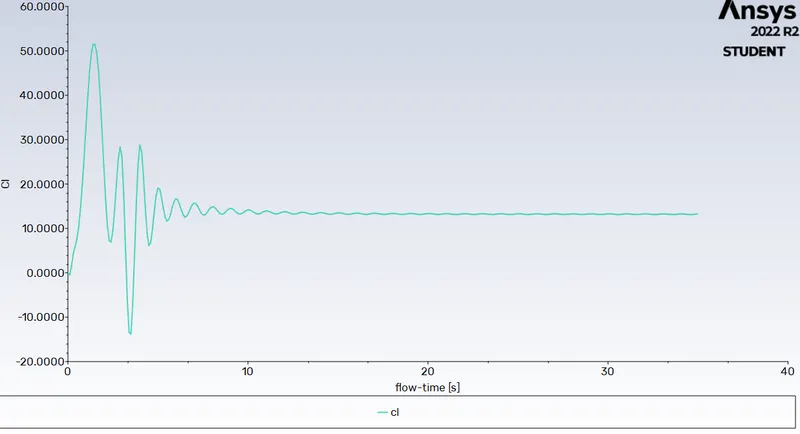
Lift Coefficient:
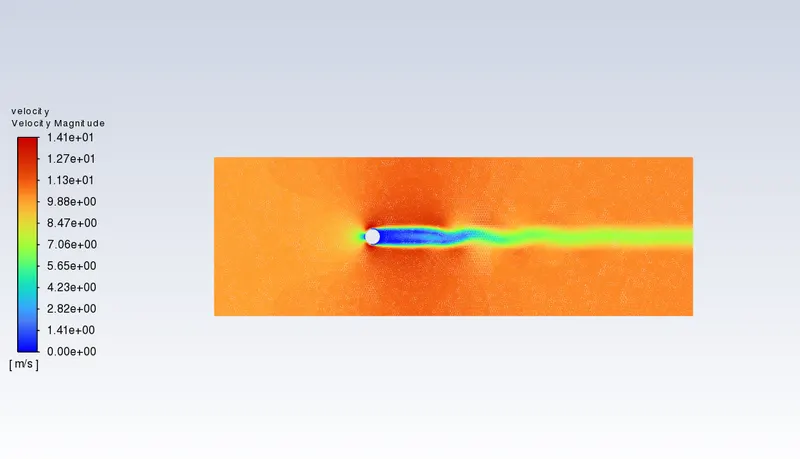
Velocity contour:
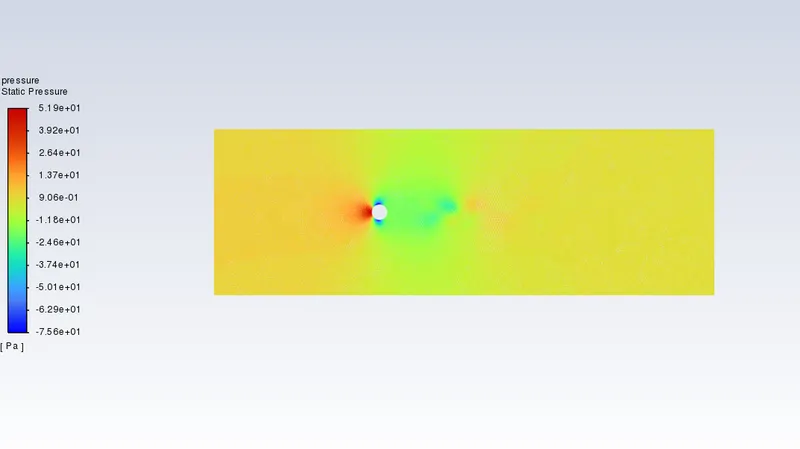
Pressure contour:
3. Reynolds number = 1000.
velocity = 100 m/s.
density = 1 kg/m3.
viscosity = 0.02 Pa-s.
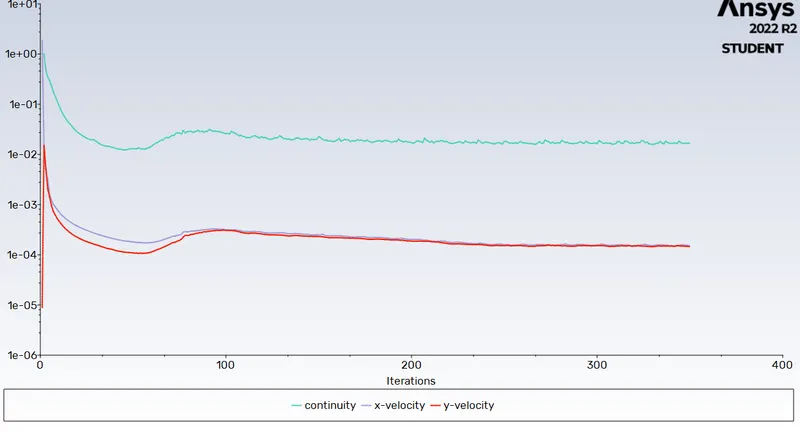
Residual plot:
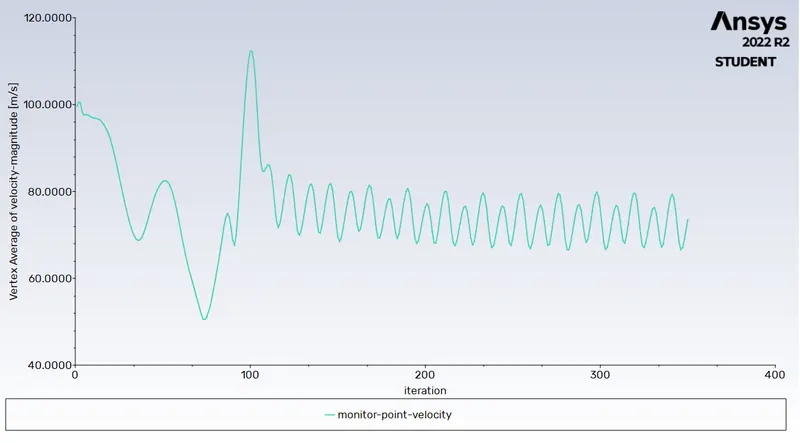
Monitor point velocity:
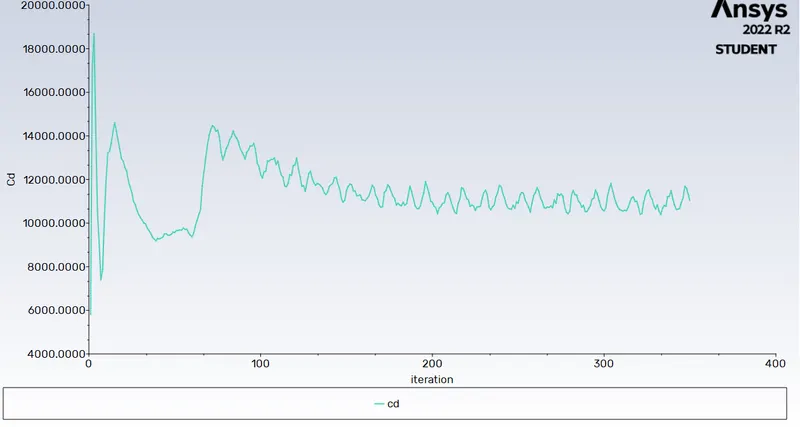
Coefficient of drag:
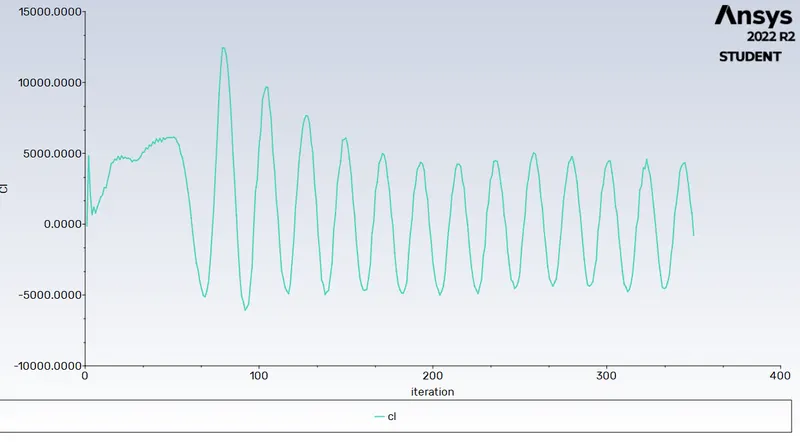
Lift Coefficient:
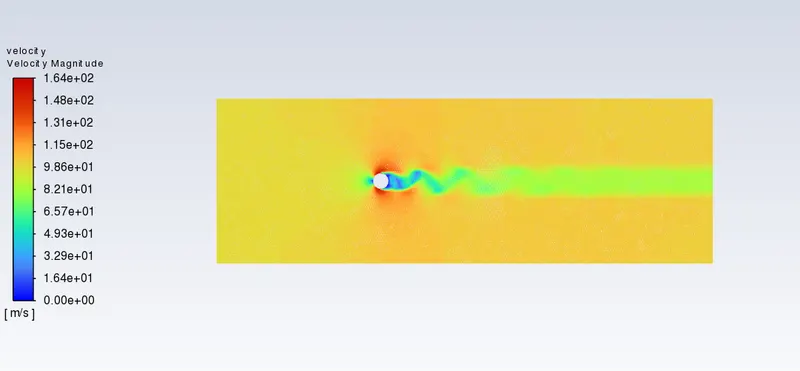
Velocity contour:
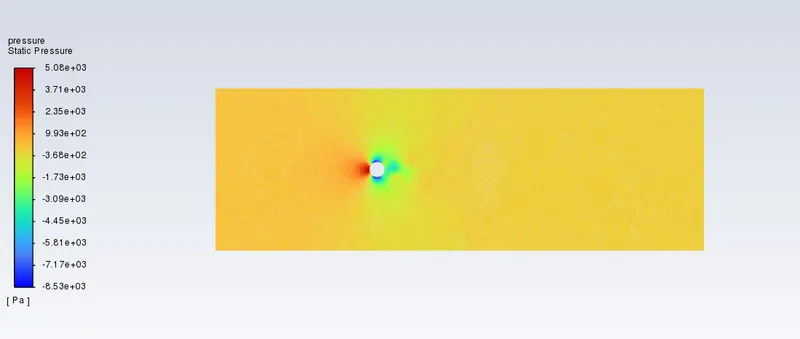
Pressure contour:
Transient state
Reynolds number = 1000.
velocity = 100 m/s.
density = 1 kg/m3.
viscosity = 0.02 Pa-s.
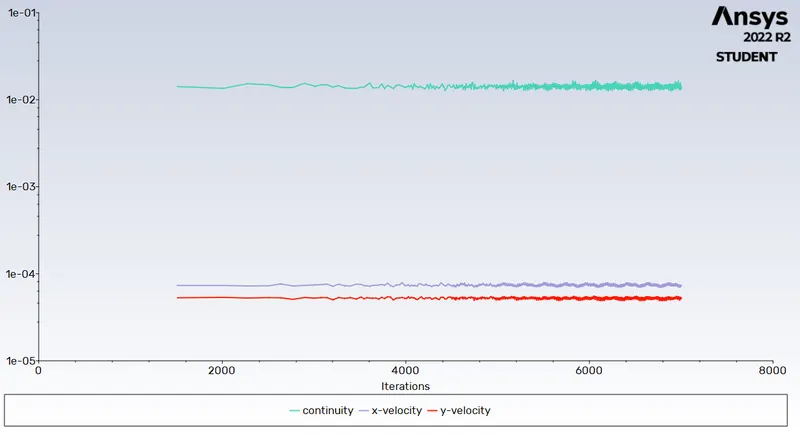
Residual plot:
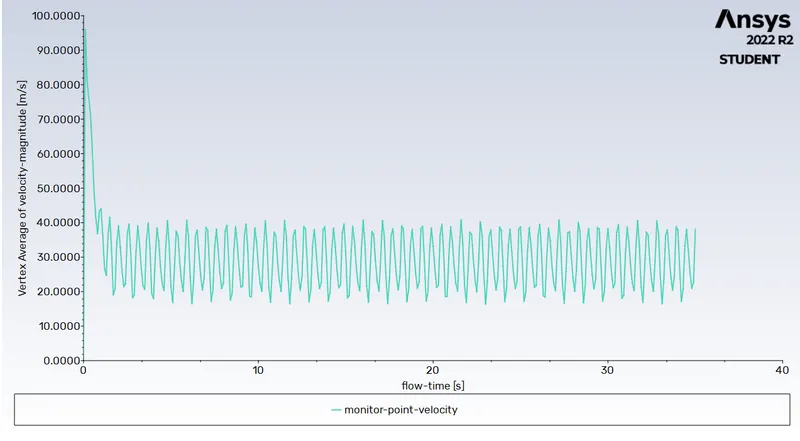
Monitor point velocity:
Coefficient of drag:
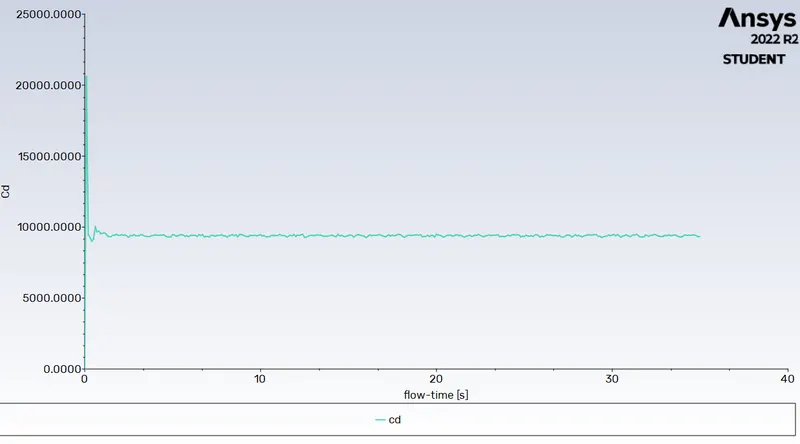
Lift Coefficient:
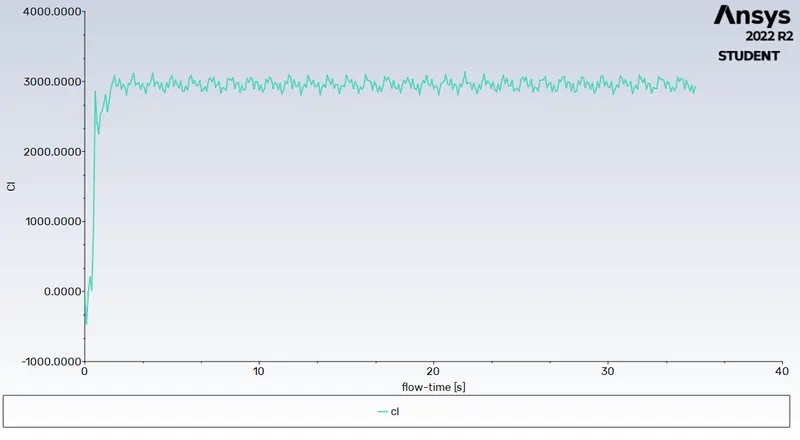
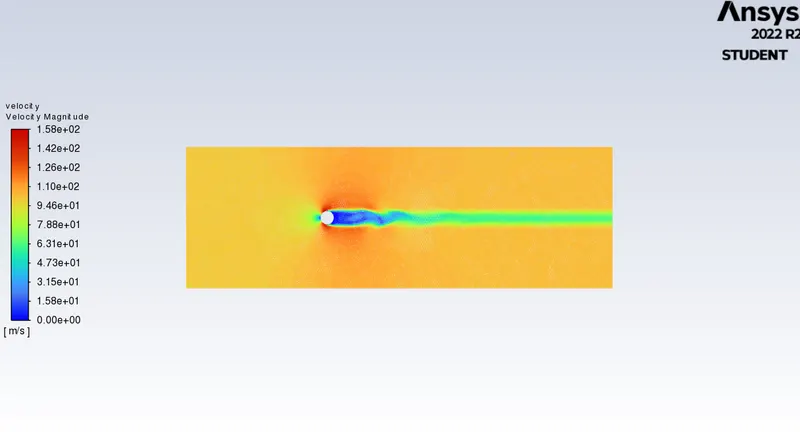
Velocity contour:
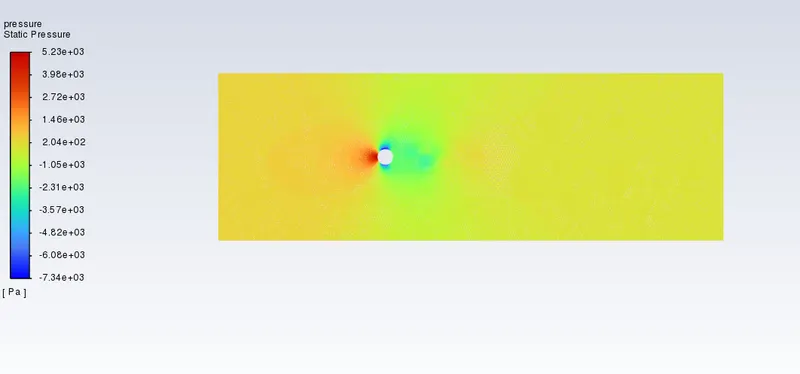
Pressure contour:
4. Reynolds number = 10000.
velocity = 1000 m/s.
density = 1 kg/m3.
viscosity = 0.02 Pa-s.
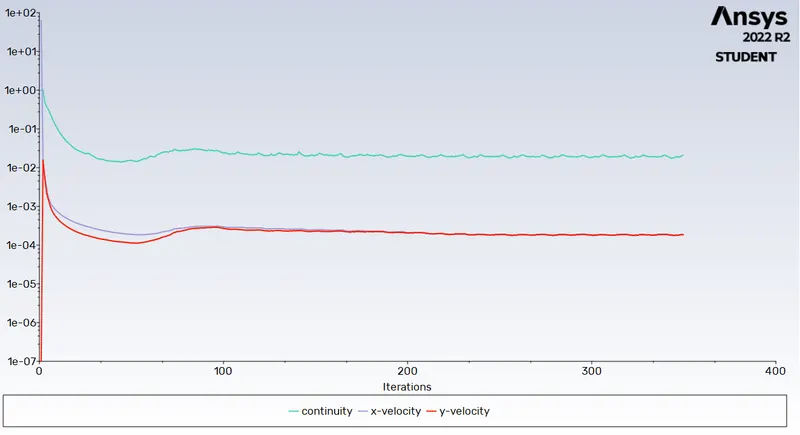
Residual plot:
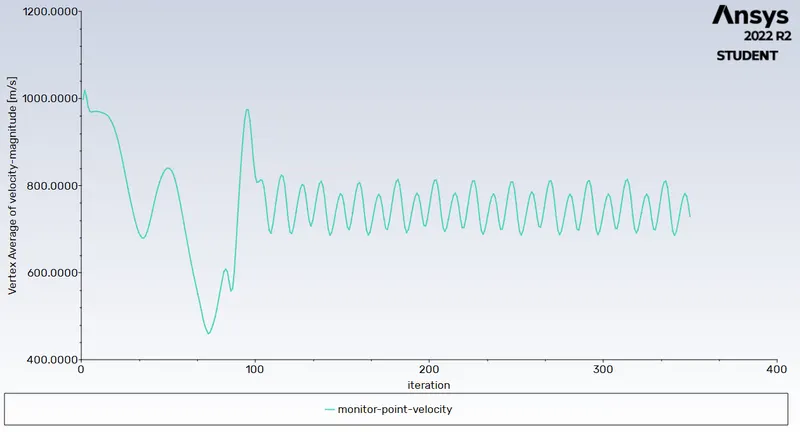
Monitor point velocity:
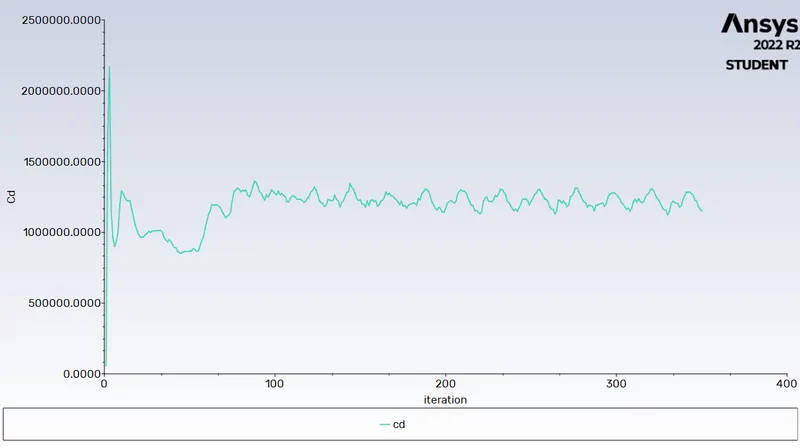
Coefficient of drag:
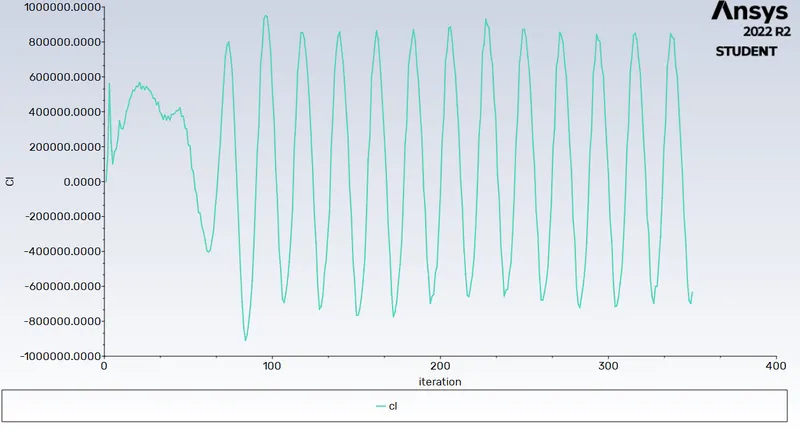
Lift Coefficient:
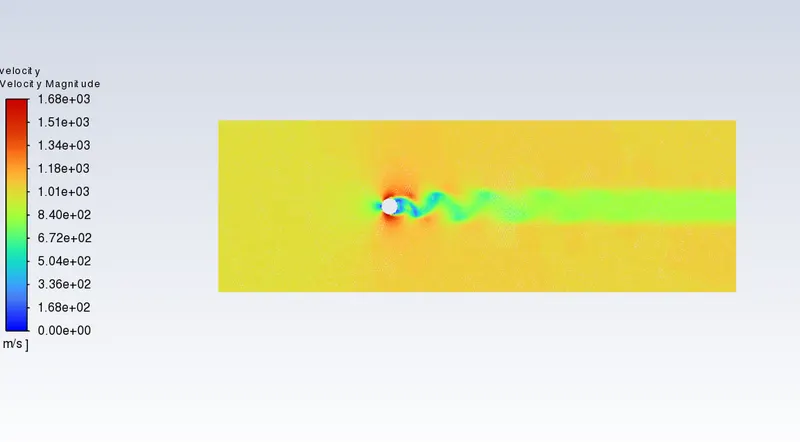
Velocity contour:
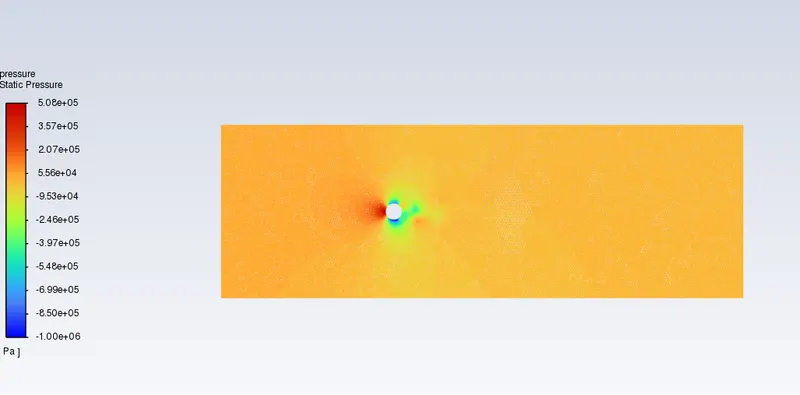
Pressure contour:
Transient state
Reynolds number = 10000.
velocity = 1000 m/s.
density = 1 kg/m3.
viscosity = 0.02 Pa-s
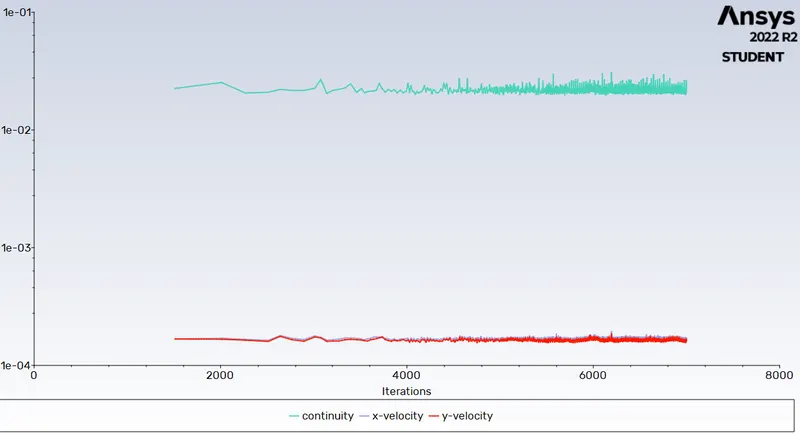
Residual plot:
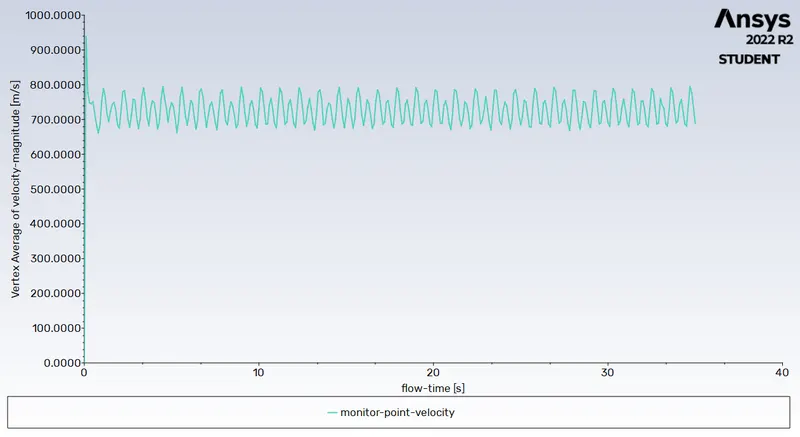
Monitor point velocity:
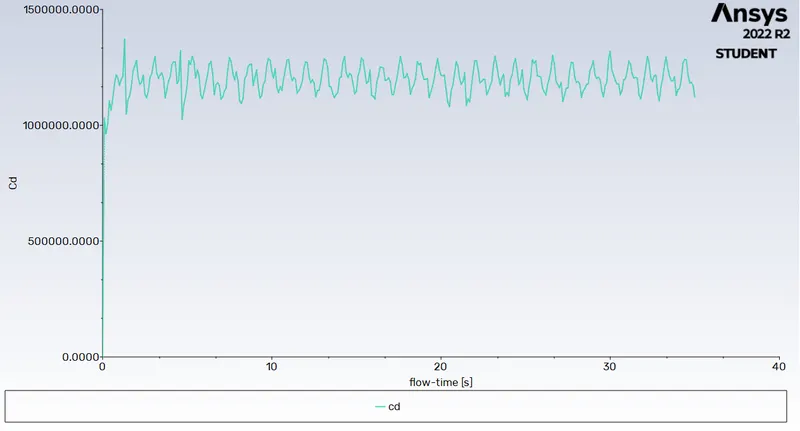
Coefficient of drag:
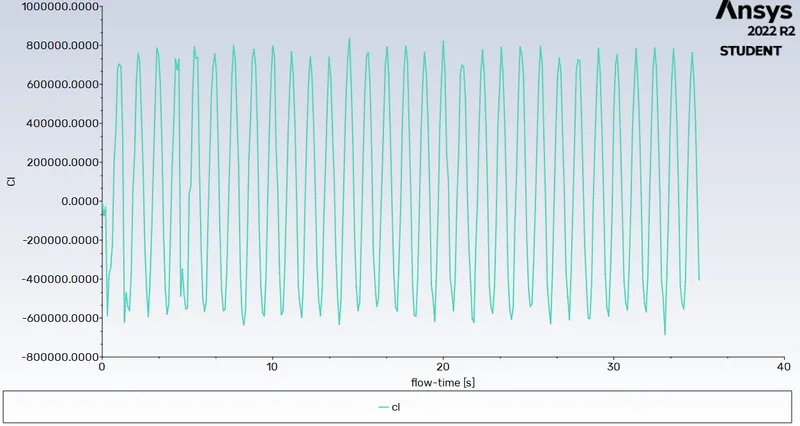
Lift Coefficient:
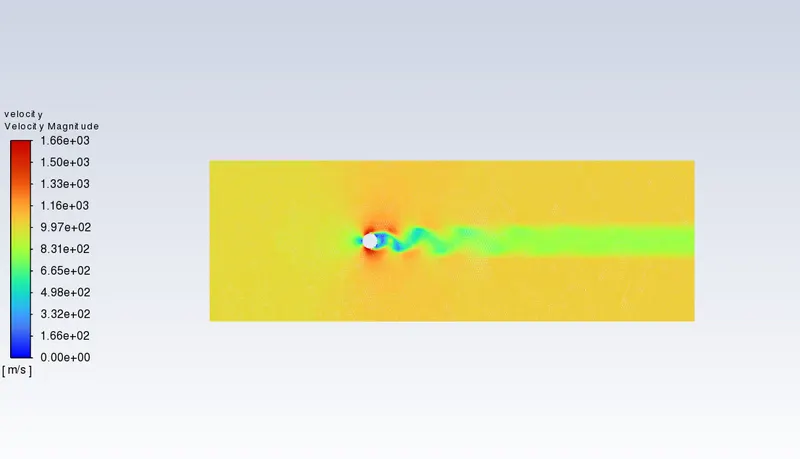
Velocity contour:
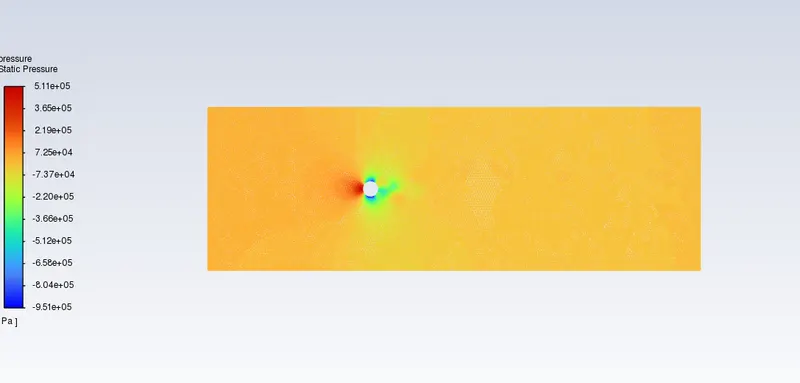
Pressure contour:
5. Reynolds number = 100000.
velocity = 10000 m/s.
density = 1 kg/m3.
viscosity = 0.02 Pa-s.
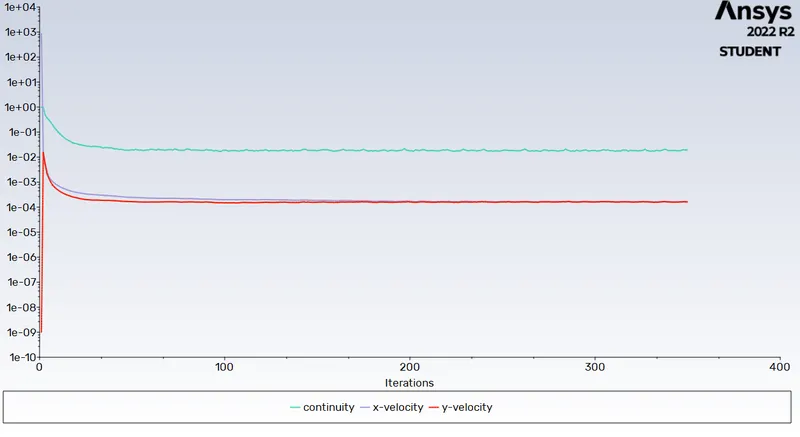
Residual plot:
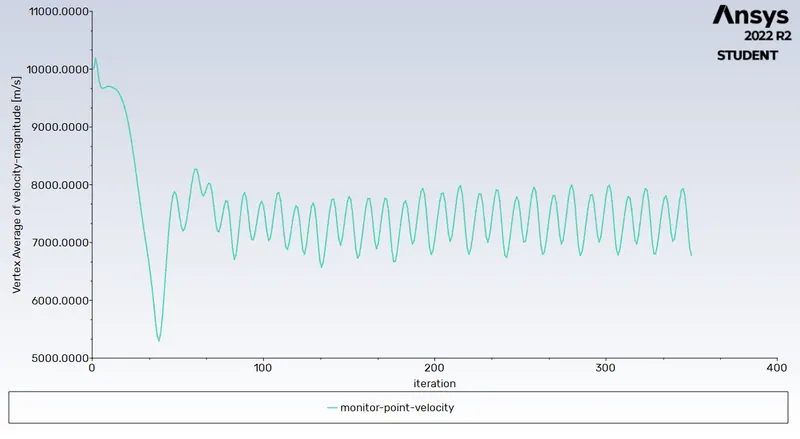
Monitor point velocity:
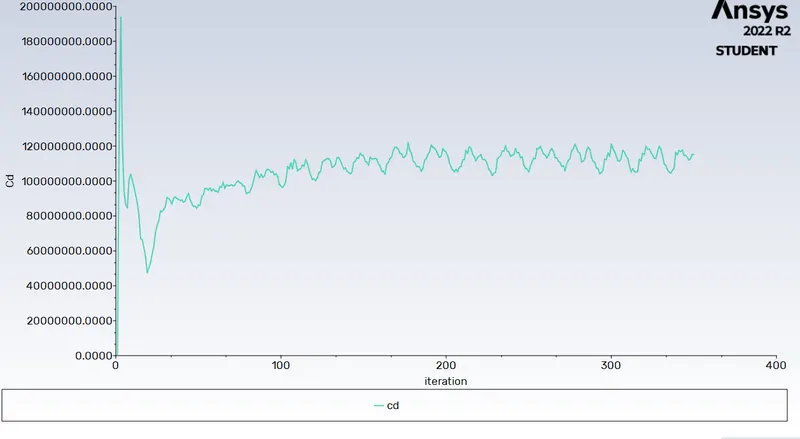
Coefficient of drag:
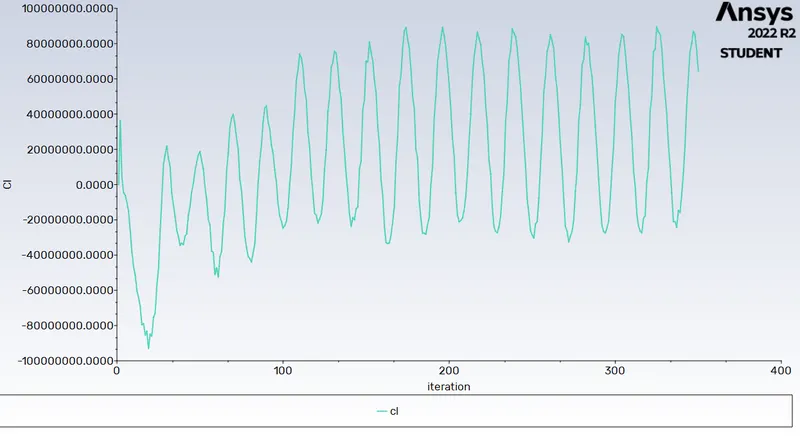
Lift Coefficient:
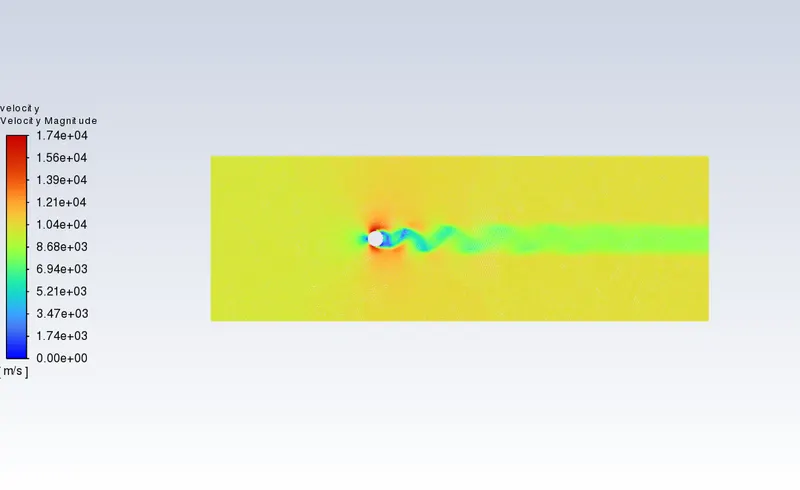
Velocity contour:
Pressure contour:
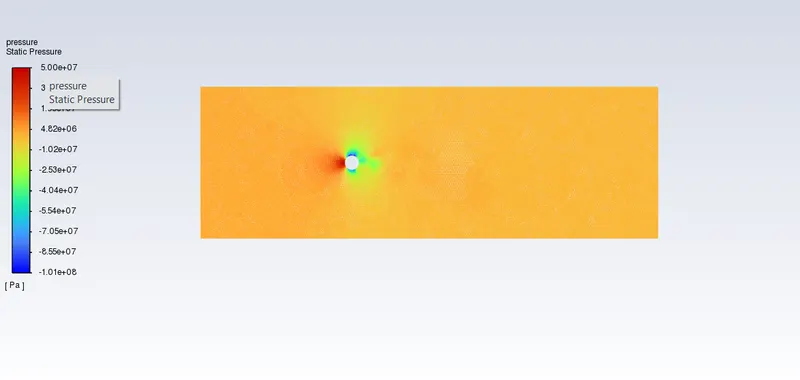
- From the above plots and contours we can see that as the value of reynolds number increased further the wake region is characterized by a pair of counter rotating vortices that remain attached.
- At higher Reynolds number ,as the wake becomes unstable,the viscous forces are no longer sufficient to squash these disturbances.
- The vortex street simulation may probably never get our results fully converged.Thus we need alternate options to see our results are converged or not.If we look at the residual plots,we can't determine the solution convergence.
- But from the velocity magnitude plots,we can see the repeation of velocity frequency after certain number of iterations for each run. Which validates our confidence in converged results.
Effect of Reynolds number on Drag:
-
As it can be seen through the results,the coefficient of drag keeps decreasing whe the reynolds number is increasing.
-
This is because flow becomes turbulent for reynolds number greater than 2000,which means laminar flow though present is negligible leading to a lower skin friction drag.
-
For low reynolds number(Re=10),the alternating vertices cannot be visualized due to the low velocity values.
- Re = 10
At very slow flow there is no separation of flow and no wake downstream of the cylinder, as we have neglected viscosity.But this type of flow does not occur in nature,where there is always some small amount of viscosity is present in the fluid.
- Re = 100
Stable vortices are formed.The flow is separated but steady. The vortices generate a high drag on the cylinder.
- Re = 1000As the flow velocity increases,the down stream vortices becomes unstable,separate from the body and are alternatively shed from the downstream.The wake is wide and generate large amount of drag.
- Re = 10000
The flow velocity is increased even more and the periodic flow breaks down into chaotic wake.The flow is laminar and orderly while on the back side of the cylinder,it is turned into a chaotic wake causing drag.
- Re = 100000
The boundary layer transioned into turbulent flow and vortices of different scales are being shed in the wake region.But since the separation point is slightly downstream from the laminar separation point,which cause a slightly smaller wake and the drag is than the corresponding laminar drag.
Conclusion:
- The Karman Vortex Street phenomenon for flow over a cylinder is studied
- Increasing velocity eventually brings the turbulent drag up to and even higher than laminar drag value,but during transition from laminar to turbulent ,there is a range of reynolds number,for which turbulent drag is less than laminar drag.
- Vortex shedding can be seen in the case of both steady and transient simulation.But transient simulation produces better and more realistic results.
- As the reynolds number increases coefficient of drag decreases.however after reynolds no. = 4000, flow is turbulent and hence coefficient of drag is lower.
- Strauhal number calculated for unsteady state with reynolds number = 100 is 0.11.