Week 2 - Flow over a Cylinder.
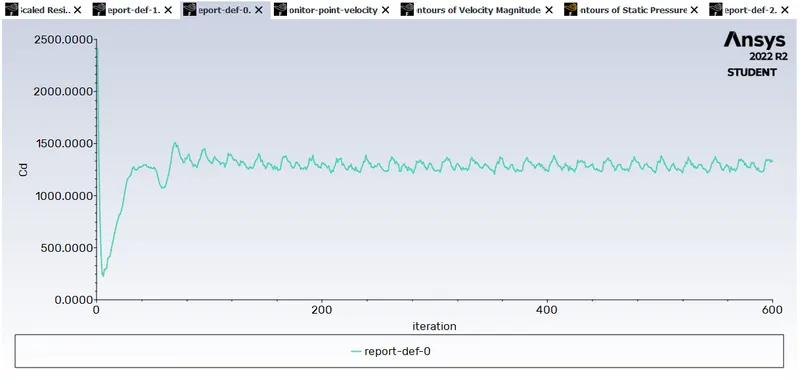
- Simulate the flow over a cylinder and explain the phenomenon of Karman vortex street. Calculate the coefficient of drag and lift over a cylinder by setting the Reynolds number to 10,100,1000,10000 & 100000.Discuss the effect of Reynolds number on the coefficient of drag. [ Results should be validated with any standard literature and error should be within 5 %].
- Objective - To Simulate the flow over a cylinder and explain the phenomenon of Karman vortex street. The Calculate the coefficient of drag and lift over a cylinder by setting the Reynolds number to 10,100,1000,10000 & 100000. Discuss the effect of Reynolds number on the coefficient of drag .
- Strouhal Number
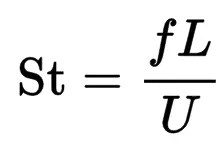 whereby, f is the frequency of the vortices,
L is the diameter of the cylinder and U is the airflow velocity
- Reynolds number
 Re is reynolds number
Rho is density of the fluid
 is flow speed , L is length
 is dynamic viscosity of the fluid
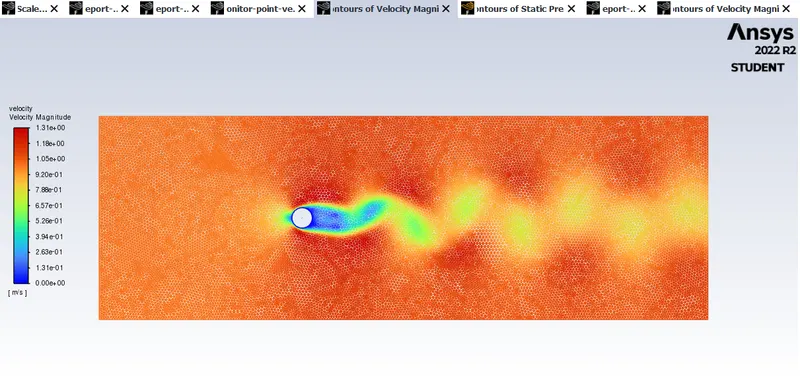
- Phenomenon of Karman vortex street.
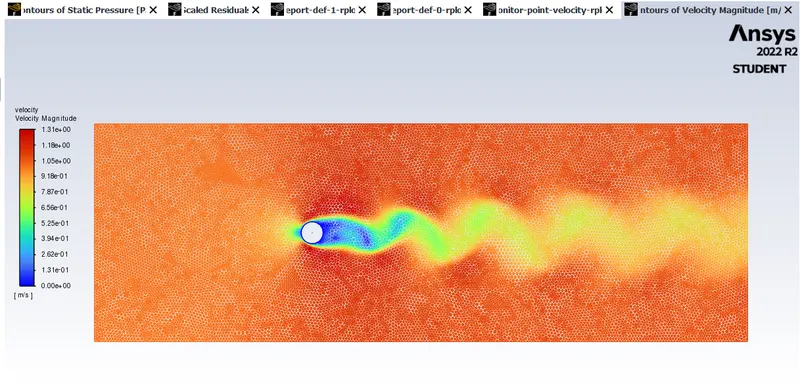
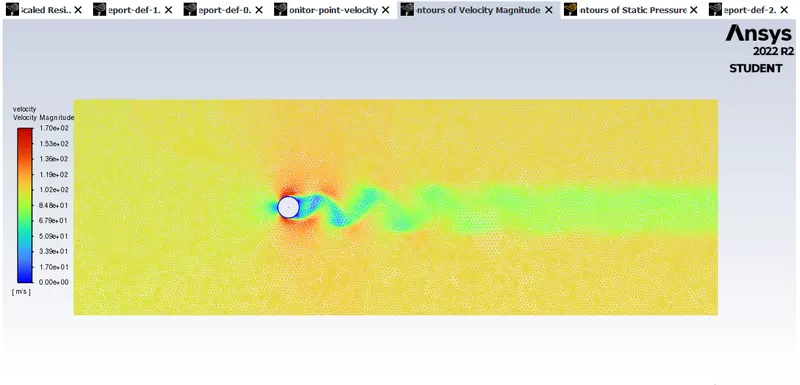
- In fluid dynamics, a Karman (or von Karman) vortex street is a repeating pattern of swirling vortices caused by a process known as vortex shedding that causes unstable separation of fluid flow around blunt bodies.
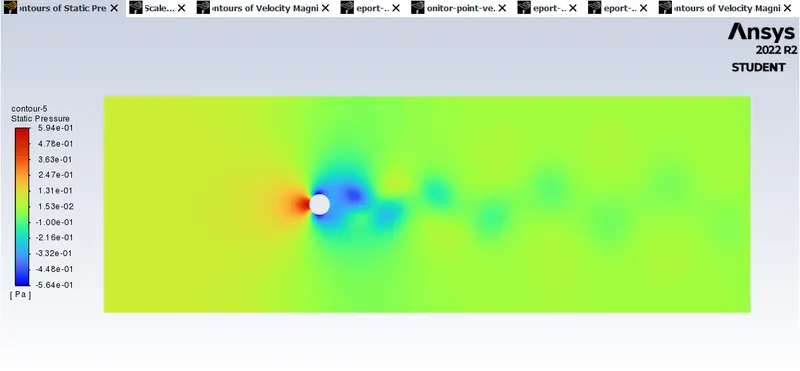
- Vortex shedding occurs when the wind blows across a structural member and vortices are released alternately left and right, creating alternating zones of low pressure on the leeward side of the structure, resulting in fluctuating forces acting perpendicular to the structure. phenomenon that occurs in wind direction .
-
The flow is said to be steady when flow parameters do not change with time.
The flow is said to be unsteady when flow parameters changes with time. - Coefficient of drag
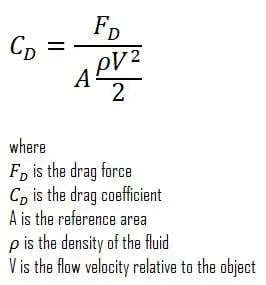
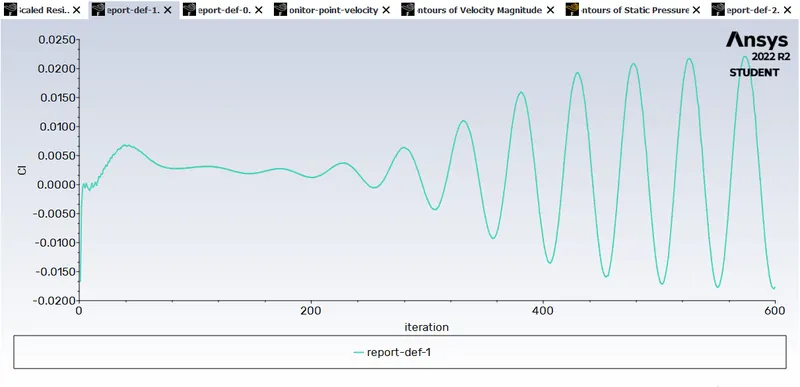
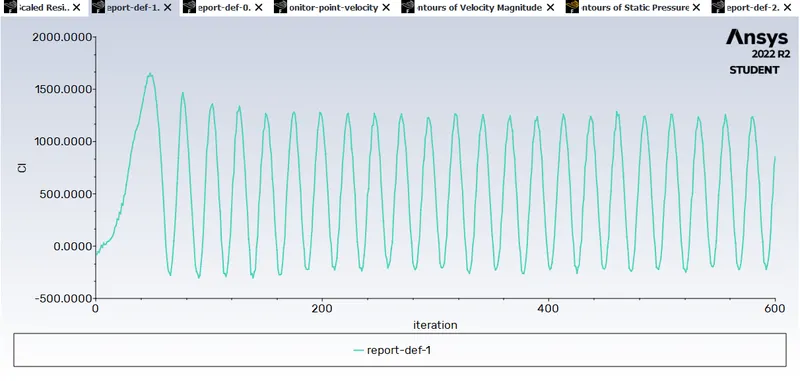
- Coefficient of lift
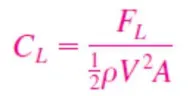 Fl is lift force
- Procedure
- Geometry
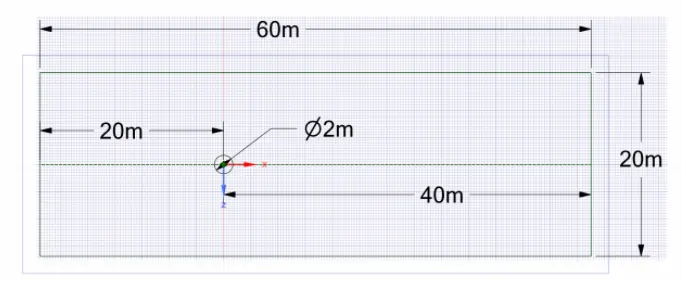
- Created domain around geometry
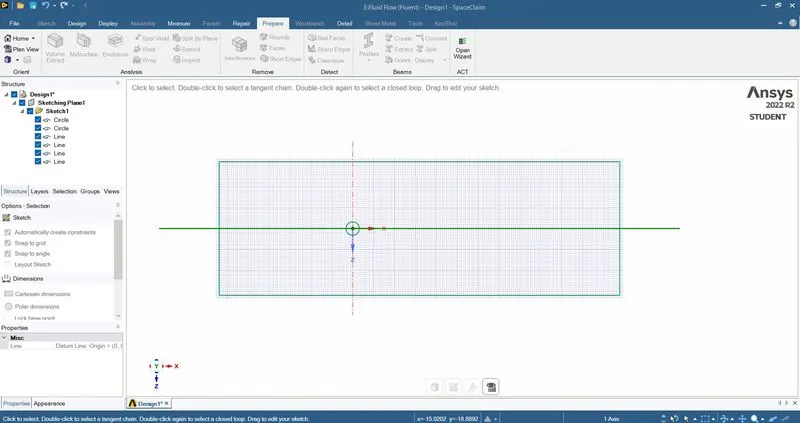
- Pull option is used
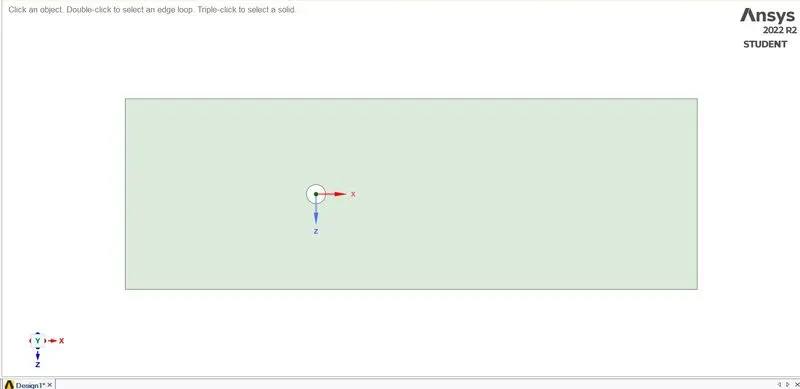
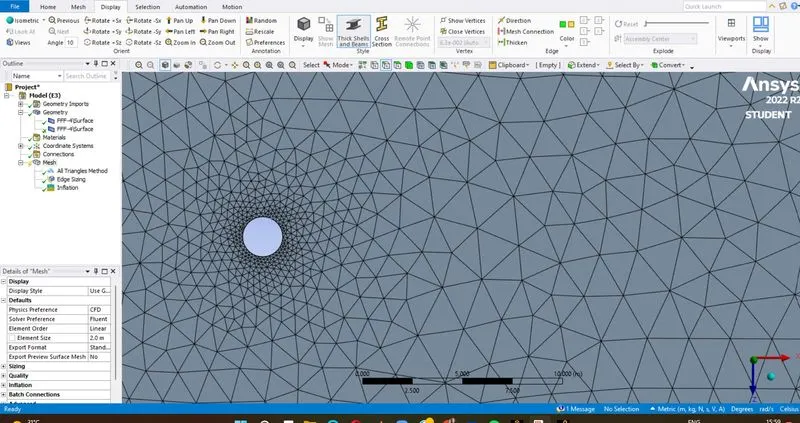
- Meshing
- Triangular Mesh
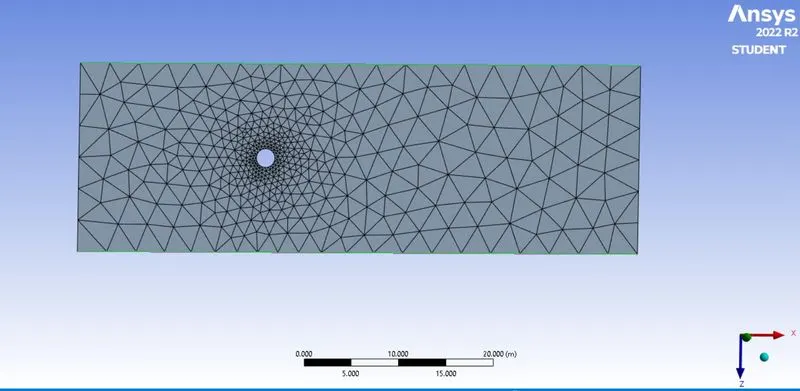
- Sizing
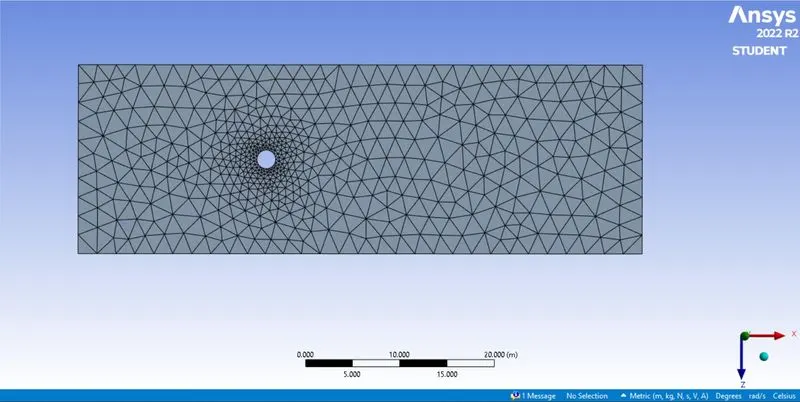
- Mesh with 0.25 element size
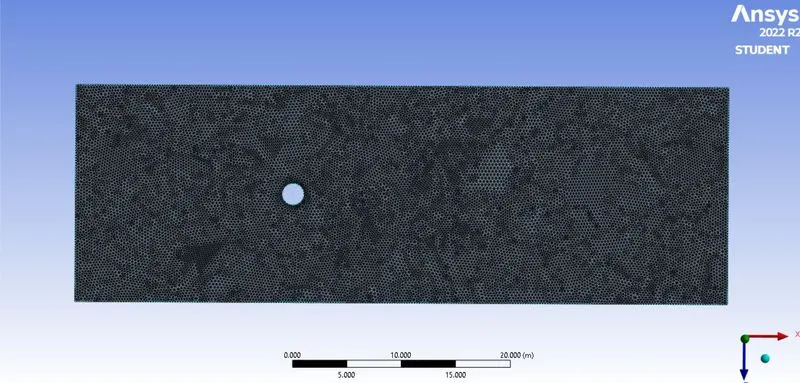
- Mesh with 2mm element size
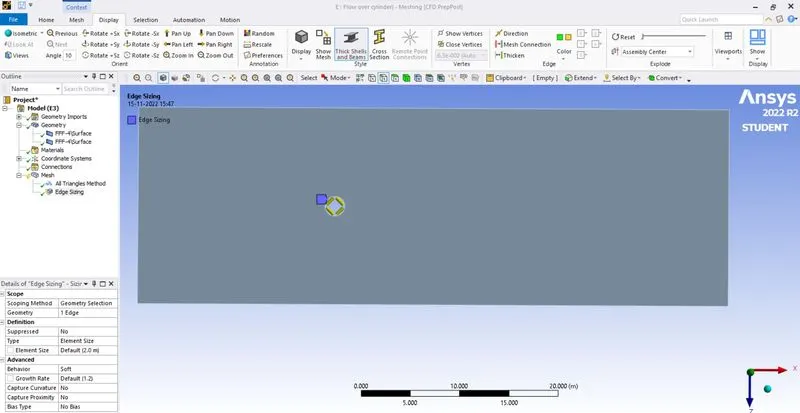
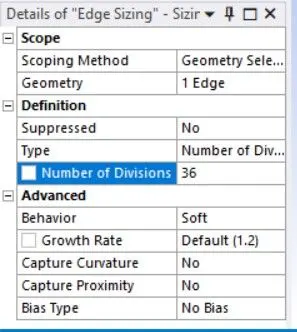
- Edge sizing
- Inflation
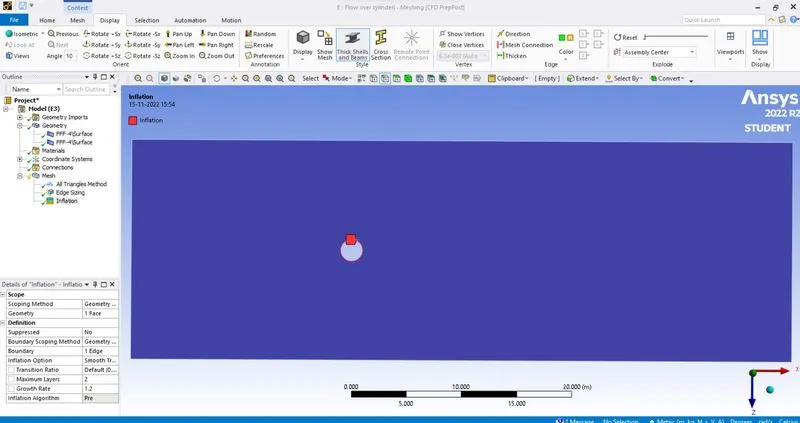
- Inflation with 5e-3
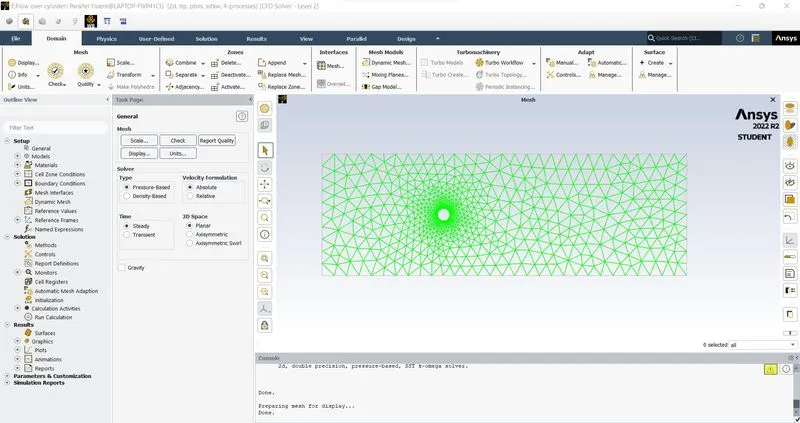
- Setup
- Solution
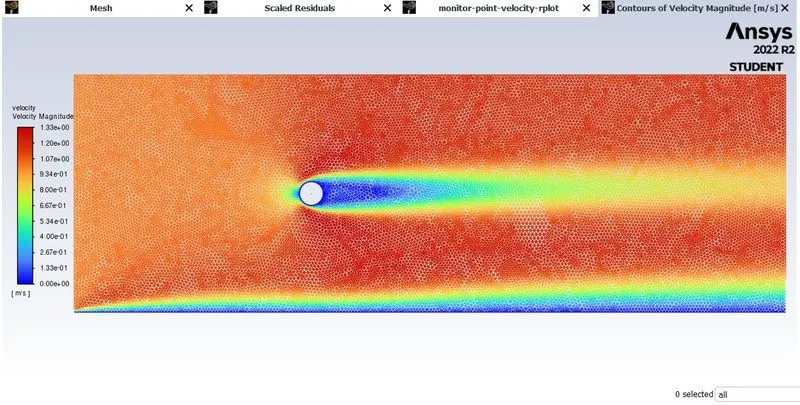
- Residuals
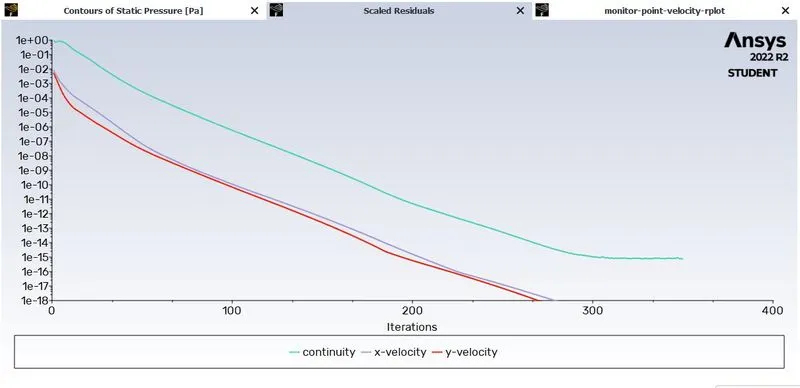
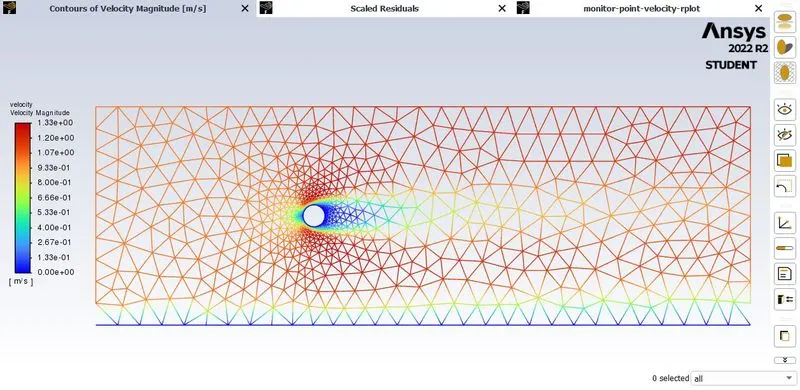
- Contour of velocity magnitude
- Residuals
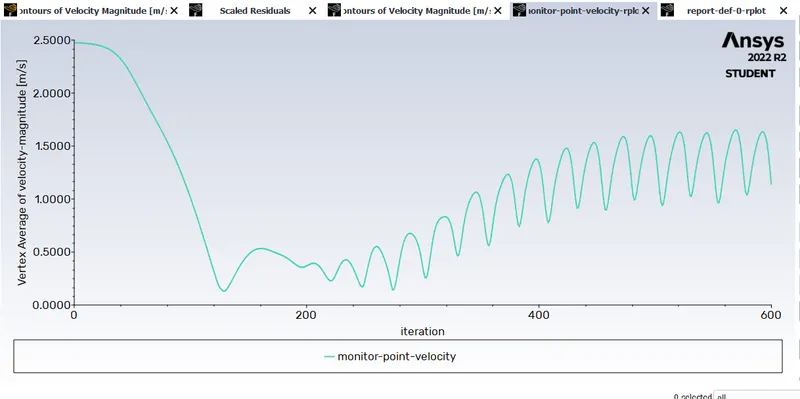
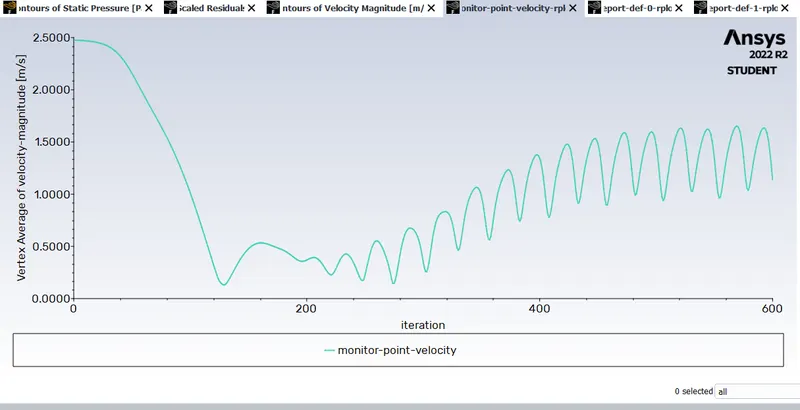
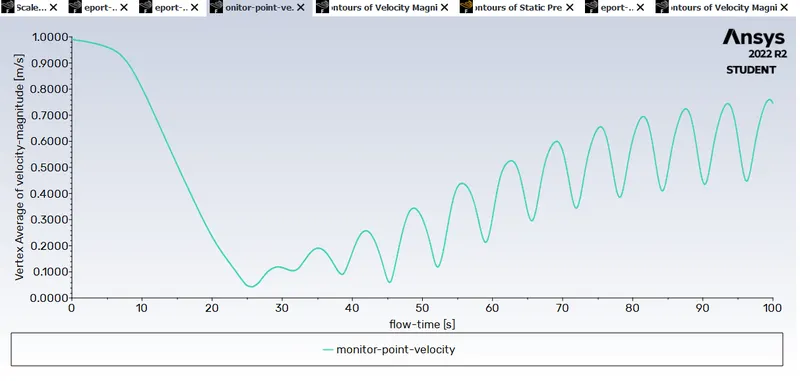
- Monitor point velocity point
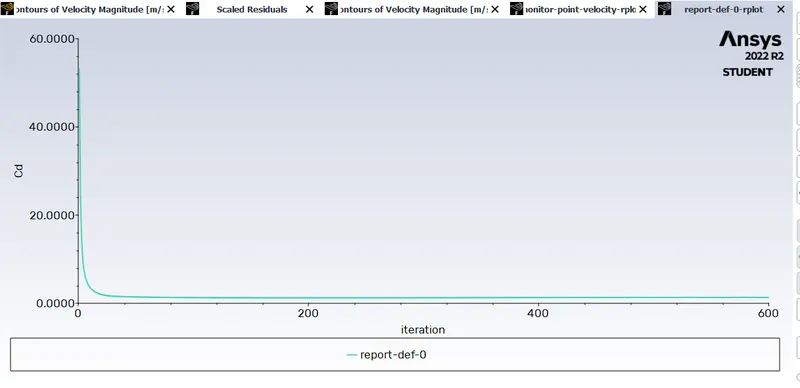
- Coefficient of drag plot
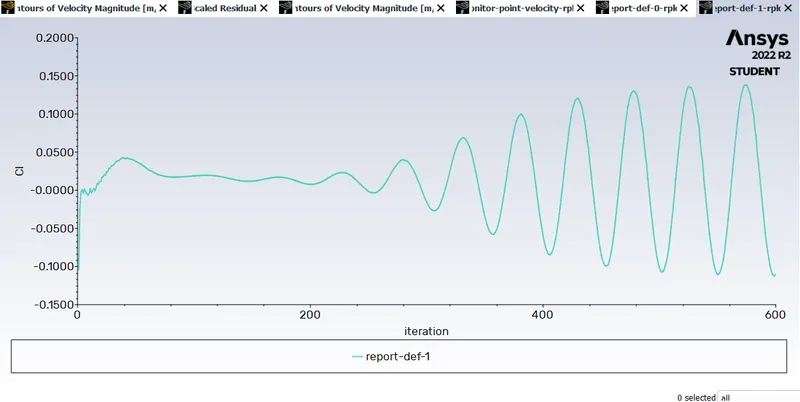
- Coefficient of Lift plot
-
Steady state simulation:
1.Reynolds number = 100.
velocity = 1 m/s.
density = 1 kg/m3.
viscosity = 0.02 Pa-s.
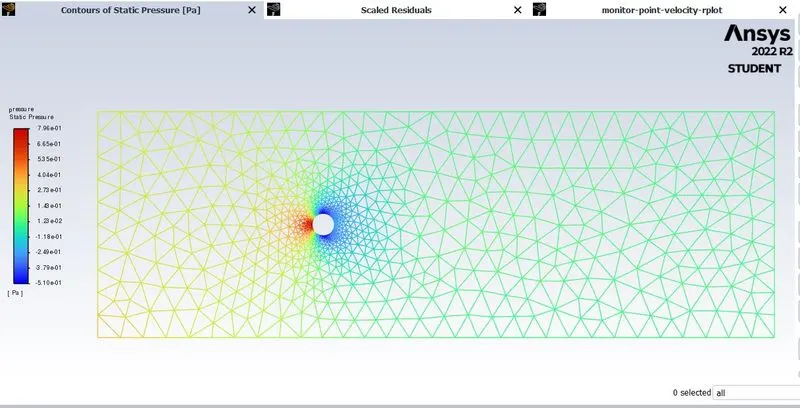
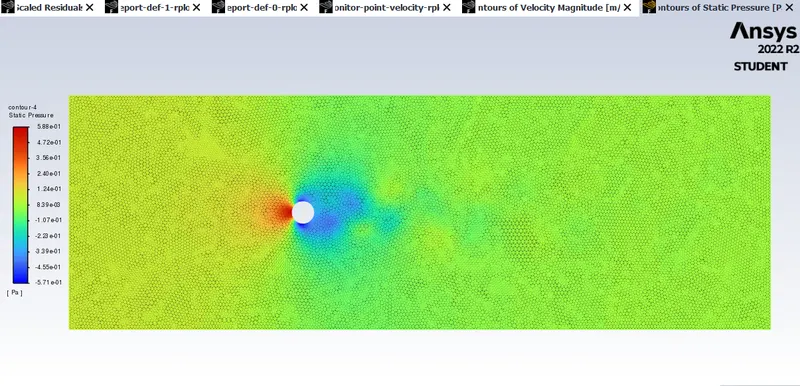
- Pressure contour
- Velocity contour
- Coefficient of lift plot
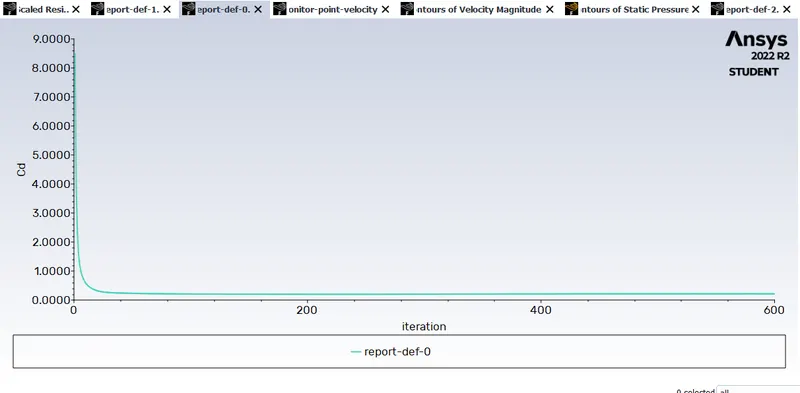
- Coefficient of drag plot
-
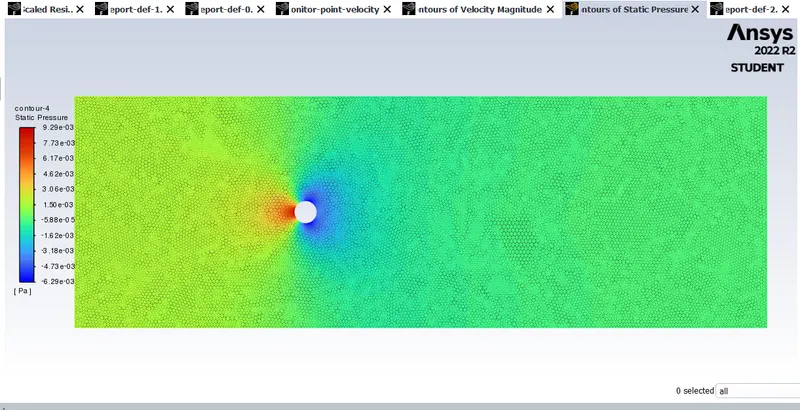
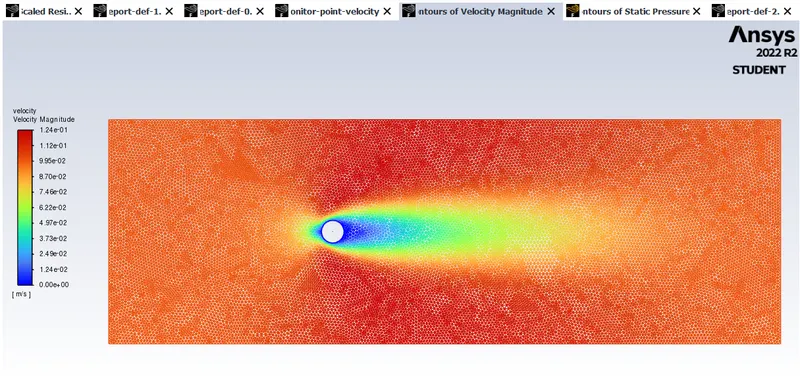
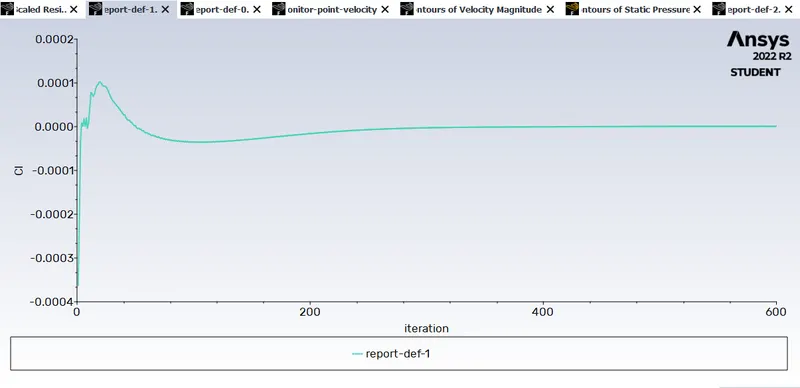
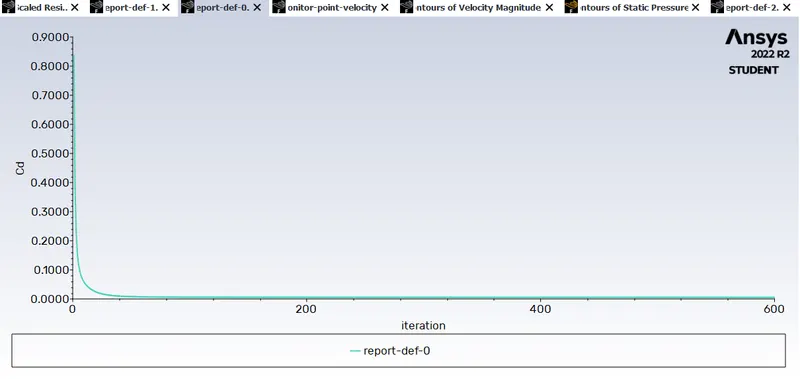
Reynolds number = 10.
velocity = 0.1 m/s.
density = 1 kg/m3.
viscosity = 0.02 Pa-s.
-
Pressure contour
- Velocity contour
- Coefficient of Lift
- Coefficient of drag
-
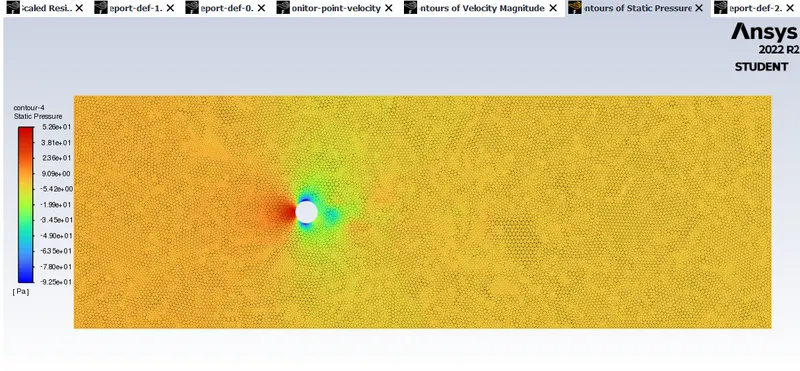
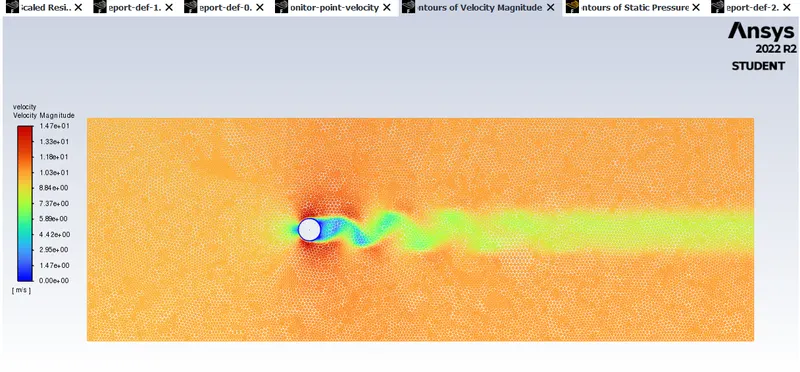
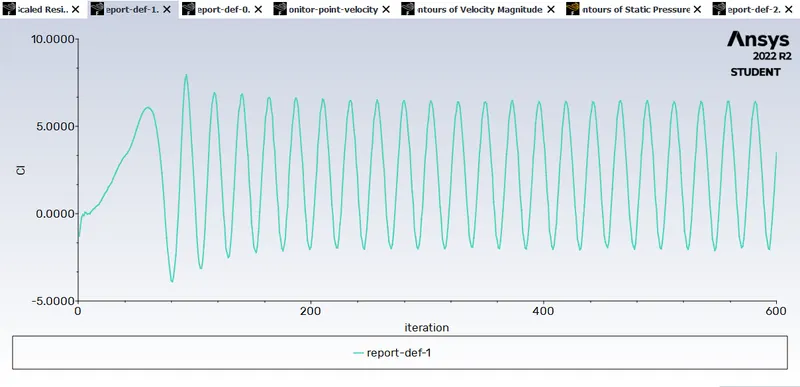
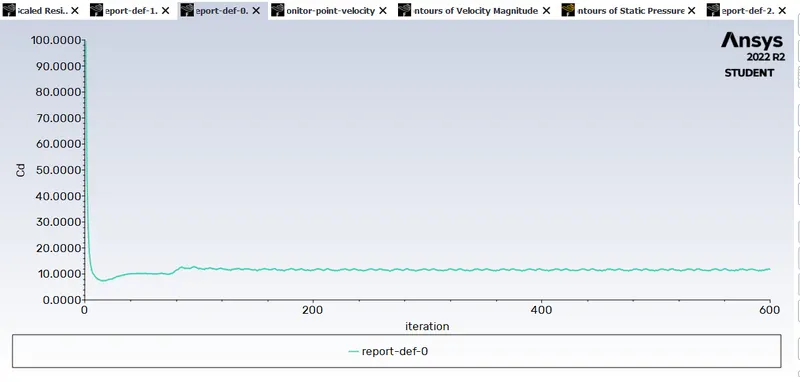
Reynolds number = 1000.
velocity = 10 m/s.
density = 1 kg/m3.
viscosity = 0.02 Pa-s.
- Pressure contour
- Velocity contour
- Coefficient of lift
- Coefficient of drag
-
Reynolds number = 10000.
velocity = 100 m/s.
density = 1 kg/m3.
viscosity = 0.02 Pa-s.
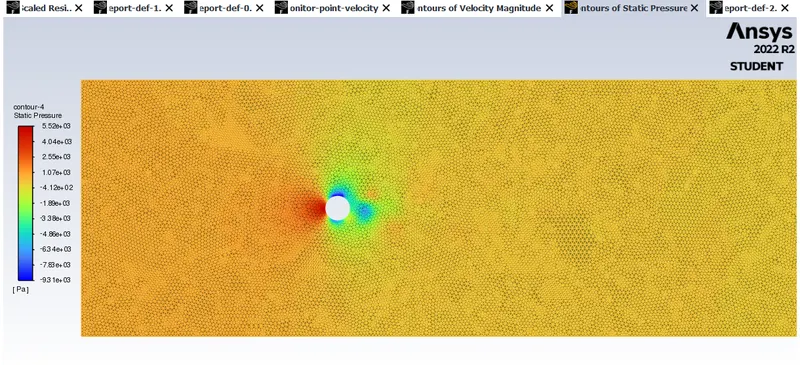
- Pressure contour
- Velocity contour
- Coefficient of lift
- Coefficient of drag
-
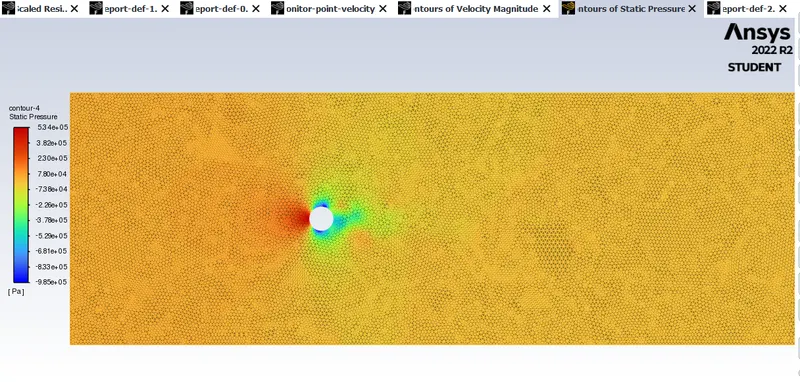
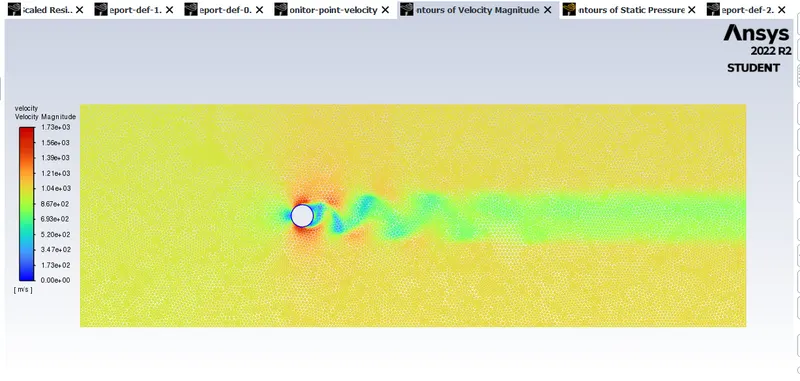
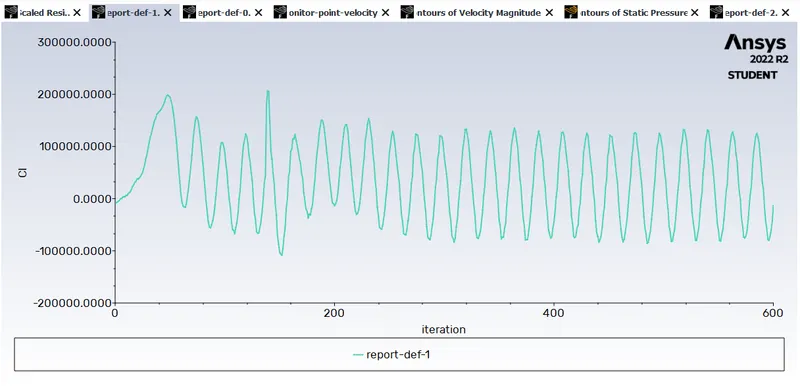
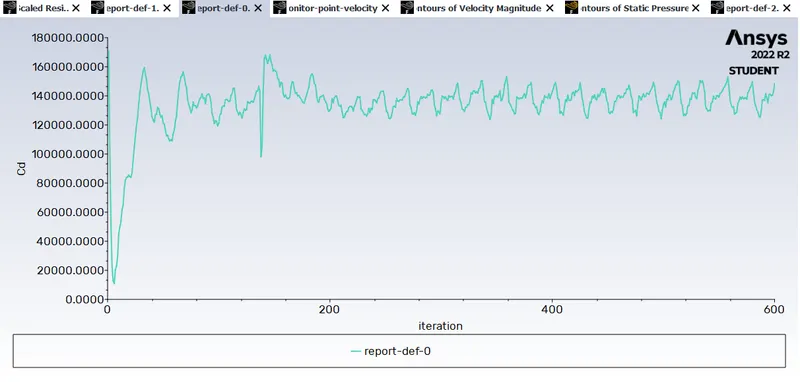
Reynolds number = 100000.
velocity = 1000 m/s.
density = 1 kg/m3.
viscosity = 0.02 Pa-s.
-
Pressure contour
- Velocity contour
- Coefficient of lift
- Coefficient of drag
- Stepwise explaination
- A panel with dimensions 20*60m is created in spaceclaim.
- Then simulate the effect of fluid flow across the cylinder, select the circle and delete it.
- Select the edges of the geometry and name them Inlet, Outlet, Wall and Symmetry.
- Now select the body, go to Mesh and click Generate 0.25m mesh. To reserve a triangle mesh, go to Mesh > Insert > Select Triangle Mesh Type.
- After generating the mesh, you can see that the circle size looks distorted
Select Mesh > Dimensions > Circle edge > Go to Define > Type > Number of divisions > 36. - For better results near cylinder walls, go to Mesh > Inflation > Select Body and Boundary > Inflation Options: 1st Layer Thickness > 1st Layer Height: 5e-3m > Max Layer : 6
- Solution:
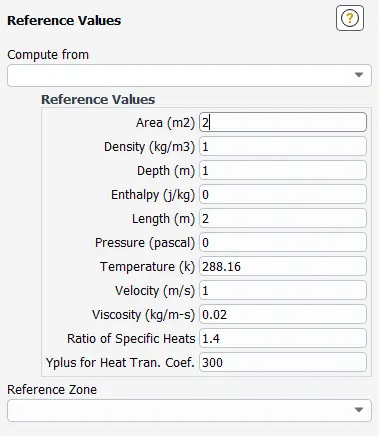
- Select laminar flow in viscosity model. I wanted to adjust the material properties for the simulation, so go to Materials > Fluid Database > Select Material (Air) > Copy > Rename Material.
Boundary condition:
Exit: Overpressure = 0 Pa.
wall : Non-slip condition.
- Plot the pressure and velocity contour with given reynolds number.
- Also plot the graph for coefficient of drag and coefficient of lift.
- Unstaedy state solver:
Reynolds number = 100.
velocity = 1 m/s.
density = 1 kg/m3.
viscosity = 0.02 Pa-s.
-
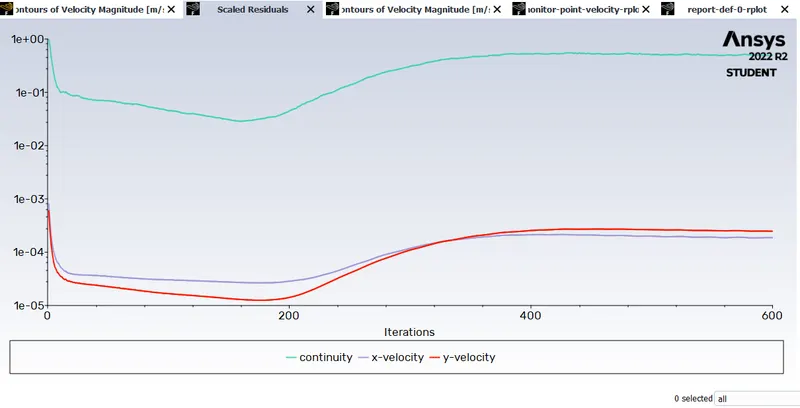
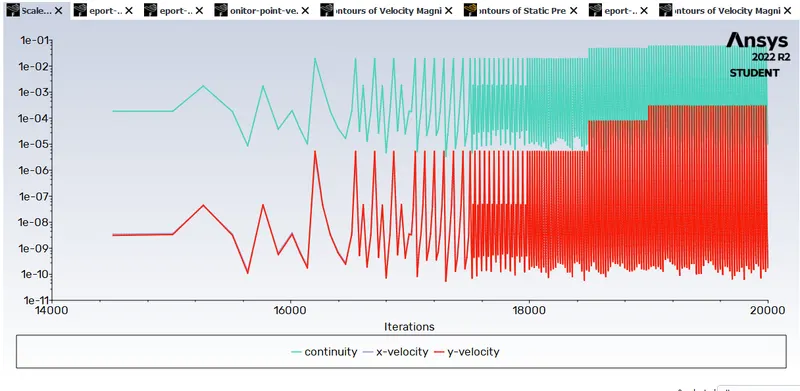
Residual plot
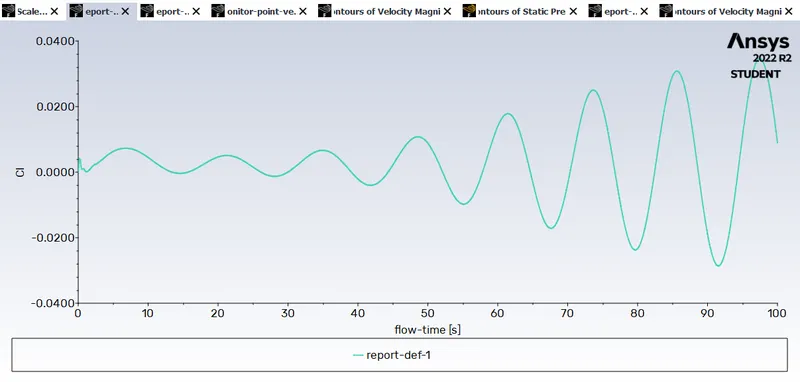
- Coefficient of lift
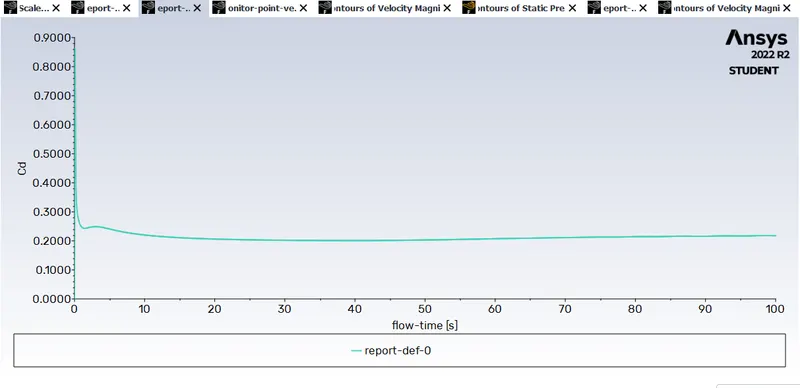
- Coefficient of drag
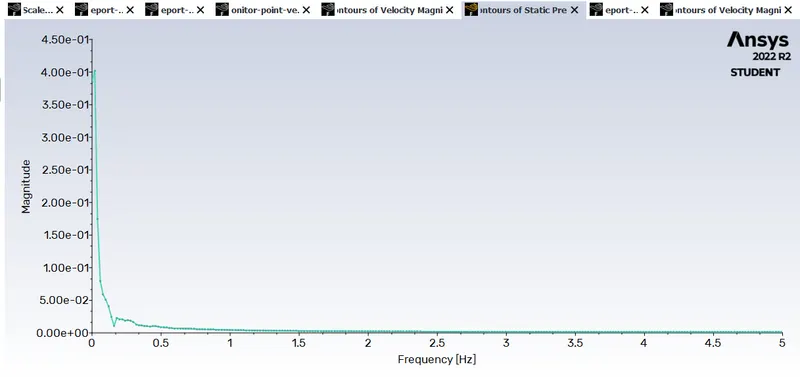
- Frequency vs magnitude plot
- Velocity contour
- Pressure contour
-
Strouhal number:
Strouhal number is a dimensionless number describing oscillating flow mechanisms.
The Strouhal number is often given as
St = f*d/u = 0.114
f is the frequency of vortex shedding,
L is the characteristic length and
U is the flow velocity.
- Strouhal number plot
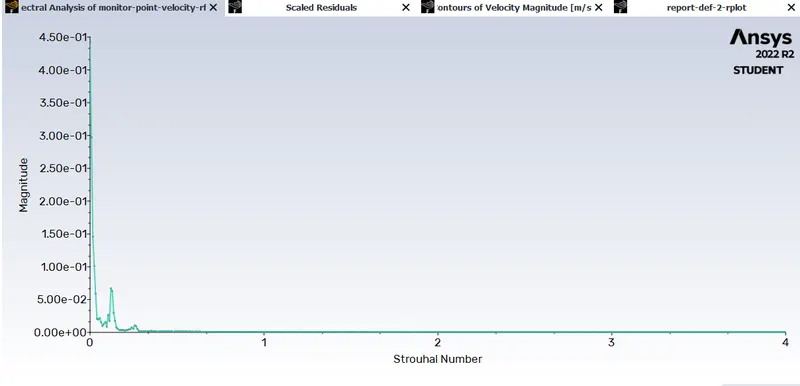
- Here, we used ansys fluent to calculate the strouhal no.
1. Go to Fluent Solver > Results > FFT Analyzer > Load Lift Coefficient Field > Select FFT Chart
where the x-axis represents the Strouhal number and the y-axis represents magnitude.
2. To get the magnitude of the Strouhal number, go to Results > fft analyzer, click Write fft to file, and click Write fft .
When you open the file in Excel, the first column is the frequency and the second column is the Strouhal number. Find the magnitude of the Strouhal number by selecting the second line using the max command.
- Conclusion
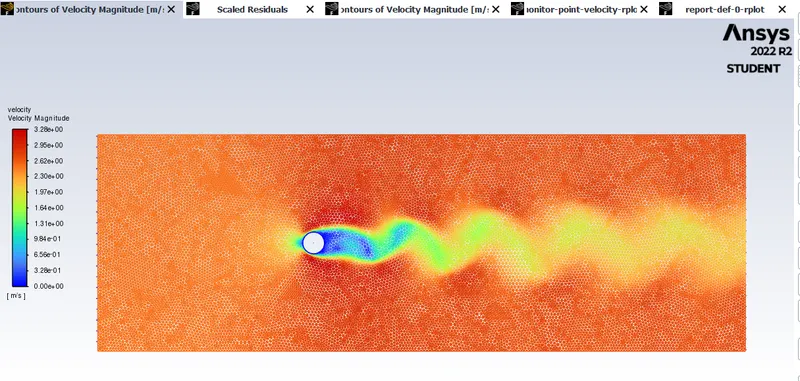
- As the fluid flows over the cylinder, the drop in pressure causes a wake to form adjacent to the cylinder, causing flow recirculation and flow separation.
- Since the flow across the cylinder is transient and this is a time dependent phenomenon, flow separation cannot be observed at low Reynolds numbers (eg 50).
- At high reynolds number ,vortices are observed bcz of fluctuations which is creating due to flow over cylinder.
- Strouhal no. calculated for unsteady state with reynolds no.= 100 is 0.114.