Week -2
1. Doorbell using solenoid block :
Description : An electromagnetic doorbell uses a sollenoid, which is an electromagnet with a wire coiled around it; surrounded by a piston which consists of an iron core mounted on a non-magnetic metal bar. It can move forwards/backwards through the electromagnetic field. When the switch is turned on, the current flows through the electromagnet which draws the iron core to the magnetic field; where the end of the piston strikes the bell, mainly placed in both sides of the piston, producing the ringing sound.
The simulink model(1.1) depicted below shows the arrangement of a doorbell using solenoid block. As the input signal, pulse generator is used to generate a pulse in every 2 seconds. The parameters of the pulse generator, mainly the time period is set to 4 sec with a pulse width(%) of 50%. As shown in the fig 1.0, a pulse is produced every 2 sec. This input signal reaches the PS port of the switch, placed between the solenoid and battery blocks through the simulink-PS converter which converts the input signal from the pulse generator to physical signals. This switch is controlled by an external physical signal(PS) and for it to work, the provided PS should be greater than the threshold value(0.5) of the switch. An electrical reference is connected in between the negative terminals of the battery and the solenoid, representing electrical grounding/earthing of the circuit. In the solenoid block, ports 'R' and 'C' represents plunger and fixed point respectively. The R port of the solenoid is connected to the R port of an ideal translational motion sensor, which senses the position of the plunger and gives the output. The C(casing) port of the ideal translational motion sensor is connected to the fixed point (C) of the solenoid. A mechanical translational reference is taken and connected in between the respective C ports of the ideal translational motion sensor and the solenoid. The outputs ports of ideal translational motion sensor 'V' and 'P', representing velocity and position respectively of the plunger. As we are mainly taking the position of the plunger into consideration, the output signal from the P port is converted back to a simulink value by a PS-simulink converter and sent to the scope to generate a graph to detect the change in the position of the plunger.
fig 1.1 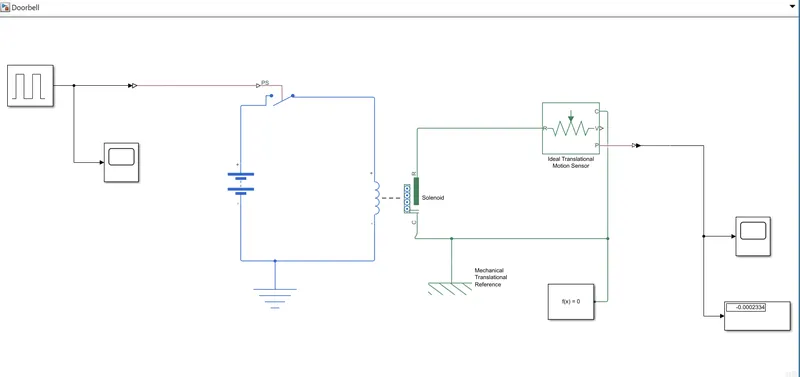
Result : The below graph(fig 1.2) represents the input signal from the pulse generator, where pulse of amplitude 1 is generated for every 2 seconds(ie, having a pulse width of 50%) for a total time period of 10 seconds. The scope at the output provides the graph(fig 1.3), which shows the physical movement of the plunger. Here, the X-axis denotes the time and Y-axis denotes the position of the plunger. We can detect a disturbance/noise at the initial time(t= 0 sec), which continues on at every 2 second time interval, on the basis of the input pulse from the pulse generator. At the first interval, the graph shows a disturbance to the negative half, which gets damped over time. At the next 2 second interval, the graph shows a disturbance to the positive half, getting damped over time and it continues to do so at the next 2 second interval and so on.
fig 1.2 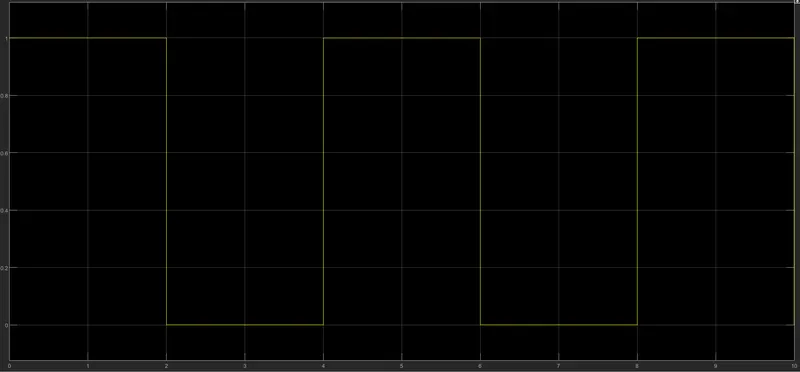 fig1.3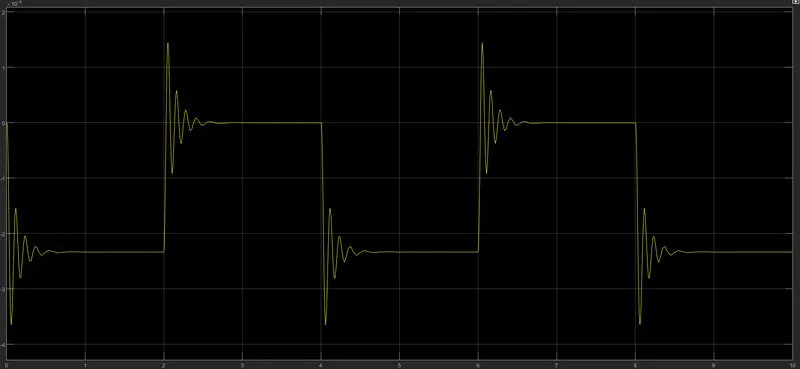
2. Thermistor :
Description: It is a semiconductor device, having a resistance capacity more than conductors and less than insulators. Its resistance varies with the change in the temperature, ie its a thermally sensitive resistor. There are mainly two types of thermistors, mainly negative temperature coefficient(NTC) and positive temperature coefficient(PTC) thermistors. A negative temperature coefficient thermistor's resistance decreases with the increase in temperature, while a positive temperature coefficient thermistor's resistance increases with the increase in temperature. In this challenge, a NTC is used.
The simulink model(fig 2.2) depicts the thermistor arrangement. The input signal is built by a signal builder block depending upon the conditions given in the question. The input signal is built by a signal builder by changing the following parameters; firstly the time range is changed to the interval 0-50 seconds. Then, signal is changed by customizing new time(X) values: [0 10 10 30 30 50] and Y values(in Kelvin): [293.15 293.15 300.15 300.15 296.15 296.15]. The newly built signal is converted to physical signal(PS) by simulink-PS converter and is sent to the PS port 'S' of a controlled temperature source. A positive temperature difference causes temperature at port 'B' to be greater than temperature at port 'A'. The controlled temperature source provides the required temperature, according to the signal provided to its port A/source inlet of the controlled temperature source. The port A of the controlled temperature source is grounded by a thermal reference and port B is connected to the thermal port 'A' of the thermistor. The thermistor block has a positive and negative terminals, along with the thermal port(A). The battery source is connected in parallel with the thermistor and the resistor block in series with the thermistor block. An electrical reference is connected in between the battery source and the resistor, representing earthing/grounding of the circuit. A voltage sensor block is provided across the resistor block to measure the voltage change during the temperature inputs. The output signal of the voltage sensor is converted to a simulink value by PS-simulink converter and sent to the port 2 of the switch. This particular switch has three input ports;
- Port 1 is turned on when the signal value is greater than the threshold value.
- Port 2 is used to find the condition of the signal input in the switch. ie, whether the following simulink value is greater than or less than the threshold value of the switch.
- Port 3 is turned on when the the signal value is less than the threshold value.
The simulink value from the PS-simulink converter is given to the port 2 of the switch, which checks the condition whether the following simulink value is greater/less than the threshold value of the switch and turns on the port satisfying the above condition. The port 1 is connected to a constant block of value 1 and port 3 is connected to a constant block of value 0. So, when the simulink value at port 2 is greater than the threshold value of the switch, port 1 is turned on with value 1 and if the simulink value is less than the threshold value, port 3 is turned on with value 0. To find the threshold value of the switch, a display block is connected in between the switch and the voltage sensor and the input signal is taken from a constant block; commenting out the signal builder block. The constant which is taken as the input(fig 2.1) is given the value 298.15K(25 °C) as given in the question and running the program, the display shows the value 0.01196; taken as the threshold value of the switch and is inputed into the switch. The output of the switch is then connected to the scope. Then, filtering is done in simulink-PS converter to get the result more accurately.
fig 2.1 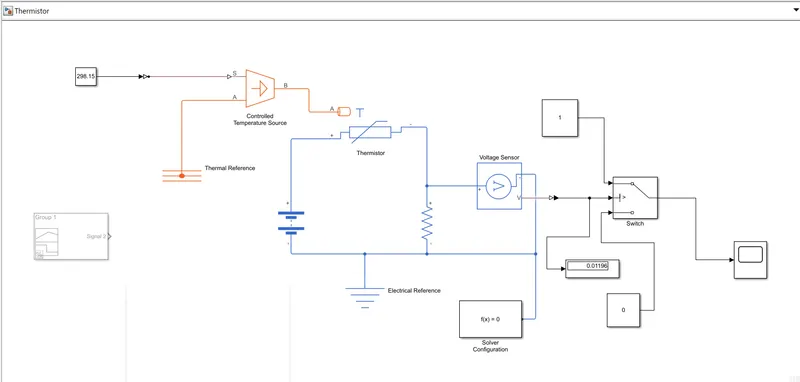 fig 2.2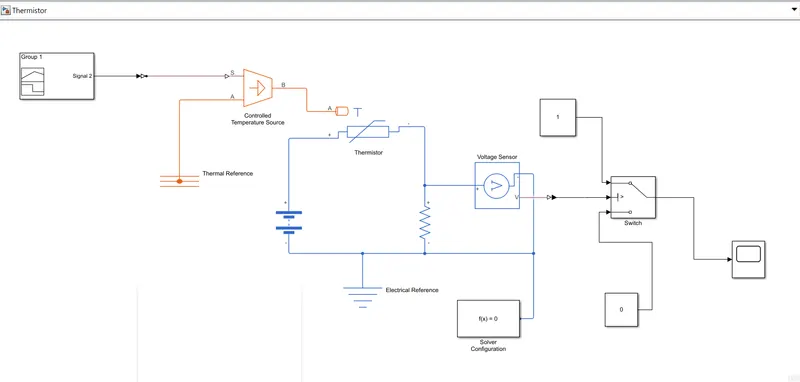
Temperature source: 20 °C from 0 to 10 sec, 27 °C from 10 to 30 sec, 23 °C from 30 to 50 sec
Fan conditions: ON if the temperature above 25 °C, OFF otherwise
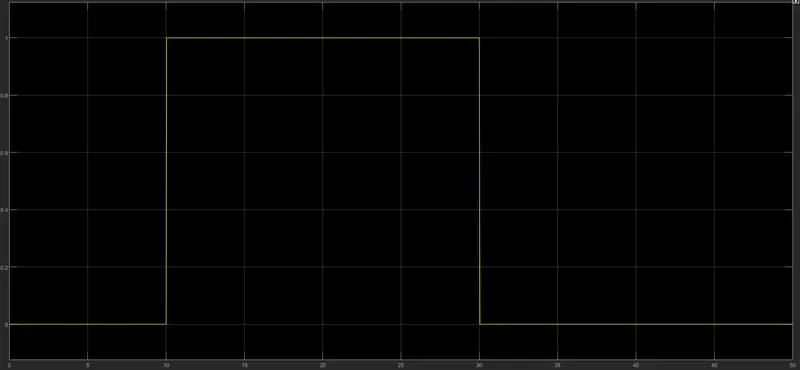
Result : The graph(fig 2.3) below depicts the operation of the thermistor that measures the temperature to turn ON/OFF the fan on the basis of the above conditions. The following are the observations taken;
- During the time interval(t= 0-10 sec), at 20 °C(293.15 K), the port 3 of the switch (0) is turned on as the simulink value from the converter is less than the threshold value(0.01196) of the switch. The fan is turned OFF during this interval as the temperature is less than 25 °C(298.15 K).
- During the time interval(t= 10-30 sec), at 27 °C(300.15 K), the port 1 of the switch (1) is turned on as the simulink value from the converter is greater than the threshold value. So, the fan is turned ON during this interval as the temperature is greater than 25 °C.
- During the time interval(t= 30-50 sec), at 23 °C(296.15 K), the port 3 (0) is turned on as the simulink value from the converter is less than the threshold value. So, the fan is turned OFF again during this time interval as the temperature is less than 25 °C.
fig 2.3