Week 2- 2R Robotic Arm Challenge
%-----------Week-2 2-R Robotic Arm-------------------------------------
%A program to simulate Forward Kinematics of a 2R Robotic Arm

clear all
close all
clc

%Inputs
l1=2;
l2=1.2;
theta1=linspace(0,90,50);
theta2=linspace(0,90,50);

inst=1;
for i=1:length(theta1)
    THETA1=theta1(i);
    for j=1:length(theta2)
        THETA2=theta2(j);
        x0=0;
        y0=0;

        x1=l1*cosd(THETA1);
        y1=l1*sind(THETA1);

        x2=x1+l2*cosd(THETA2);
        y2=y1+l2*sind(THETA2);

        %Plotting
        plot([x0 x1],[y0 y1],[x1 x2],[y1 y2],'linewidth',3)
        axis([-1 5 0 5])
        pause(0.05)
        M(inst)=getframe(gcf);
        inst=inst+1;
    end
end
movie(M)
videofile=VideoWriter('challenge_week2_roboticarm.mp4','MPEG-4');
open(videofile)
writeVideo(videofile,M)
close(videofile)
Explanation:
- To achieve a forward kinematics of a robotic arm the inputs like length and angle with the horizontal of the respective arms (links) are required and given.
- To find each of the position of the links the angle of the respective links are iterrated inside a 'forloop' construct from index 1 upto the last index
- But the link '2' takes all possible positions with respect to each position of link '1'. So to calculate the position of link '2' at each position of link '1' the parameters for link '2' is initialized in 'forloop' that is nested within the 'forloop' that is initialized for link '1'. Hence for each position of link'1' the link'2' will take all the possible positions'. For e.g.,
| Link 1 Position | Link 2 Position |
| 1 | 1 |
| 2 | |
| 3 | |
| 4 | |
| 5 | |
| 2 | 1 |
| 2 | |
| 3 | |
| 4 | |
| 5 | |
| 3 | 1 |
and so on...
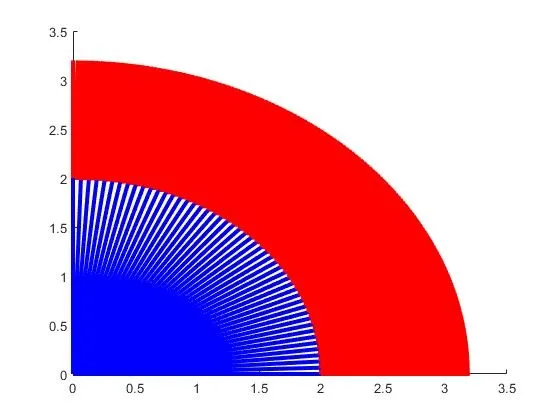
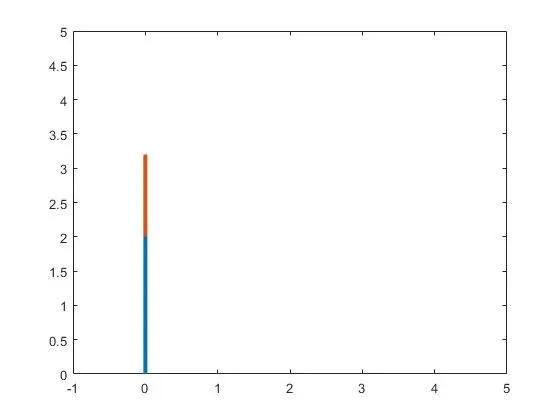
- While plotting the 'plot' command with all the co-ordinates of x and y are specified. The 'axis' is specified to indicate the x amd y limits in the plot figure . But in the first trial 1 and 2, I used the 'line' command and got this crowded plot in the image attached below and only the final position of the arms followed by the next.
Trial - 1
%Plotting
line([x0 x1],[y0 y1],'linewidth',3,'color','b')
line([x1 x2],[y1 y2],'linewidth',3,'color','r')
Trial - 2
%Plotting
plot([x0 x1],[y0 y1],[x1 x2],[y1 y2],'linewidth',3)
axis([-1 5 0 5])
- Then to make the plot meaningful it is paused for .05 seconds at each positions and the frame is captured in a array with counter.
- And the counter is incremented by one at each time when the outer forloop gets executed. To stitch each frames as a movie, 'movie' function is used and the frame array is passed as a parameter.
- Then a variable for specifying the video filename and compression method profile is declared, here I have specified the filename with ".mp4" extension and the compression method profile as "MPEG-4".
- Then the video file is opened and the frames are written into it by giving the command 'writeVideo' by passing the video file variable and the movie array as parameters.
- After writing the video the file is closed. The flie will be present in the directory.
Errors occured :The crowded plot is the first error occured while using line command and the final position is the other error came while using plot command then realized that pausing the plot is needed to make it meaningful.
Resolution to the Error : The command 'pause(0.05)' is used after plot to overcome this error.
Link to Video:
https://drive.google.com/file/d/1UKKxdafo9gq7GDsy6Xo6tXoub3wh0XTp/view?usp=sharing