Week 2- 2R Robotic Arm Challenge
Aim,
To create a program for the forward kinematics of a 2R Robotic Arm.with a animation.
What need to find,
IN this robotic arm if the llinks angle and length given means we need to find the final position of manipulator.
Steps performin this program,
- Calculate the position of link-1 & link-2
- Create a animation of 2r robtic arm manipulator changing with different angles.
Calculate the position of link-1 & link-2,
Procedure,
- In this part first need to calculate the co-ordinates.Here we take 3 co-ordinates and this co-ordinates are ([x0,y0],[x1,y1],[x2,y2]).
- And the X0=0 & y0=0 this co-ordinates is statring point so we consider the value 0
- And x1,y1 find that means we can use simple formula x1= L1 * cosd(theta) & y1= L1 * sind(theta) here L1 is link1 length.theta1 is the angle of link 1 and x1,y1 are link 1 end point.
- And then find a x2 & y2 values means do anothe formula x2 = x1+ L2*cosd(theta) & y2 = y1+ L2*sind(theta), here L2 is link2 length , theta2 is the angle of link 2 and x1,y1 is alink 2 starting point and x2,y2 is link 2 end point
- Then plotting for this robotic arm.
Here my program and my values are.these values areexamplesshouldI taken.
Program,
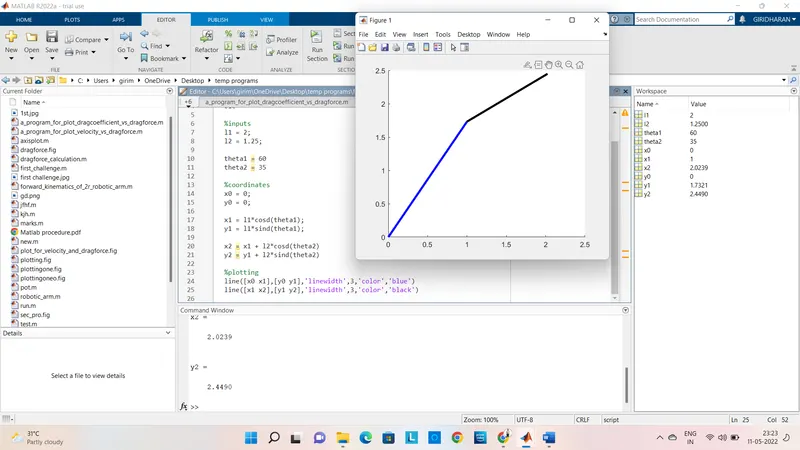
Values,
- x0 = 0
- y0 = 0
- x1 = 1
- y1 = 1.7321
- x2 = 2.0239
- y2 = 2.4490
Here is thee fisrst step sucessfully completed.
Step 2 Create a animation of 2r robtic arm manipulator changing with different angles-
- 1st we give the length value as common. l1 = 2.25 &l2 = 0.75.
- 2nd we can give the angles. In we take angles some so we could use linspace command (linspace command is generates linear spaced vectorsit's similar to the colon operator buthere how many values we need means given that it generates random numbers . in between the given values (Ex- theta1 = linspace(0,60,15) here 0 is stating angle and 90 is end angle and 15 is number of values we want) here is my 15 values are
- 0
-
4.2857
-
8.5714
-
12.8571
-
17.1429
-
21.4286
-
25.7143
-
30
-
34.2857
-
38.5714
-
42.8571
-
47.1429
-
51.4286
-
55.7143
-
60
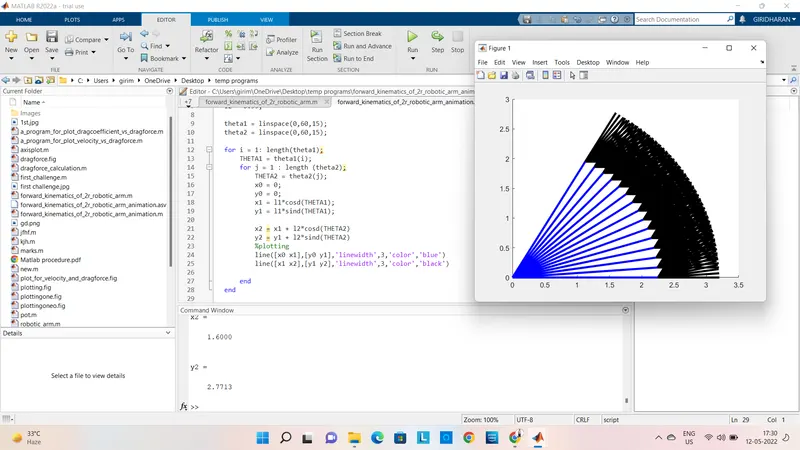
- Then we need to do another work for angles to changes the manipulator in how many dissferent shapes, So that here we go for the command of for loop, for theta 1 and theta 2 here we take the variable 'i' to do one simple formula is for loop i = 1 : length(theta1) ; THETA1=theta(i); this is the THETA1(link1) angles
- Here we could do the another for loop for another link angles but same formula for used the 'i'
- Here we change the variable 'j' j = 1 : length(theta2) ; THETA2=theta(j). this is the THETA2 (link 2) angles.
- And next steps all same as the 1st program in starats with coordinates.
- Here I do the program
Program,
Output,
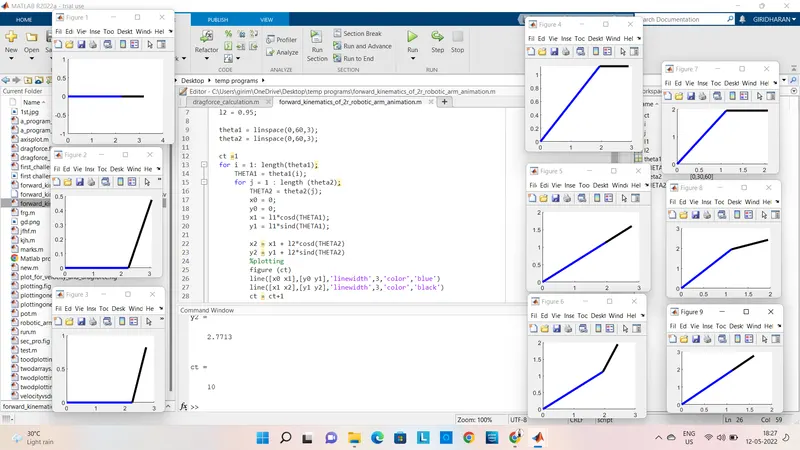
- Then we could do the counter command.
- Counter command means variable that simply increments as by specific values in every part of loop.
- Here I could change the angle no of values is 3. So we get 9 figures that's one I attached in output img.
- In matlab counter command is short form ct so 1st i give the ct=1 before the get started loop in why here ad ct=1 means.
Program,
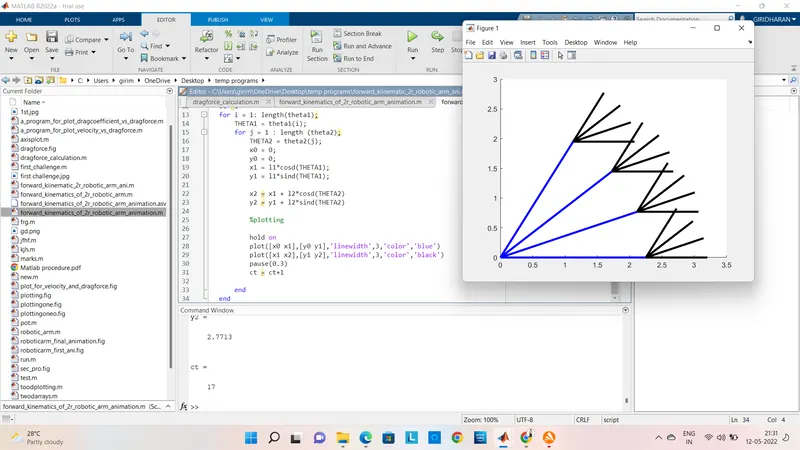
- Another step is command hold on
- In this command hold on input means secon plot line with out deleting existing line,in each theta 1 value can change the theta2 value.In the output figshown the plottings.
- In this program we cut the counter command in after plotting.
- Here we could add the pause command of end of plotting there is time delay in one one link to seperations in second.
Program,
Output,
- Another step is need to get proper animation of link one and two.
- So we could cut the second plot statement and add the coordinates in to 1st plot statement.
- And erase the hold on command means each value of theta1 is how will change the theta 2.
- In above line we could erase the color command so we get the randoms colours of plot comes.
- And add the axis means it comes the look good plot animation.
Program,
- The output has same on final saved one.
- And final step is need to save the video file in correct format and write the good animated video like.Below program was written.
FinalProgram,
Errors I faced,
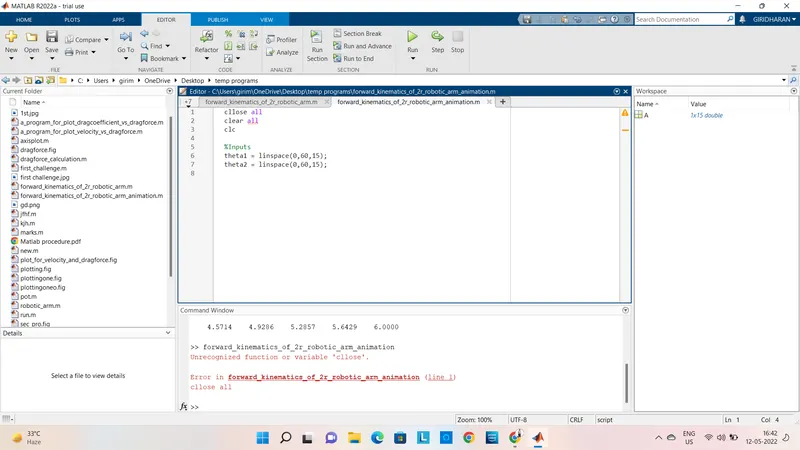
1st error - Wrong typing of close.
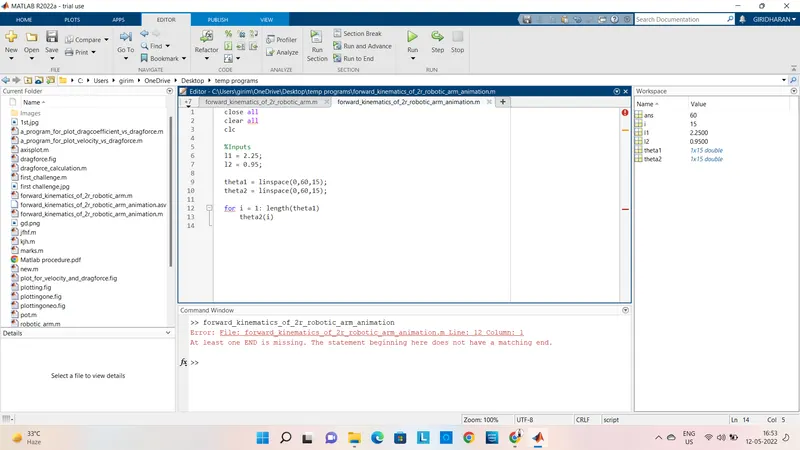
2nd error in the - In the for loop i couldn't end the loop program and correct that one.
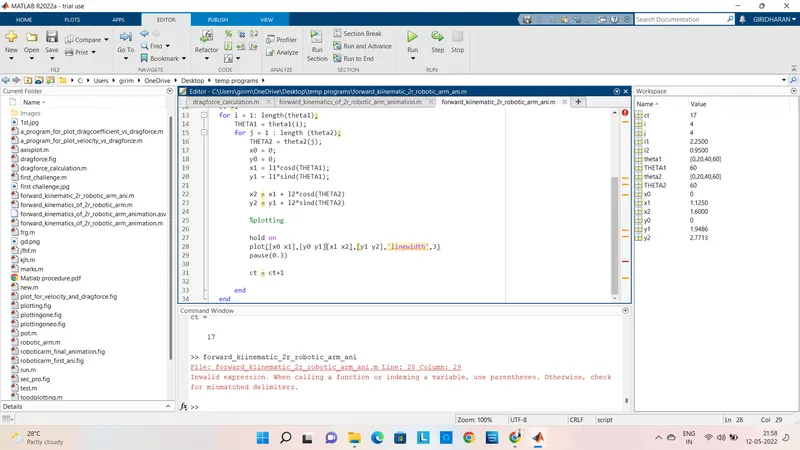
3rd Error - in complete the line 28 here first two coordinate types correctly then I coulldn't add comma so it's come error.
4th error is videowriter code is wrong so I correct that one
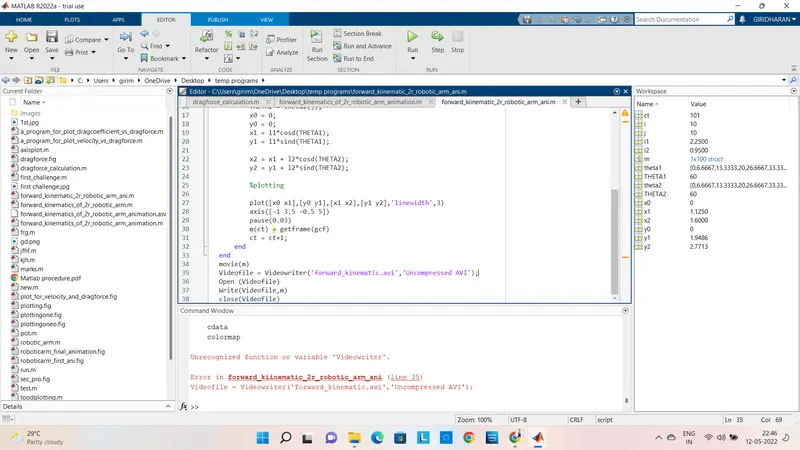
5th error is in final one open statement is wrong correct that one means file saved sucessfully.
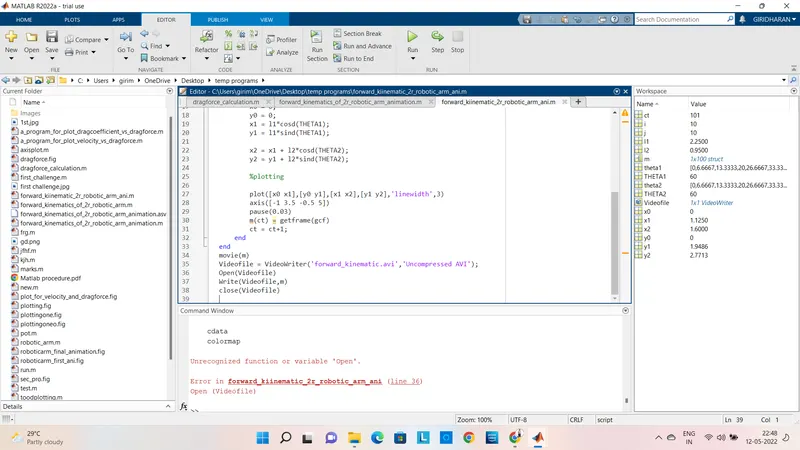
6th error is write command is wron and correct that also.
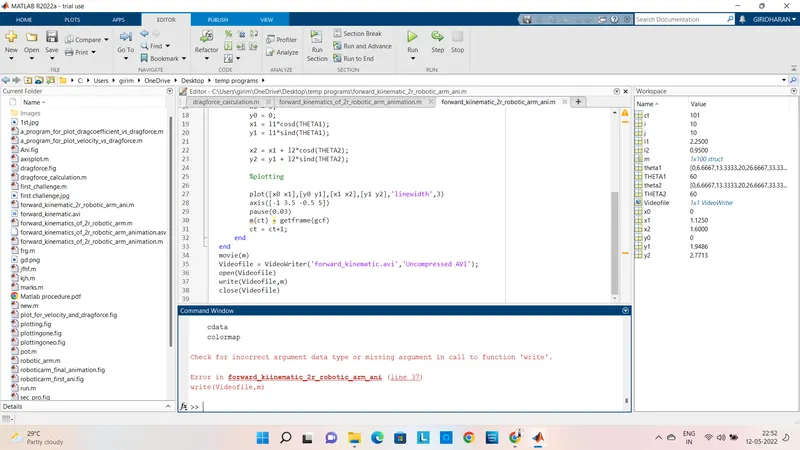
Conclusion,
Forward kinematics of 2R robotic arm links how will changes in using various angles could be completed with the help of Matlab software.