Project 1 - Parsing NASA thermodynamic data
Aim,
- Write a function that extracts the 14 co-efficients and calculates the enthalpy, entropy and specific heats for all the species in the given data file.
- Calculate the molecular weight of each species and display it in the command window.
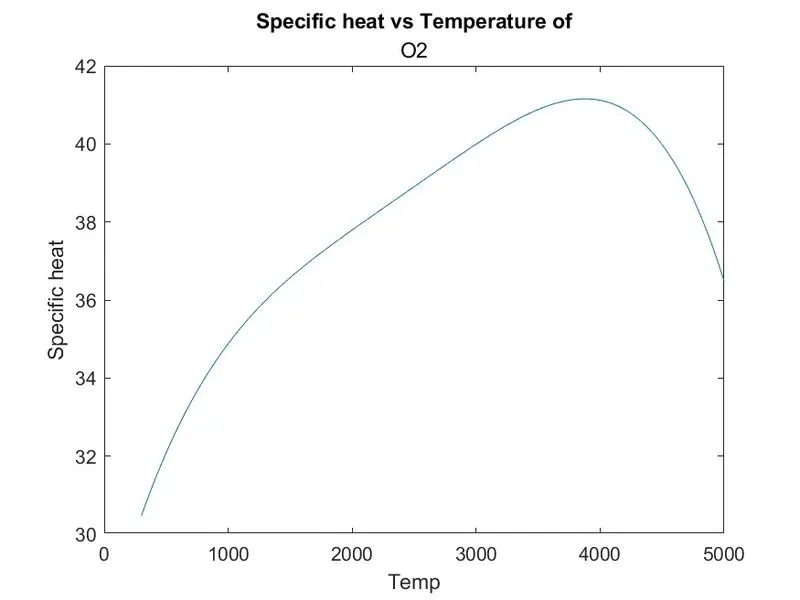
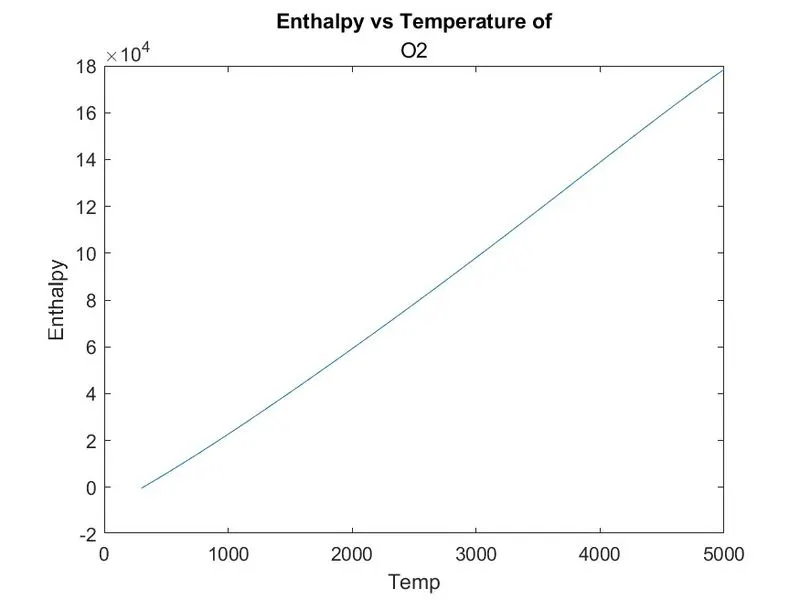
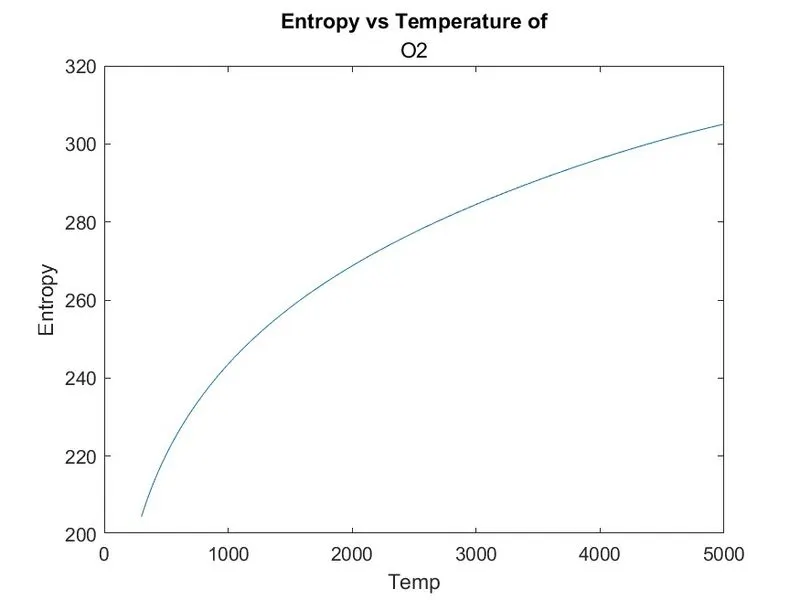
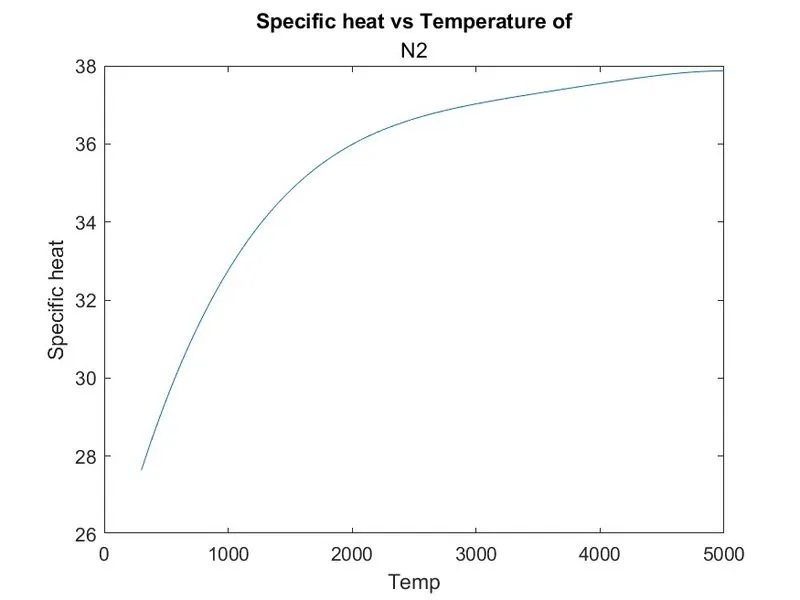
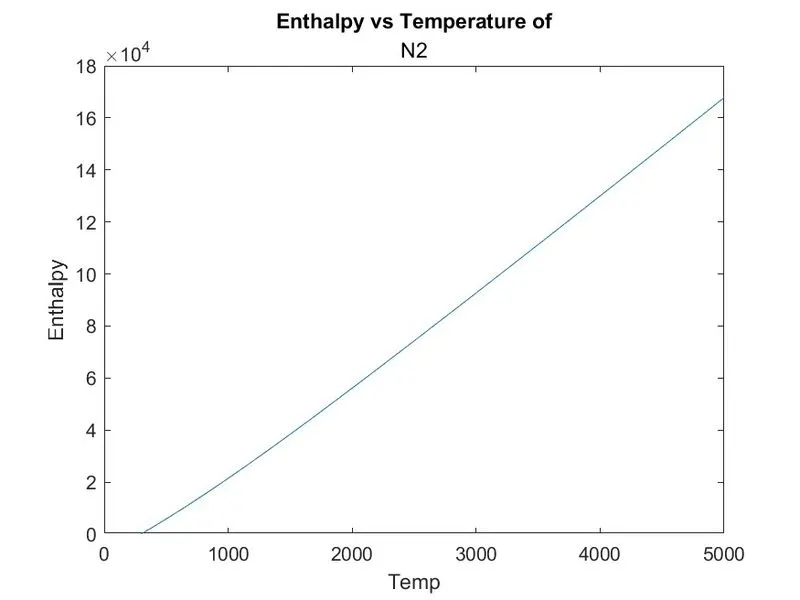
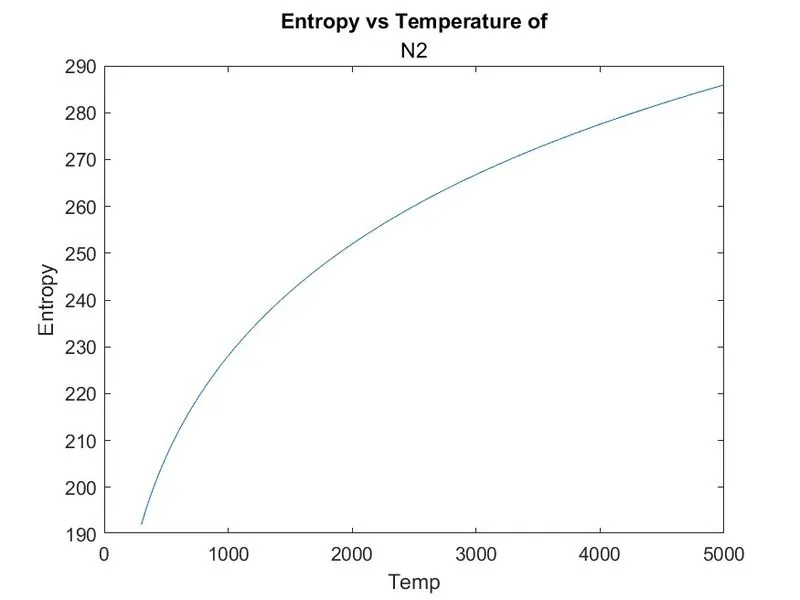
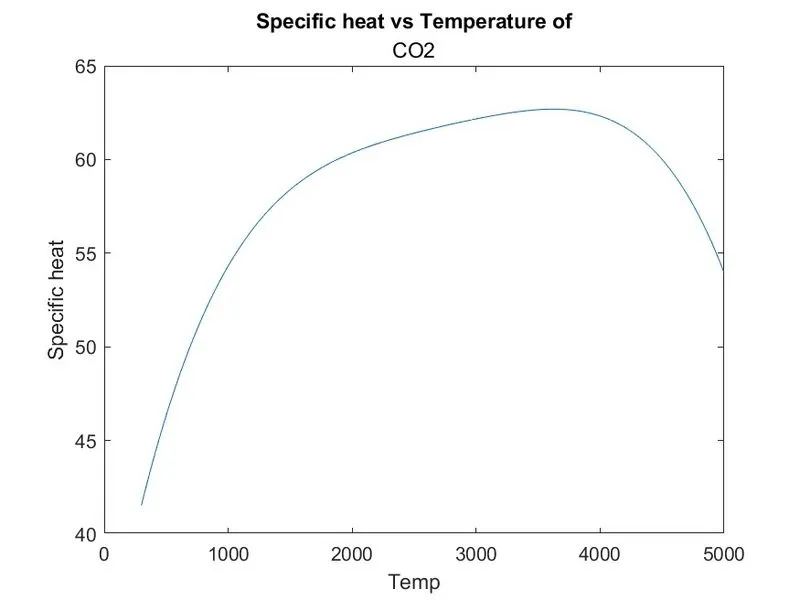
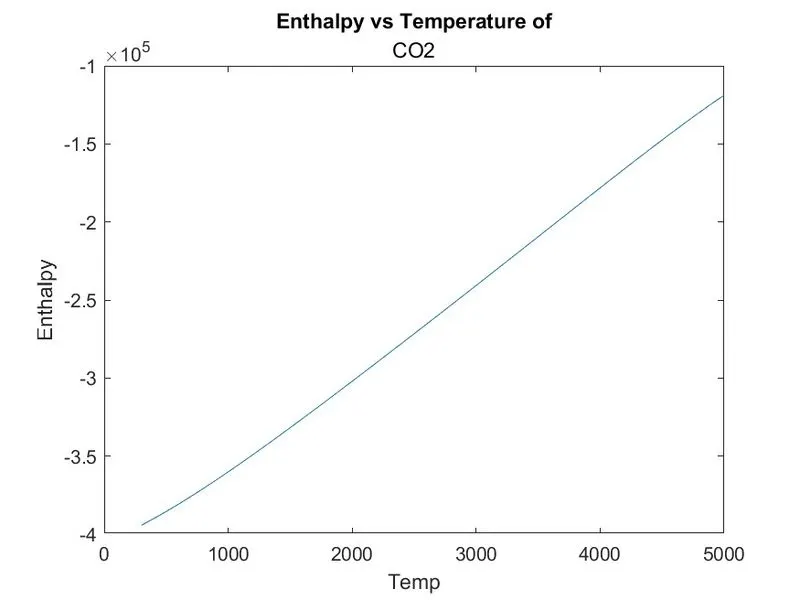
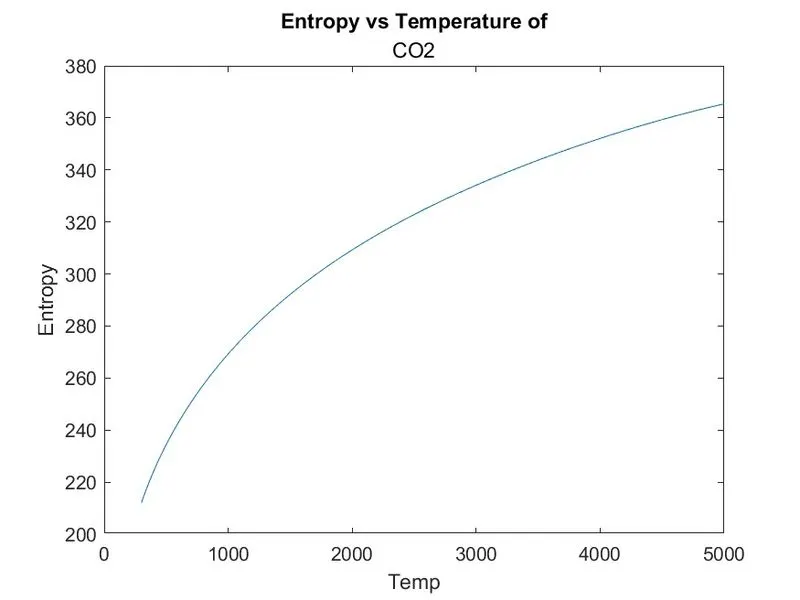
- Plot the Cp, Enthalpy and Entropy for the local temperature range (low temperature : high temperature) specific for each species.
- Save the plots as images with appropriate names and dump them in separate folders for each species with suitable name.
Formula,

Where,
- R is Universal gas constant 8.134
- T is temperature in 'K'
- CP is specific heat in 'KJ'
- H is Enthalpy in 'KJ/mol'
- S is Entropy in 'KJ/mol-K'
File parsing,
- The Input Parser provides a consistent way to validate and assign defaults to inputs, improving the robustness and maintainability of your code.
- Parsing a file means reading in a data stream and building a memory model of the content of that data.
- It's aims at facilitating perfoming some kind of transformation on the data.
- Parsing splits a file or other input into pieces of data that can be easily stored or manipulated.
NASA Thermodynamic File,
- NASA Thermodynamic file which is THERMO.dat file in which there are temperature range of 53 species and
given in these data each species contains 14 coefficients and various temperature ranges and we have to parse
these 14 coefficients to find (Specific heat, Entropy and Enthalpy)with this vs temperature using above formulae.
Specific heat,
- The quantity of heat energy that must be absorbed to increase the temperature of one gram of substance by one degree Celsius.
- This symbol 'cp' unit was 'KJ'.
Enthalpy,
- The sum of the internal energy and the product of the pressure and volume of a thermodynamic system.
- This symbol 'H' unit was 'KJ/mol'.
Entropy,
- Generally, entropy is defined as a measure of randomness or disorder of a system.
- Apart from the general definition from thermo view point of entropy,do not consider the microscopic details of a system. Instead, entropy is used to describe the behaviour of a system in terms of thermodynamic properties such as temperature, pressure, entropy, and heat capacity. This thermodynamic description took into consideration the state of equilibrium of the systems.
- This symbol 'H' unit was 'KJ/mol-K'.
Molecular weight,
- The sum of the atomic masses of all atoms in a molecule, based on a scale in which the atomic masses and our of Hydrogen, Carbon, Nitrogen, Oxygen and Argon are 1, 12, 14,16 and 39.948 respectively.
Now see the function code,
- Specific heat function.
- Enthalpy function.
- Entropy function.
- Molecular weight function.
Specific heat function,
Code,
%Specific heat calculation
function [cp] = specific_heat(a1,a2,a3,a4,a5,a8,a9,a10,a11,a12,T,R,tempmid)
%Now find Specific heat according to higher and lower temps respectively
if(T <= tempmid)
cp= R*(a8+(a9*T)+(a10*(T).^2)+(a11*(T).^3)+(a12*(T).^4));
else
cp = R*(a1+ (a2*T)+(a3*(T).^2)+(a4*(T).^3)+(a5*(T).^4));
end
end
Code explanation,
- First enter the output file name as cp then enter the function code name as specific_heat and assigning it's related forumla variables of 14 coefficients and T,R and mid tempertaure
- Then use the if loop to create temperature lesser then and equal to mid temperature.
- Then we use the lower temperature coefficients in this formula. Cp/R = a8+ a9 T + a10 T^2 + a11 T^3 + a12 T^4.
- And use else condition to specify the higher temperature coefficients in this formula.Cp/R = a1+ a2 T + a3 T^2 + a4 T^3 + a5 T^4.
- And end the else ocndition and also end the if loop.
Enthalpy Entropy function,
Enthalpy Code,
%Enthalpy calculation
function [H]= enthalpy(a1,a2,a3,a4,a5,a6,a8,a9,a10,a11,a12,a13,T,R,tempmid)
%Now find Enthalpy according to higher and lower temps respectively
if(T <= tempmid)
H = R*T.*(a8+((a9*T)/2)+((a10*(T).^2)/3)+((a11*(T).^3)/4)+((a12*(T).^4)/5)+((a13./T)));
else
H = R*T.*(a1+((a2*T)/2)+((a3*(T).^2)/3)+((a4*(T).^3)/4)+((a5*(T).^4)/5)+((a6./T)));
end
end
Entropy Code,
%Entrophy calcullation
function [S] = entropy(a1,a2,a3,a4,a5,a7,a8,a9,a10,a11,a12,a14,T,R,tempmid)
%Now find Entropy according to higher and lower temps respectively
if (T <= tempmid)
S= R*(a8*log(T)+(a9*T)+((a10*(T).^2)/2)+((a11*(T).^3)/3)+((a12*(T).^4)/4)+a14);
else
S= R*(a1*log(T)+(a2*T)+((a3*(T).^2)/2)+((a4*(T).^3)/3)+((a5*(T).^4)/4)+a7);
end
end
Code explanation,
- Here this two codes also same as specific heat but here need to change the coefficients and formula.Below I was explain that.
- First enter the output file name as H & S then enter the function code name as Enthalpy and Entropy and assigning it's related forumla variables of 14 coefficients and T,R and mid tempertaure
- Then use the if loop to create temperature lesser then and equal to mid temperature.
- Then we use the lower temperature coefficients in this formula and this for Enthalpy H/RT = a8+ a9 T /2 + a10 T^2 /3 + a11 T^3 /4 + a12 T^4 /5 + a13/T & this for entropy S/R = a8lnT+a9 T + a10 T^2 /2 + a11 T^3 /3 + a12 T^4 / 4+ a14
- And use else condition to specify the higher temperature coefficients in this formula. H/RT = a1+ a2 T /2 + a3 T^2 /3 + a4 T^3 /4 + a5 T^4 /5 + a6/T & this for entropy S/R = a1 lnT+a2 T + a3 T^2 /2 + a4 T^3 /3 + a5 T^4 / 4+ a7
- And end the else ocndition and also end the if loop.
Molecularweight function,
Code,
%Molecular weight calculation
function [MW] = molecular_weight(species)
%Atomic name of species Hydrogen,Carbon,Oxygen,Nitrogen,Argon
atomic_name = {'H','C','O','N','A'};
%Atomic Weight of each species
atomic_weight =[1.008 12.011 15.999 14.007 39.948];
%Molecular weight starting range
MW = 0;
%Adding atomic num to obtain particular value of species
for i=1:length(species)
for j=1:length(atomic_name)
if strcmp(species(i),atomic_name(j))
MW = MW+ atomic_weight(j);
position=j;
end
end
n = str2double(species);
if n>1
MW = MW+atomic_weight(position)*(n-1);
end
end
Code explanation,
- First enter the output name of function MW then input the function name as molecular_weight of specices.
- And define the main element of all 53 species in array atomic name that are {'H','C','O','N','A'}.
- Then create the above elements atomic weight of [1.008 12.011 15.999 14.007 39.948].
- And consider the starting weight of molecular is 0 then create for loop condition which runs the length of species and an another for loop created which runs length of atomic weight.
- After that if condition to use the strcmp condition to compare the species atomic name and atomic weights.
- Then to calculate the final molecular weight wants means starting molecular weight of species to add up the atomic weight of each species. nad set the position to 'j' then end the above 2 for loops.
- Now we will convert the string to numbers using 'str2doubles' command and assign then run a 'if' condition to find whether the species contains more then one elements that is n>1 then we will increase the atomic weight by multiply with position 'j' and into n-1 to the atomic_weight of array.
Mani code,
%Inputs
R=8.314;
%Reading data file
%Open & read THERMO.dat file
f1 = fopen('THERMO.dat','r');
get = fgetl(f1);
%Reading temperature from this file
temp = fgetl(f1);
%Splitting
s= strsplit(temp);
%Converting
templow = str2double(s{2});
tempmid = str2double(s{3});
temphigh = str2double(s{4});
%Temperature Range
T = linspace(templow,temphigh,1000);
for i=1:3
tline = fgetl(f1);
end
%Reading the 53 species
for j= 1:53
tline = fgetl(f1);
A = strsplit(tline,' ');
species = (A{1});
%converting strings cell into numbers
templow = str2double(A{end-3});
temphigh = str2double(A{end-2});
tempmid = str2double(A{end-1});
tline1=fgetl(f1);
a = strfind(tline1,'E');
%Find the first 7 higer and Second 7 lower coefficients
a1 = tline1(1:a(1)+3);
a1 = str2double(a1);
a2 = tline1(a(1)+4:a(2)+3);
a2 = str2double(a2);
a3 = tline1(a(2)+4:a(3)+3);
a3 = str2double(a3);
a4 = tline1(a(3)+4:a(4)+3);
a4 = str2double(a4);
a5 = tline1(a(4)+4:a(5)+3);
a5 = str2double(a5);
tline2 = fgetl(f1);
b = strfind(tline2,'E');
a6 = tline2(1:b(1)+3);
a6 = str2double(a6);
a7 = tline2(b(1)+4:b(2)+3);
a7 =str2double(a7);
%Finding lower coefiicients
a8 = tline2(b(2)+4:b(3)+3);
a8 = str2double(a8);
a9 = tline2(b(3)+4:b(4)+3);
a9 = str2double(a9);
a10 = tline2(b(4)+4:b(5)+3);
a10 = str2double(a10);
tline3 = fgetl(f1);
c = strfind(tline3,'E');
a11 = tline(1:c(1)+3);
a11 = str2double(a11);
a12 = tline3(c(1)+4:c(2)+3);
a12 = str2double(a12);
a13 = tline3(c(2)+4:c(3)+3);
a13 = str2double(a13);
a14 = tline3(c(3)+4:c(4)+3);
a14 = str2double(a14);
%calculate specific heat
[cp] = specific_heat(a1,a2,a3,a4,a5,a8,a9,a10,a11,a12,T,R,tempmid);
%calculate enthalpy
[H] = enthalpy(a1,a2,a3,a4,a5,a6,a8,a9,a10,a11,a12,a13,T,R,tempmid);
%calculate entropy
[S] = entropy(a1,a2,a3,a4,a5,a7,a8,a9,a10,a11,a12,a14,T,R,tempmid);
mkdir(species)
cd(species)
figure(1)
plot(T,cp)
xlabel('Temp')
ylabel('Specific heat')
title('Specific heat vs Temperature of',sprintf('%s',species))
saveas(figure(1),'Cp vs Temp.jpg')
figure(2)
plot(T,H)
xlabel('Temp')
ylabel('Enthalpy')
title('Enthalpy vs Temperature of',sprintf('%s',species))
saveas(figure(2),'H vs Temp.jpg')
figure(3)
plot(T,S)
xlabel('Temp')
ylabel('Entropy')
title('Entropy vs Temperature of',sprintf('%s',species))
saveas(figure(3),'S vs Temp.jpg')
cd ..
% calculate molecular weight
[MW] = molecular_weight(species);
MW_wt = sprintf('Molecular weight of %s is %f',species,MW);
disp(MW_wt)
end
Code explanation,
- 1st input the values of universal gas constantR=8.314 then open and read the .dat file as using fopen command, f1 = fopen('THERMO.dat','r').
- By using the fgetl command to read the first line of THERMO.dat file, fgetl(f1).
- Then global temperatures (2nd line of the file) is read by using temp =fgetl(f1).
- Then the temperature is going to be splitted by using the command of strsplit(temp).
- And global temperatures(300,1000,5000) are read and converted in to 3 types low, mid and high temperatures by using the command of str2double and that are
templow = str2double(s{2});tempmid = str2double(s{3});temphigh = str2double(s{4});
- And temperature range was generates using of T = linspace(templow,temphigh,1000);
- To use for loop to eliminate the comment lines and end it.
for i=1:3tline = fgetl(f1);end
- Then file next 53 species are going to read by using the commands of below and split this line in to 'A' variable then call it species = A identify which line 1 for j= 1:53
tline = fgetl(f1);A = strsplit(tline,' ');species = (A{1})
-
Then converts the temperature string cell into numeric array by using the str2double command that wastemplow = str2double(A{end-3});temphigh = str2double(A{end-2});tempmid = str2double(A{end-1});
- After that we could calculate the higher temp 7 coefficients by using this methods.1st 5 coefficients come from line one another 2 co efficients is come from line 2.
a1 = tline1(1:a(1)+3);a1 = str2double(a1);a2 = tline1(a(1)+4:a(2)+3);a2 = str2double(a2);a3 = tline1(a(2)+4:a(3)+3);a3 = str2double(a3);a4 = tline1(a(3)+4:a(4)+3);a4 = str2double(a4);a5 = tline1(a(4)+4:a(5)+3);a5 = str2double(a5);tline2 = fgetl(f1);b = strfind(tline2,'E');a6 = tline2(1:b(1)+3);a6 = str2double(a6);a7 = tline2(b(1)+4:b(2)+3);a7 =str2double(a7);
- Now find the lower temp 7 co efficients same to above method.
a8 = tline2(b(2)+4:b(3)+3);a8 = str2double(a8);a9 = tline2(b(3)+4:b(4)+3);a9 = str2double(a9);a10 = tline2(b(4)+4:b(5)+3);a10 = str2double(a10);tline3 = fgetl(f1);c = strfind(tline3,'E');a11 = tline(1:c(1)+3);a11 = str2double(a11);a12 = tline3(c(1)+4:c(2)+3);a12 = str2double(a12);a13 = tline3(c(2)+4:c(3)+3);a13 = str2double(a13);a14 = tline3(c(3)+4:c(4)+3);a14 = str2double(a14);
- After that calculate specific heat and enthalpy and entropy to functions formula use here. that's are
[cp] = specific_heat(a1,a2,a3,a4,a5,a8,a9,a10,a11,a12,T,R,tempmid);[H] = enthalpy(a1,a2,a3,a4,a5,a6,a8,a9,a10,a11,a12,a13,T,R,tempmid);[S] = entropy(a1,a2,a3,a4,a5,a7,a8,a9,a10,a11,a12,a14,T,R,tempmid);
-
And now add this species plots to seperate folder so we use the mkdir command to create each species folder that's are.And cd command to new folders are created and it's been to this current folder.mkdir(species)cd(species)
-
Then we could create the plot for each species and it's to been saved to each folders and seperates for this one that methods are mention below.figure(1)plot(T,cp)xlabel('Temp')ylabel('Specific heat')title('Specific heat vs Temperature of',sprintf('%s',species))saveas(figure(1),'Cp vs Temp.jpg')figure(2)plot(T,H)xlabel('Temp')ylabel('Enthalpy')title('Enthalpy vs Temperature of',sprintf('%s',species))saveas(figure(2),'H vs Temp.jpg')figure(3)plot(T,S)xlabel('Temp')ylabel('Entropy')title('Entropy vs Temperature of',sprintf('%s',species))saveas(figure(3),'S vs Temp.jpg')cd ..
- And before end up the code we calculate the molecular weight of each species for use this method and command.
[MW] = molecular_weight(species);MW_wt = sprintf('Molecular weight of %s is %f',species,MW);disp(MW_wt)end
- Finally end the loop and code.
Outputs,
Folder for each species and codes.

1st -O2 Plots
2nd-Plot for N2
3rd-Plots for CO2
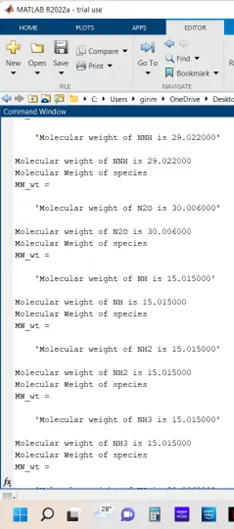
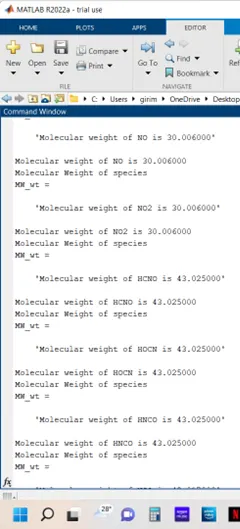
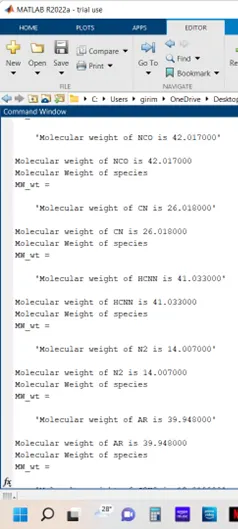
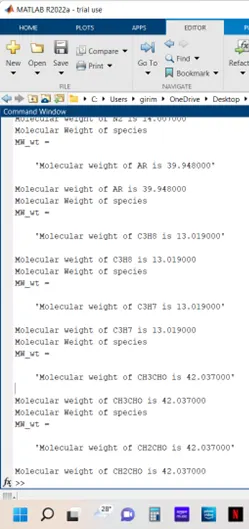
Molecular Weight of each species,
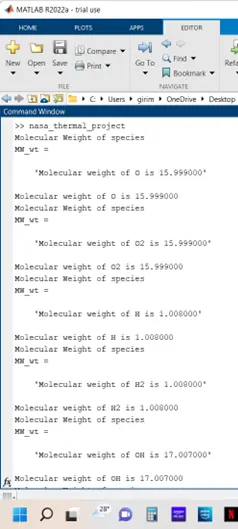
- 'Molecular weight of O is 15.999000'
- 'Molecular weight of O2 is 15.999000'
- 'Molecular weight of H is 1.008000'
- 'Molecular weight of H2 is 1.008000'
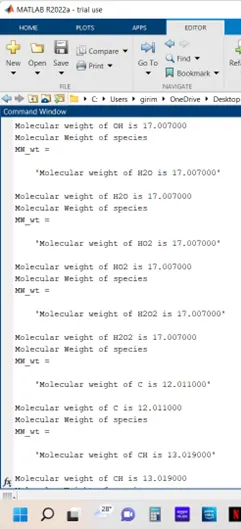
- 'Molecular weight of OH is 17.007000'
- 'Molecular weight of H2O is 17.007000'
- 'Molecular weight of HO2 is 17.007000'
- 'Molecular weight of H2O2 is 17.007000'
- 'Molecular weight of C is 12.011000'
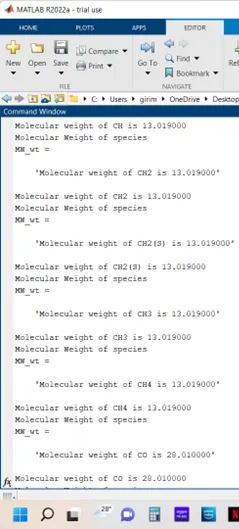
- 'Molecular weight of CH is 13.019000'
- 'Molecular weight of CH2 is 13.019000'
- 'Molecular weight of CH2(S) is 13.019000'
- 'Molecular weight of CH3 is 13.019000'
- 'Molecular weight of CH4 is 13.019000'
- 'Molecular weight of CO is 28.010000'
- 'Molecular weight of CO2 is 28.010000'
- 'Molecular weight of HCO is 29.018000'
- 'Molecular weight of CH2O is 29.018000'
- 'Molecular weight of CH2OH is 30.026000'
- 'Molecular weight of CH3O is 29.018000'
- 'Molecular weight of CH3OH is 30.026000'
- 'Molecular weight of C2H is 13.019000'
- 'Molecular weight of C2H2 is 13.019000'
- 'Molecular weight of C2H3 is 13.019000'
- 'Molecular weight of C2H4 is 13.019000'
- 'Molecular weight of C2H5 is 13.019000'
- 'Molecular weight of C2H6 is 13.019000'
- 'Molecular weight of CH2CO is 41.029000'
- 'Molecular weight of HCCO is 41.029000'
- 'Molecular weight of HCCOH is 42.037000'
- 'Molecular weight of H2CN is 27.026000'
- 'Molecular weight of HCN is 27.026000'
- 'Molecular weight of HNO is 31.014000'
- 'Molecular weight of N is 14.007000'
- 'Molecular weight of NNH is 29.022000'
- 'Molecular weight of N2O is 30.006000'
- 'Molecular weight of NH is 15.015000'
- 'Molecular weight of NH2 is 15.015000'
- 'Molecular weight of NH3 is 15.015000'
- 'Molecular weight of NO is 30.006000'
- 'Molecular weight of NO2 is 30.006000'
- 'Molecular weight of HCNO is 43.025000'
- 'Molecular weight of HOCN is 43.025000'
- 'Molecular weight of HNCO is 43.025000'
- 'Molecular weight of NCO is 42.017000'
- 'Molecular weight of CN is 26.018000'
- 'Molecular weight of HCNN is 41.033000'
- 'Molecular weight of N2 is 14.007000'
- 'Molecular weight of AR is 39.948000'
- 'Molecular weight of C3H8 is 13.019000'
- 'Molecular weight of C3H7 is 13.019000'
- 'Molecular weight of CH3CHO is 42.037000'
- 'Molecular weight of CH2CHO is 42.037000'
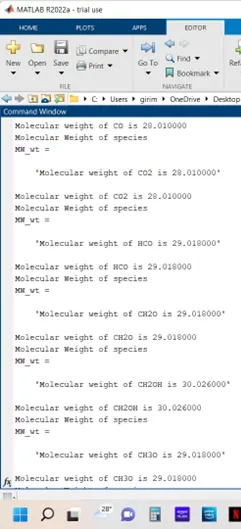
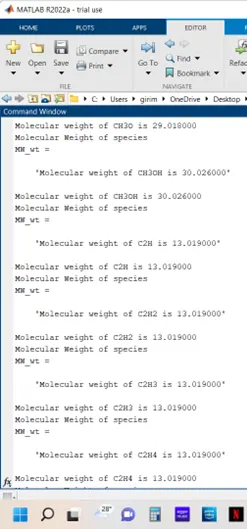
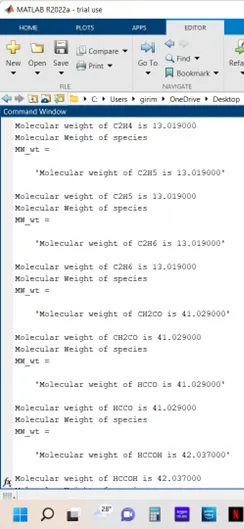
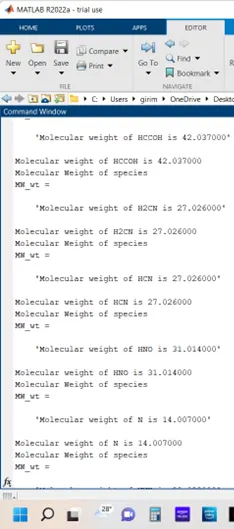
Molecular Weight In command window screenshots,
Results,
- In this project sucessfully calculated the molecular weight of each species and it's to displayed in the command window.
- And created plots for each 53 species and it's been savedto seperate folder for each species.
- Finally here plots of O2,N2 & CO2 succesfully shown in this report.
Errors faced while coding,
- 1st - Here I forgot to add the bracket for T in after a9
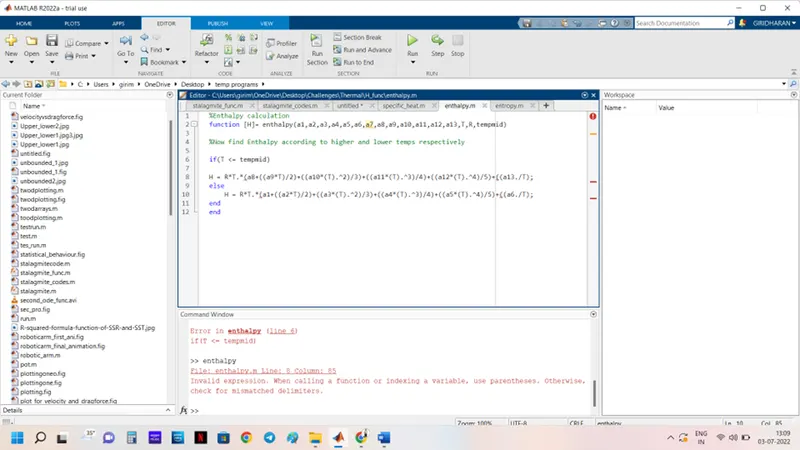
- 2nd - Here also same mistake I made
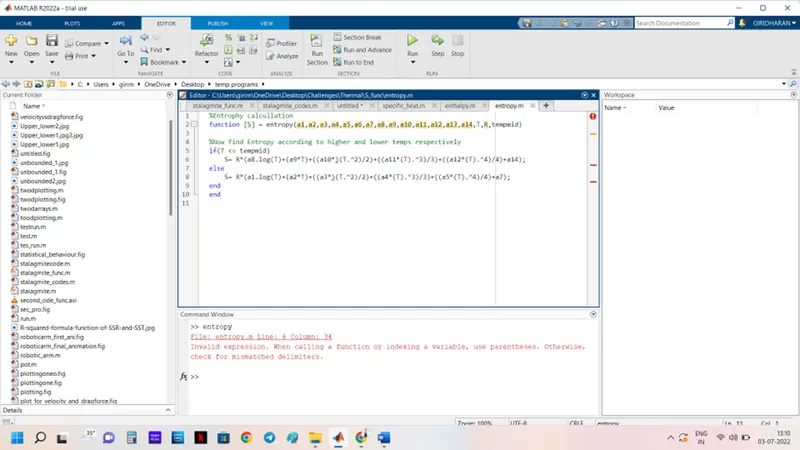
- 3rd - Here I forgot to add the 1in tline1
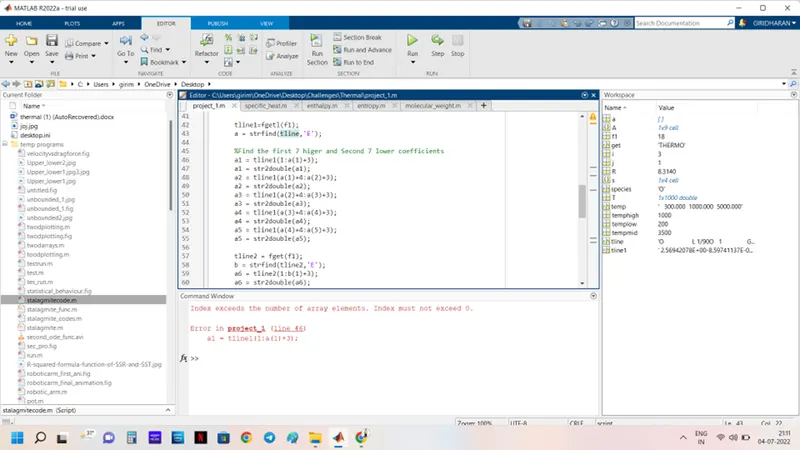
- 4th - Here also I didn't put the l after the fget
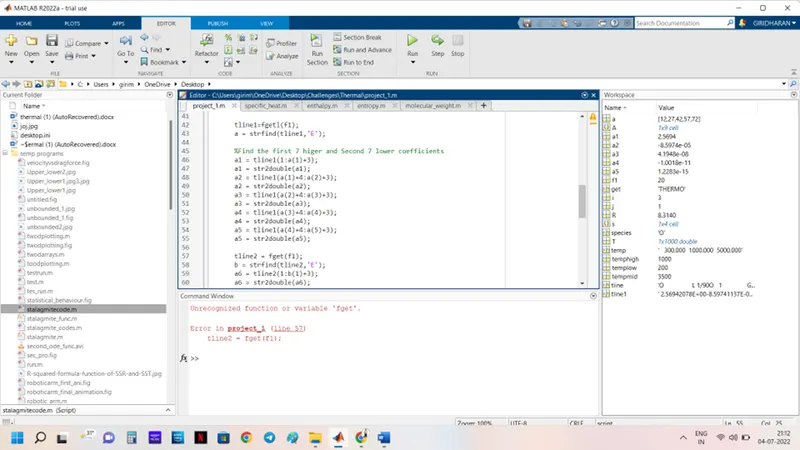
- 5th-Here I didn't mention the number of line in tline
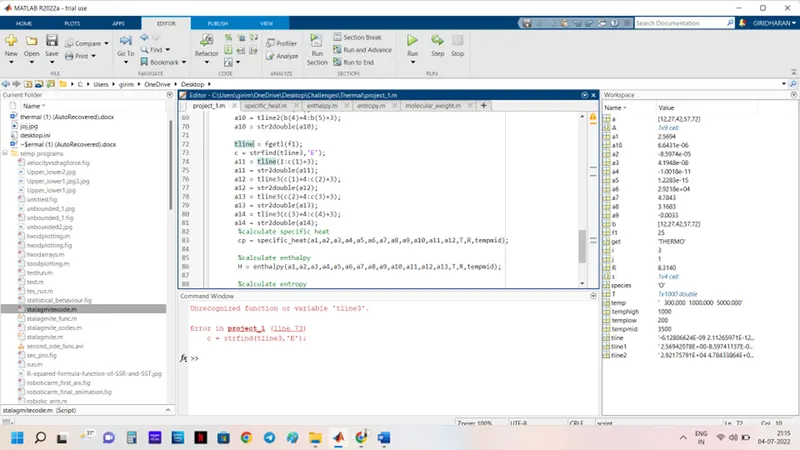
- 6th - In this one I didn't add the bracket and multiply symbol
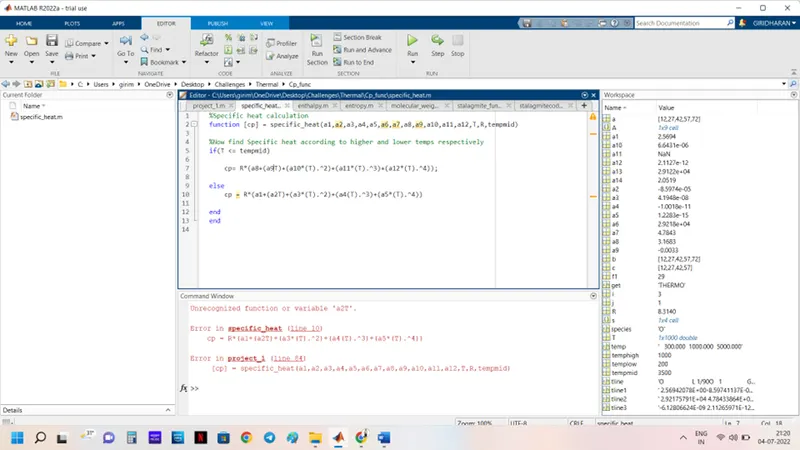
- 7th - In this one 6th coefficient not sufficient.
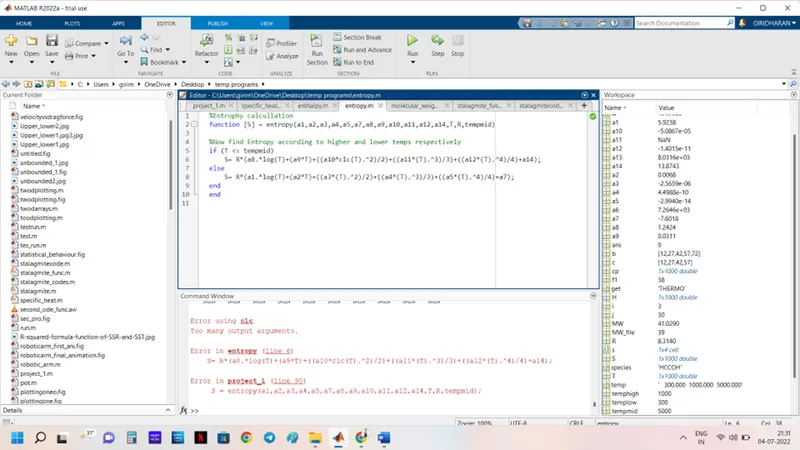
Reference,
- https://in.mathworks.com/help/matlab/matlab_prog/parse-function-inputs.html
- https://in.mathworks.com/help/matlab/ref/strsplit.html
- https://in.mathworks.com/help/matlab/ref/str2double.html#:~:text=X%20%3D%20str2double(%20str%20)%20converts,X%20is%20a%20numeric%20scalar.
- https://www.angelo.edu/faculty/kboudrea/periodic/structure_mass.htm
- https://www.thermal-engineering.org/what-is-enthalpy-and-entropy-definition/
- https://www.britannica.com/science/specific-heat
Conclusion,
- In this project I learned about the file parasing and matlab commands in strsplit,strcmp,str2double,mkdir etc..
- And how these commands are to be used and how it's perfoms and characters also to be learned.
- Finally how will create the folders for elements and how to be saveas the plots of each elments to be save in there specific folders also I could learned.
Thanking you..