Week 2- 2R Robotic Arm Challenge
2R ROBOTIC ARM CHALLENGE
AIM: Program to simulate the forward kinematics of a 2R Robotic Arm.
SOFTWARE USED: MATLAB R2020a
SCHEMATIC DIAGRAM:
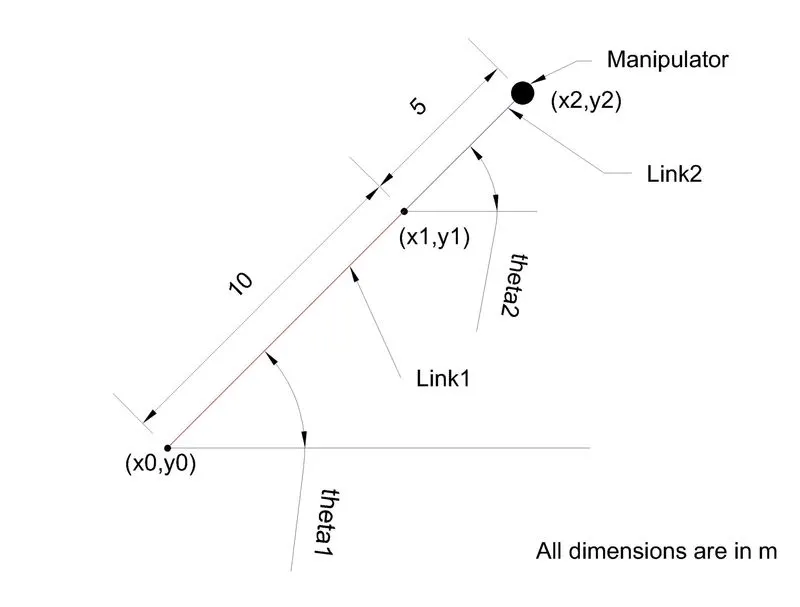
2R Robotic arm (AutoCAD 2D)
FACTORS INVOLVED:
Length of Link 1 (l1)=10 meter
Length of link 2 (l2)= 5 meter
Angle of Link1 wrt. horizontal = theta1
Angle of Link2 wrt. horizontal = theta2
| Coordinate Point | Value |
| x0 | 0 |
| y0 | 0 |
| x1 | l1*cosd(theta1) |
| y1 | l1*sind(theta2) |
| x2 | x1+l2*cosd(theta2) |
| y2 | y1+l2*sind(theta2) |
PROGRAM:
clear all  %close the workspace window
close all  %close the figure window
clc        %close the command window in every each time we execute the program

l1 = 10; %length of link 1
l2 = 5;  %length of link 2

theta1 = linspace(0,90,30) %angle assigned to theta1 from 0 to 90 in a 30 evenly spaced sequence
theta2 = linspace(0,90,30) %angle assigned to theta2 from 0 to 90 in a 30 evenly spaced sequence

ct=1 %counter value is assigned to 1
for i = 1 : length(theta1) %included a for loop and introduced a variable called 'i' and assigned with different positions (here it's 1 to 30)
    THETA1 = theta1(i)     %in every iteration a value for angle will assign to THETA1 with respect to the position

    for j = 1 : length(theta2)  %included a for loop and introduced a variable called 'j' and assigned with different positions (here it's 1 to 30)
        THETA2 = theta2(j)      %in every execution a value for angle will assign to THETA2 with respect to the position


x0 = 0;  %x-coordinate of the base point of first link
y0 = 0;  %y-coordinate of the base point of first link

x1 = l1*cosd(THETA1);   %x-coordinate of the end point of first link and the base point of the second link

y1 = l1*sind(THETA1);   %y-coordinate of the end point of first link and the base point of the second link

x2 = x1+l2*cosd(THETA2);  %x-coordinate of the end point of the second link
y2 = y1+l2*sind(THETA2);  %y-coordinate of the end point of the second link


plot([x0 x1], [y0 y1],[x1 x2], [y1 y2],'linewidth',3) %to plot the required figure by providing line width
title('FORWARD KINEMATICS OF A 2R ROBOTIC ARM') %title of the plot
axis([-1 15 0 15])  %values of origin and end limits for the x and y axis
grid on  %to display grid in the plot
xlabel('x axis') %name of x axis
ylabel('y axis') %name of y axis
pause (0.008)    %to pause the iteration for every 0.008 seconds
M(ct) = getframe(gcf)  %Each and every frame which is ct is saved to an array called 'M'
ct =ct+1               %to change the counter value to next value after each iteration of the loop

    end  %end the second for loop

end      %end the first for loop

movie(M) %to generate a movie with all those frames which is saved in an array called 'M'
videofile = VideoWriter('challenge_forward_kinematics.avi','Uncompressed AVI');
%VideoWriter is the command to create videofile, followed by including file name and profile inside a bracket and allocated it to videofile
open(videofile) %to open the videofile for writing
writeVideo(videofile,M) %writes the image data 'M' to the videofile
close(videofile) %close the videofile
PROGRAM RESULT:
- A video file regarding the animation of 2R Robotic Arm is created.
- Successfully uploaded the required file in the youtube.
YOUTUBE LINK: https://youtu.be/JjAD76q_RnY
ERRORS FACE WHILE PRORAMMING:
I had made a mistake while coding regarding the command to write data from an array to the videofile associated with the 'videofile'(see in line:48).
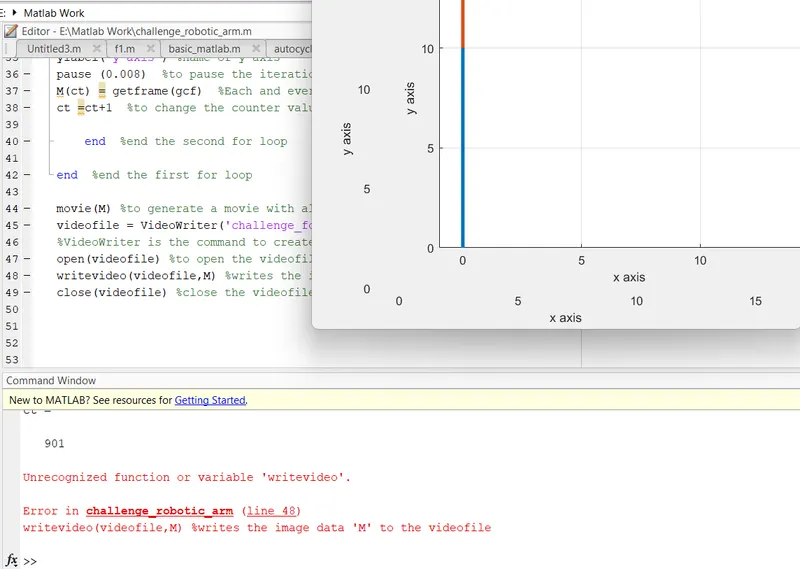
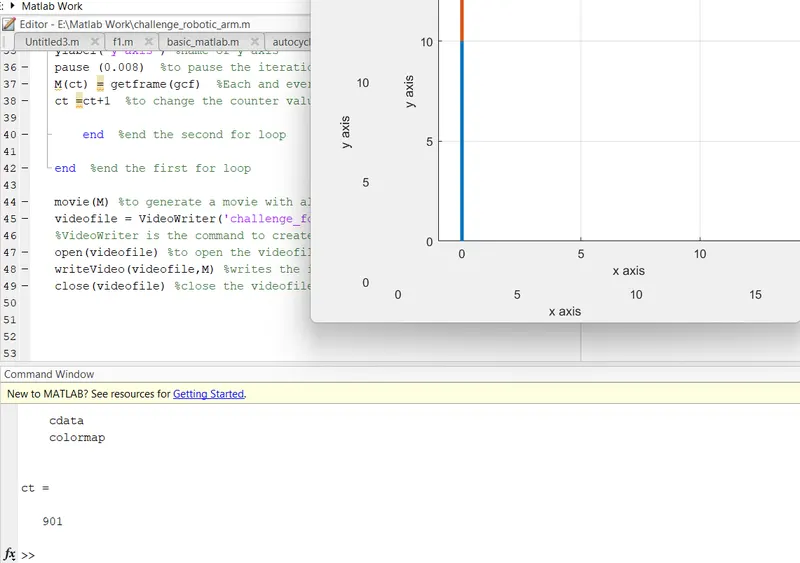
The right way to input the command is 'writeVideo', the letter 'V' should be uppercase.
EXPLANATION FOR CODE:
- Started the program using clear all, close all and clc.
- Provided the input values of l1 and l2.
- Provided the values for theta1 and theta2 by the linspace command from 0 to 90 degree in a 30 evenly spaced sequence.
- Provided the ct (counter) value. Here I provided 1.
- 'for' command is used to initialize the 'for loop' of the first link and again a for loop command is inroduced for the for loop of the second link.
- Assigned the values of x0,y0,x1,y1,x2 and y2 as shown in the program.
- By the 'plot' command all coordinate values are plotted by providing neccessary line width.
- 'title' command is used to introduce the title for the plot.
- Provided the axis size by 'axis' command.
- Switch the grid inside the plot by 'grid on' command.
- Name of x-axis and y-axis are provided by the 'xlabel' and 'ylabel' command respectively.
- 'pause' command is used to pause the execution for prescribed amount of time. Here in the program it is 0.008 sec.
- Each figure after completing the execution is saved in a file called 'M'.
- An increment for ct is provided at the end of each execution. Here the ct will increase +1 after each execution.
- After completing the two loops, the end command is entered twice.
- 'movie' command is used to create the movie by using the frames which was saved in the file 'M'.
- 'VideoWriter' command is used to create the videofile, followed by a bracket a file name and profile is entered.
- Use the 'open' command to open the video file for writing.
- 'writeVideo' is used for write the video. Here its write it into 'M'.
- Then 'close' command is used to close the videofile.