Project 1 - Parsing NASA thermodynamic data
PARSING NASA THERMODYNAMIC DATA
AIM:
- To write a function that extracts the 14 co-efficients and calculates the enthalpy, entropy and specific heats for all the species in the data file.
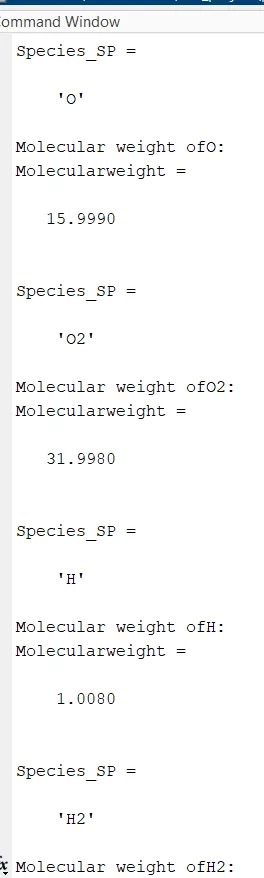
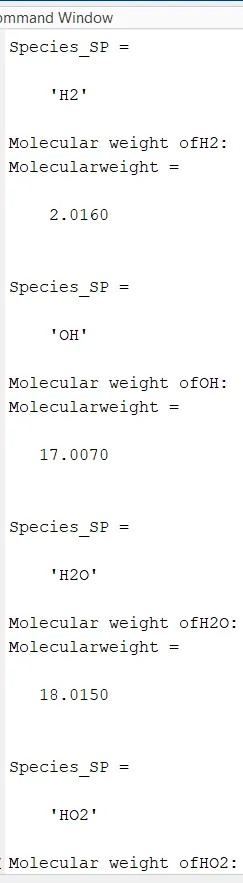
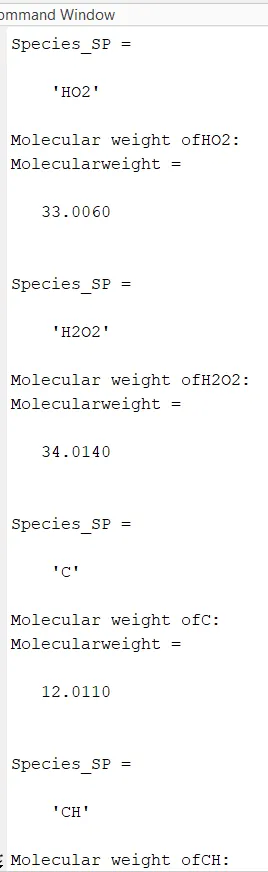
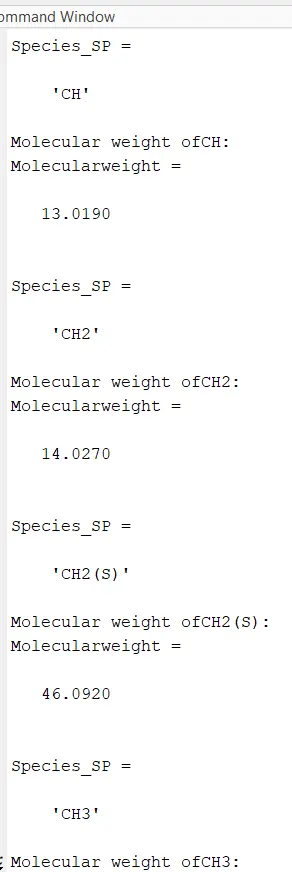
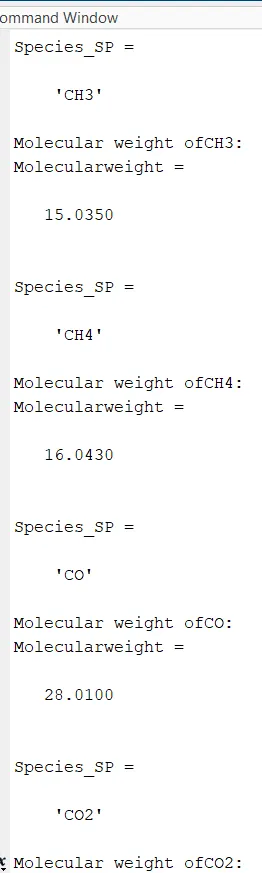
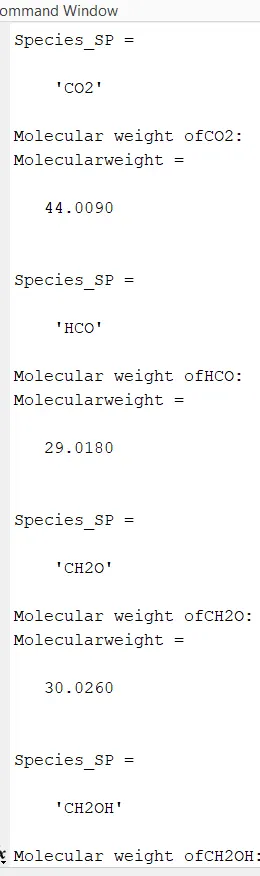
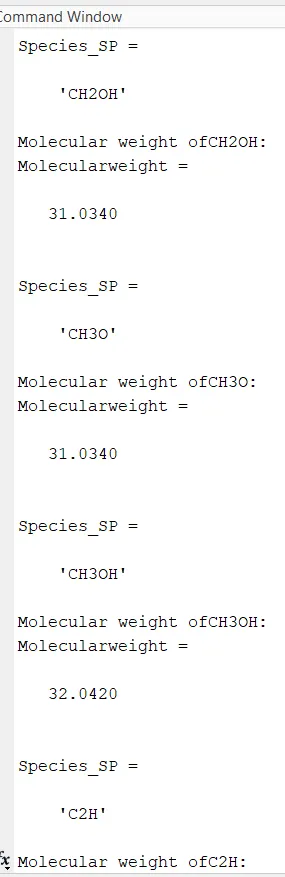
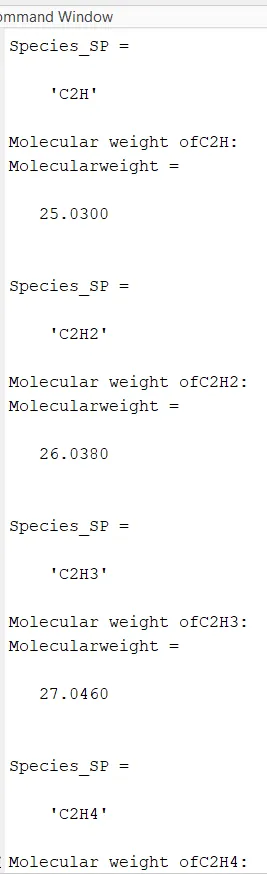
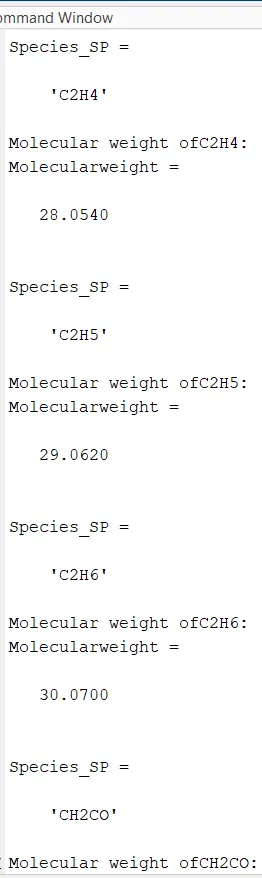
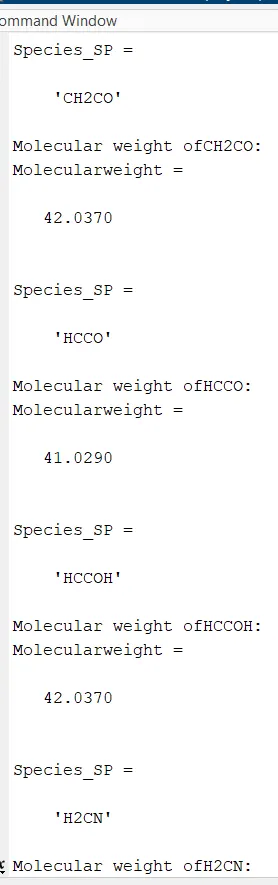
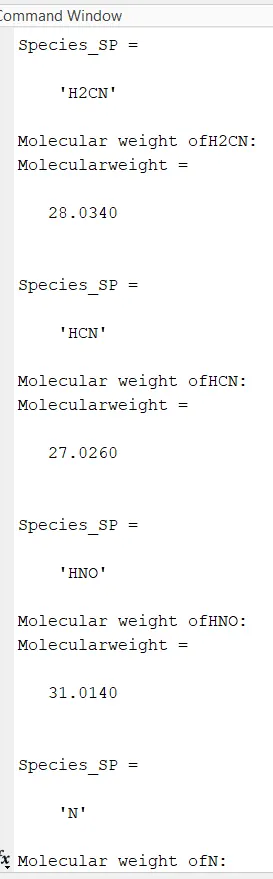
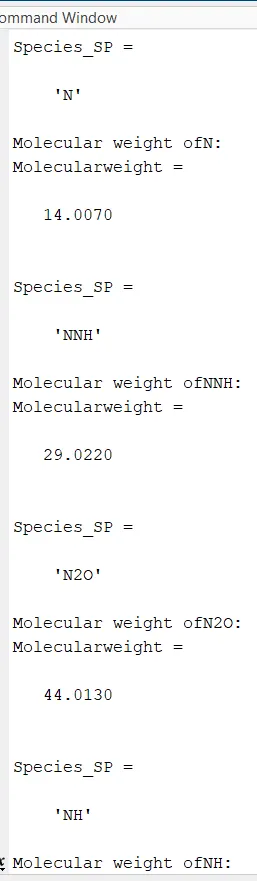
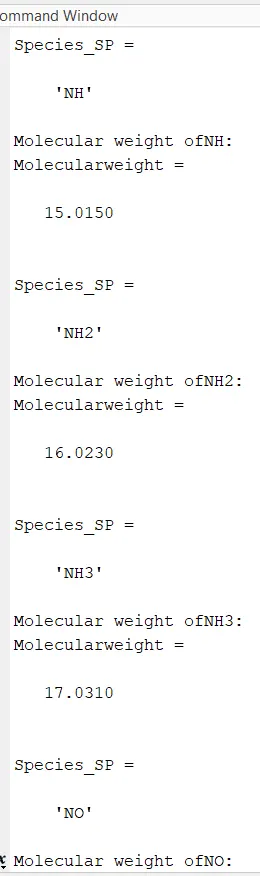
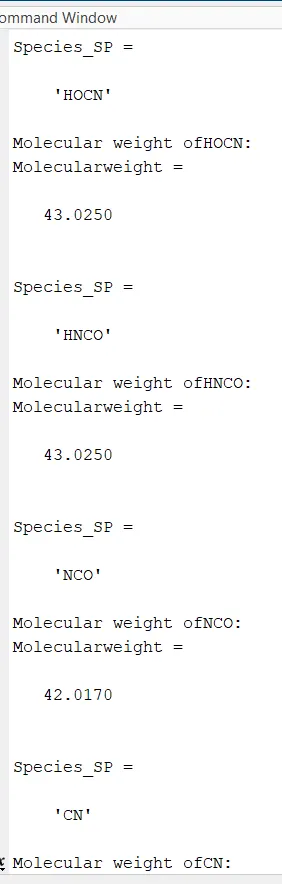
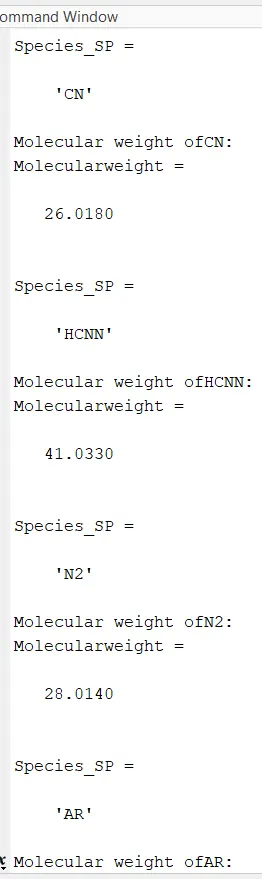
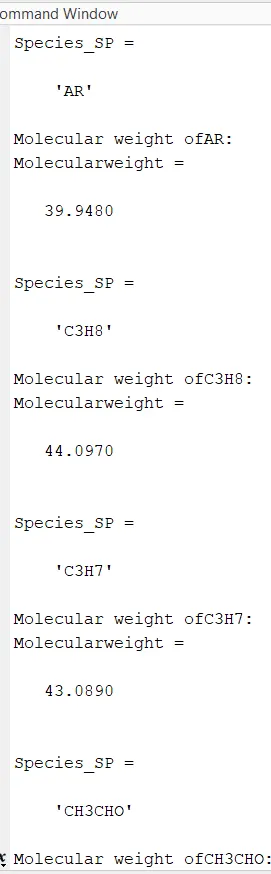
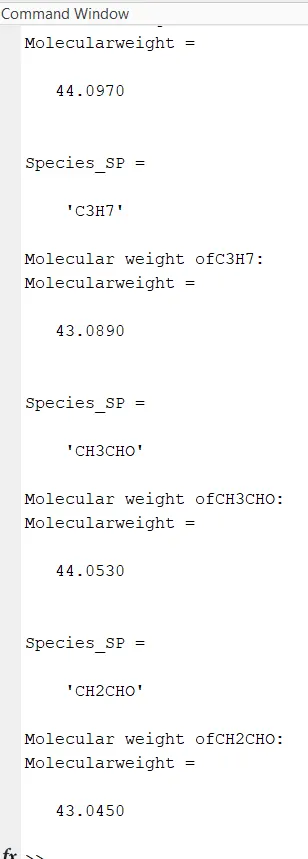
- To calculate the molecular weight of each species and display it in the command window.
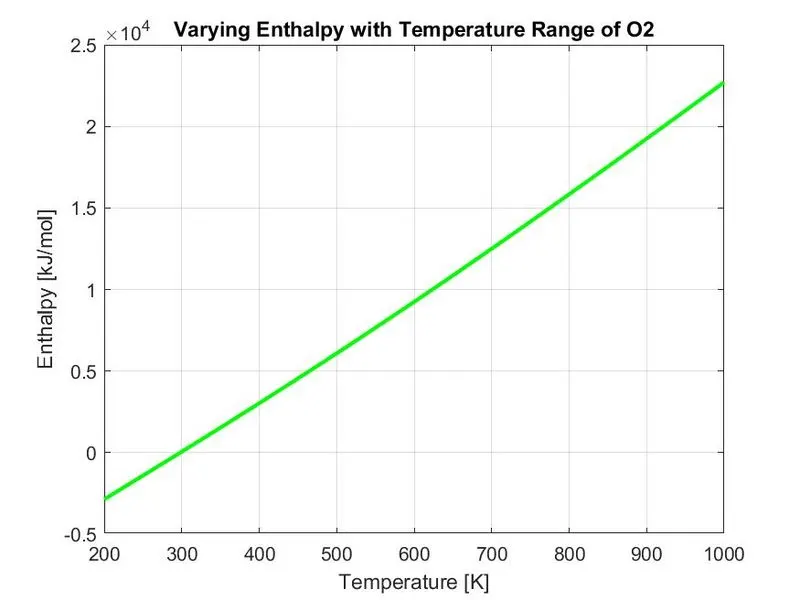
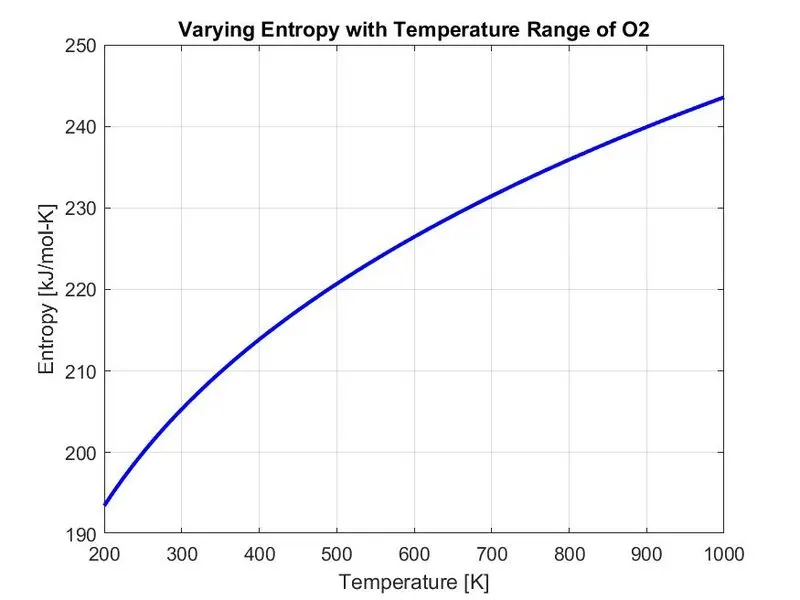
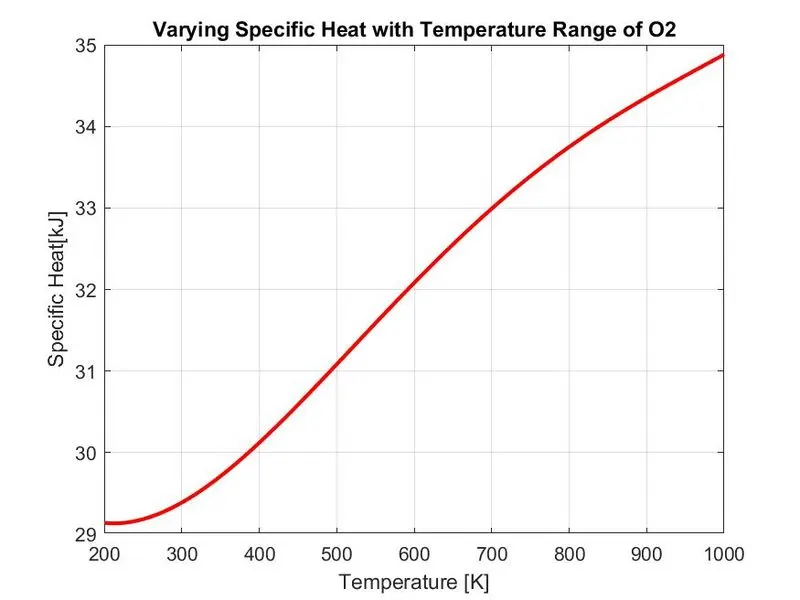
- To plot the Cp, Enthalpy and Entropy for the local temperature range (low temperature : high temperature) specific for each species.
- To save the plots as images with appropriate names and dump them in separate folders for each species with suitable name.
THEORY:
FILE PARSING
Parsing a file means reading in a data stream and building a memory model of the content of that data. This aims at facilitating perfoming some kind of transformation on the data. Parsing splits a file or other input into pieces of data that can be easily stored or manipulated.
EQUATIONS USED
- Cp - Specific Heat
- H - Enthalpy
- S - Entropy
- R - Universal Gas Constant
- T - Temperature
- a1 to a7 - High Temperature Coefficients
- a8 to a14 - Low Temperature Coefficients
FUNCTION TO SOLVE FOR SPECIFIC HEAT
%function to solve the equation to find specific heat by inputting
%the coefficients, global temperature ranges, universal gas constant and
%global medium temperature
function [cp] = specific_heat(a1,a2,a3,a4,a5,a6,a7,a8,a9,a10,a11,a12,Temp,R,t2)
if Temp <= t2
    cp = R*( a8 + (a9.*Temp) + (a10.*Temp.^2) + (a11.*Temp.^3) + (a12.*Temp.^4) );
else
    cp =R*( a1 + (a2.*Temp) + (a3.*Temp.^2) + (a4.*Temp.^3) + (a5.*Temp.^4) );
end
FUNCTION TO SOLVE FOR ENTHALPY
%function to solve the equation to enthalpy by inputting
%the coefficients, global temperature ranges, universal gas constant and
%global medium temperature
function [H] = enthalpy(a1,a2,a3,a4,a5,a6,a7,a8,a9,a10,a11,a12,a13,a14,Temp,R,t2)
if Temp <= t2
    H = R.*Temp.*( a8 + (a9.*(Temp./2)) + (a10.*(Temp.^2)./3) + (a11.*(Temp.^3)./4) + (a12.*(Temp.^4)./5) + (a13./Temp) );
else
    H = R.*Temp.*( a1 + (a2.*(Temp./2)) + (a3.*(Temp.^2)./3) + (a4.*(Temp.^3)./4) + (a5.*(Temp.^4)./5) + (a6./Temp) );
end
FUNCTION TO SOLVE FOR ENTROPY
%function to solve the equation to find entropy by inputting
%the coefficients, global temperature ranges, universal gas constant and
%global medium temperature
function [S] = entropy(a1,a2,a3,a4,a5,a6,a7,a8,a9,a10,a11,a12,a13,a14,Temp,R,t2)
if Temp <= t2
    S = R *((a8.*log(Temp) + a9.*Temp + a10.*(Temp.^2)/2 + a11.*(Temp.^3)/3 + a12.*(Temp.^4)/4 + a14));
else
    S = R *((a1.*log(Temp) + a2.*Temp + a3.*(Temp.^2)/2 + a4.*(Temp.^3)/3 + a5.*(Temp.^4)/4 + a7));
end
FUNCTION TO SOLVE FOR MOLECULAR WEIGHT
%function to find molecular weight
function Molecularweight = Molecular_weight(Species_SP)                %input is given as Species_SP
atomic_name = ['H','C','O','N','A','S'];                               %atomic names

fprintf('Molecular weight of')                                         %printing "Molecular weight of
fprintf(Species_SP)                                                    %printing the respective Species_SP
fprintf(':')                                                           %printing semicolon
Atomic_Weight = [1.008 12.011 15.999 14.007 39.948 32.065];            %assigning the atomic weight w.r.t to the atomic name
Molecularweight = 0;                                                   %Molecular weight assigned to zero

for i = 1:length(Species_SP) ;
    for j = 1:length(atomic_name);
        if strcmpi(Species_SP(i),atomic_name(j));                       %comparing the input arguments like Species_SP with atomic_name
            Molecularweight = Molecularweight + Atomic_Weight(j);       %finding molecular weight
            position = j;                                               %assigning position as value of j
        end
    end

n = str2num(Species_SP(i));                                             %assigning number of same elements

if n>1
    Molecularweight = Molecularweight + Atomic_Weight(position)*(n-1);  %finding molecular weight if there is ame element of more than 1
end
end
fprintf('molecularweight %s :',Species_SP);
fprintf('%d, Molecularweight');
disp(' ')
end
MAIN PROGRAM
clear all
close all
clc

f1 = fopen('THERMO.dat','r')   %opens up the thermodynamic data

fgetl(f1);
A = fgetl(f1);                  %reading global temperature line and allocating to A
global_temp = strsplit(A,' ');  %splitting global temperature where there is
T1 = str2num(global_temp{2});   %global low temperature
T2 = str2num(global_temp{3});   %global medium temperature
T3 = str2num(global_temp{4});   %global high temperature
R = 8.314;                      %Universal gas constant

for i = 1 : 3                   %reading next three lines
fgetl(f1);
end


for i = 1:53
tline = fgetl(f1);              %reading first line of species set
B = strsplit(tline,' ')         %splitting the line where there is
Species_SP = B{1}               %first string character in that line is taken and assigned to Species_SP

%temperature
t1 = str2num(B{end-3}) ;           %local low temperature
t2 = str2num(B{end-2})  ;          %local medium temperature
t3 = str2num(B{end-1})   ;         %local high temperature

Temp = linspace(t1,t3,1000)        %making an array of temperatures from local low to high temperature in an 1000 evenly spaced sequence

%newline
tline2 = fgetl(f1);                    %next line is taken into consideration
c = findstr(tline2,'E');               %find the positions of 'E' in each coefficients
a1 = str2num(tline2(1:12+3));          %then extracts each coefficients from 1 to 5
a2 = str2num(tline2(c(1)+4:c(2)+3));
a3 = str2num(tline2(c(2)+4:c(3)+3));
a4 = str2num(tline2(c(3)+4:c(4)+3));
a5 = str2num(tline2(c(4)+4:c(5)+3));

%newline
tline3 = fgetl(f1);                    %next line is taken into consideration
a6 = str2num(tline3(1:12+3));          %then extracts each coefficients from 6 to 10
a7 = str2num(tline3(c(1)+4:c(2)+3));
a8 = str2num(tline3(c(2)+4:c(3)+3));
a9 = str2num(tline3(c(3)+4:c(4)+3));
a10 = str2num(tline3(c(4)+4:c(5)+3));

%newline
tline4 = fgetl(f1);                    %next line is taken into consideration
a11 = str2num(tline4(1:12+3));         %then extracts each coefficients from 11 to 14
a12 = str2num(tline4(c(1)+4:c(2)+3));
a13 = str2num(tline4(c(2)+4:c(3)+3));
a14 = str2num(tline4(c(3)+4:c(4)+3));


cp = specific_heat(a1,a2,a3,a4,a5,a6,a7,a8,a9,a10,a11,a12,Temp,R,t2);    %called the function specific heat to find specific heat

H = enthalpy(a1,a2,a3,a4,a5,a6,a7,a8,a9,a10,a11,a12,a13,a14,Temp,R,t2);  %called the function enthalpy to find enthalpy

S = entropy(a1,a2,a3,a4,a5,a6,a7,a8,a9,a10,a11,a12,a13,a14,Temp,R,t2);   %called the function entropy to find entropy

Molecularweight = Molecular_weight(Species_SP)                           %called the function molecular weight to find molecular weight

Molecular_list = fopen('Molecular weight.txt','a+');
fprintf(Molecular_list,'Molecular weight of %s is %d n',Species_SP,Molecularweight);
fclose(Molecular_list);

cur_dir = pwd;        %to access the location to save the file
mkdir(Species_SP);    %to create a folder having name of the respective Species_SP
cd(Species_SP);       %to change the folder

%figure 1 representing the plot of Temperature vs specific heat diagram
figure(1)
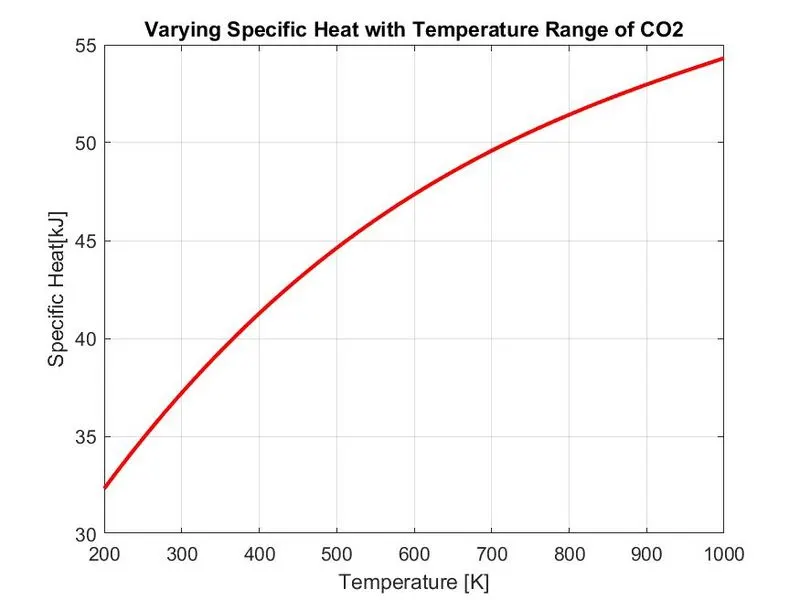
plot(Temp,cp,'linewidth',2,'color','r');   %to plot the diagram
xlabel('Temperature [K]');                 %naming x-label
ylabel('Specific Heat[kJ]');               %naming y-label
title(sprintf('Varying Specific Heat with Temperature Range of %s',Species_SP));  %naming title for the plot
grid on                                    %switching the grid
saveas(figure(1),'Specific Heat.jpg');     %saving the figure

%figure 2 representing the plot of Temperature vs enthalpy diagram
figure(2)
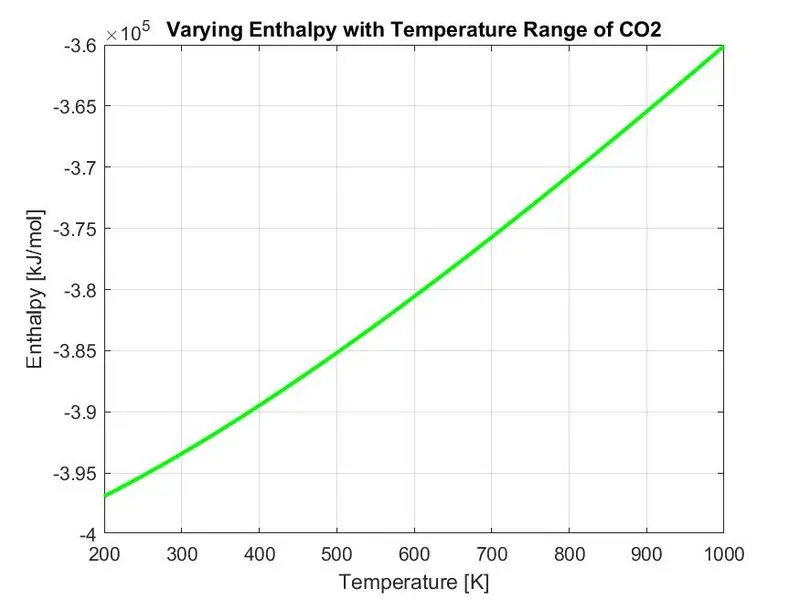
plot(Temp,H,'linewidth',2,'color','g');    %to plot the diagram
xlabel('Temperature [K]');                 %naming x-label
ylabel('Enthalpy [kJ/mol]');               %namig y-label
title(sprintf('Varying Enthalpy with Temperature Range of %s',Species_SP));       %naming title for the plot
grid on                                    %switching the grid
saveas(figure(2),'Enthalpy.jpg');          %saving the figure

%figure 3 representing the plot of Temperature vs entropy diagram
figure(3)
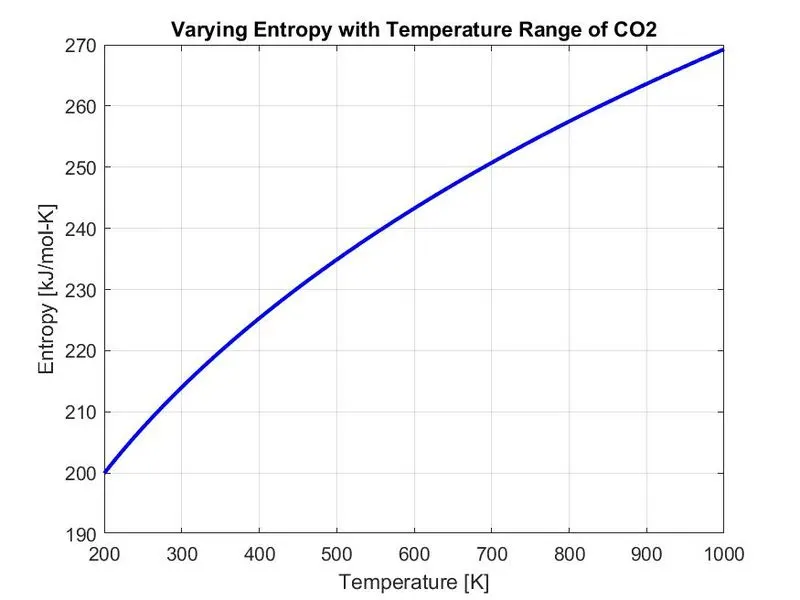
plot(Temp,S,'linewidth',2,'color','b');    %to plot the diagram
xlabel('Temperature [K]');                 %naming x-label
ylabel('Entropy [kJ/mol-K]');              %naming ylabel
title(sprintf('Varying Entropy with Temperature Range of %s',Species_SP));        %naming title for the plot
grid on                                    %switching the grid
saveas(figure(3),'Entropy.jpg');           %saving the figure

cd(cur_dir)                                %assigning folder location

endOUTPUT:
MOLECULAR WEIGHT OF EACH SPECIES
PLOTTING
ENTHALPY, ENTROPY, SPECIFIC HEAT VS TEMPERATURE DIAGRAM OF "O2"
ENTHALPY, ENTROPY, SPECIFIC HEAT VS TEMPERATURE DIAGRAM OF "N2"
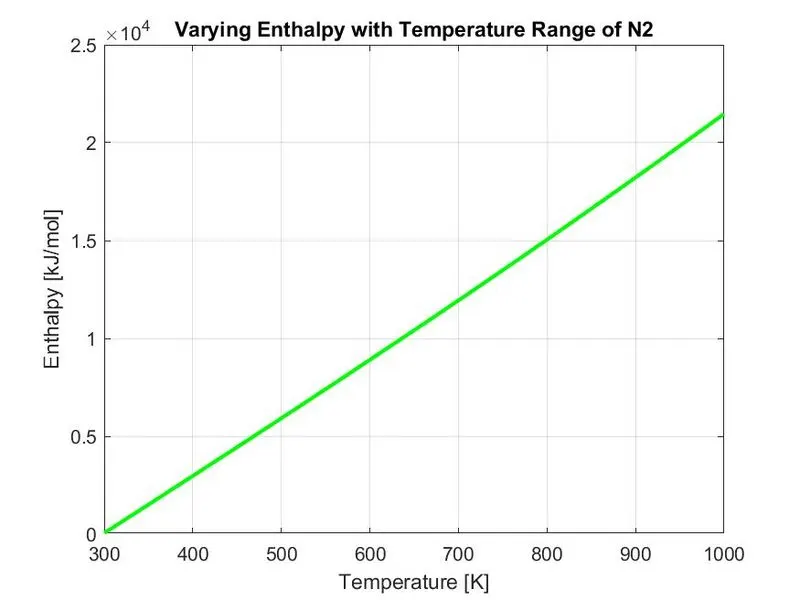
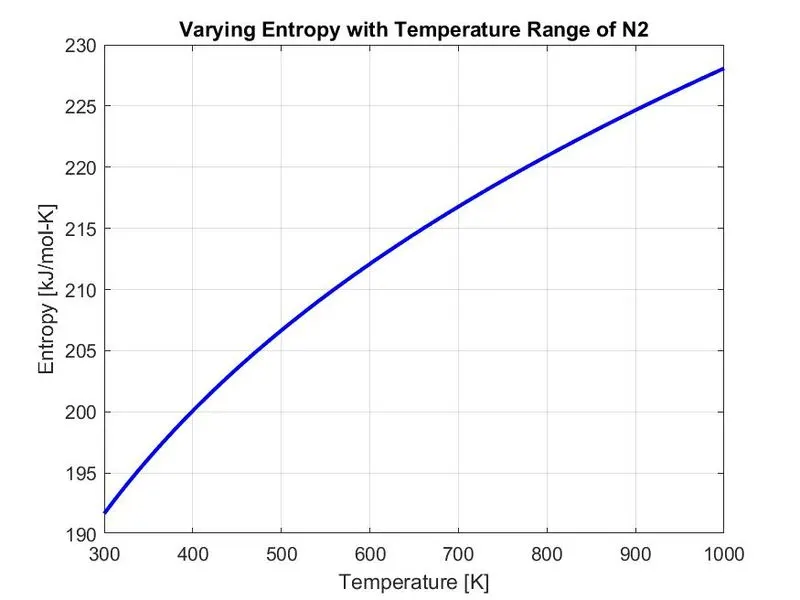
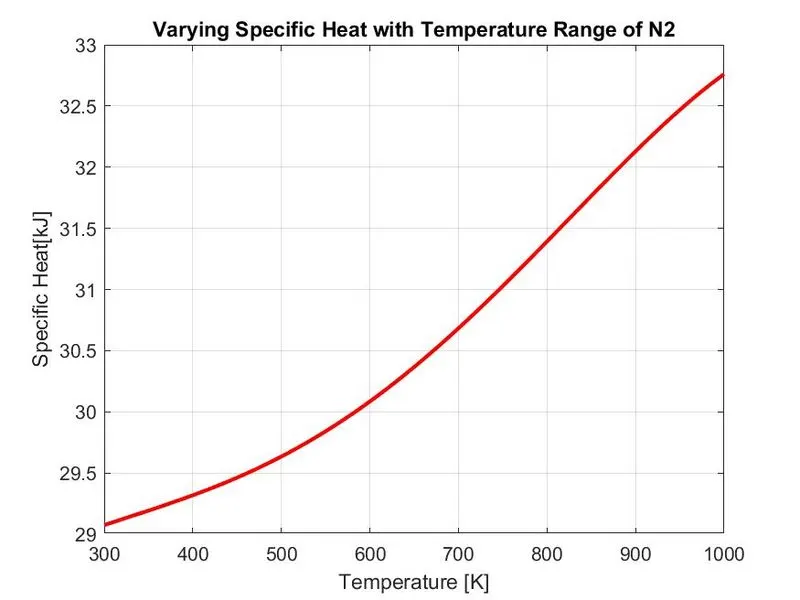
ENTHALPY, ENTROPY, SPECIFIC HEAT VS TEMPERATURE DIAGRAM OF "CO2"
SCREENSHOT OF PLOTS OF WHOLE 53 SPECIES SAVED IN SEPERATE FOLDERS

EXPLANATION
FUNCTION TO FIND CP, H AND S
- Funcion is created for the desired properties like Cp, H and S.
- The input required for to find Cp, H, and S are given like high and low temperature coefficients, local mean temperature, low and high temperature ranges and Universal gas constant.
- Equation to be solved is coded and assigned to the desired output property.
FUNCTION TO FIND MOLECULAR WEIGHT
- In the function the Species_SP is given as input.
- Atmoic names are introduced in an array.
- Atomic weight w.r.t the atomic name is also introduced.
- Initially molecular weight is assigned to be zero.
- In a for loop a variable called 'i' is introduced having length of 1 to length of Species_sp and variable 'j' is also introduced having a length of 1 to length of atomic name.
- In the next line the Species_SP is compared with atomic name by a command called "strcmpi'. When that two variables become same the atomic weight is calculated, then the current value of j is allocated to position.
- When Species_SP is having more than one same value, then "n" is calculated to find the corresponding mass of the same in the next if loop.
MAIN PROGRAM
- In this program the coefficients of different species from the thermodynamic data are extracted to solve and find the Cp, H, S and Molecular weight.
- The required data is opened by "fopen" command.
- "fgetl" command is used to get each line.
- To extract global temperature from the line, "strsplit command is used and neccessary delimiter is given, here is given and found the temperature.
- Value for Universal Gas Constant is introduced.
- For loop introduced and it should perform 53 times inorder to extract the 53 sets of species coefficicents and local temperatures.
- Local temperature has been extracted by "strsplit" command and found low, medium and high local temperatures.
- Temperature range is introduced by "linspace command".
- And all coefficients are found.
- Functions are called to find Cp, H, S and molecular weight.
- "pwd' command is used to get the file location.
- "mkdir" command is used to create new folder to store the plots.
- "cd" command is used to change the folder.
- Differents plots are created.
- "saveas" command is used to store the plots.
CONCLUSION:
- Molecular weight of each species has been found and screenshots are attached.
- Plots are created as per the instruction and stored in each folders which is named by corresponding species.