Week 2- 2R Robotic Arm Challenge
Challenge-skill lync -MAYUR SHINDE
Aim :
forward kinematics of 2R robotic arm manupulater.
Objectives :
Kinematics of linkagers.Animate the two linkages of robotic arm using matlab .
Problem statements:
How the robot is going to move.
What is the final position of manupulater
Body of the content:
Solution:
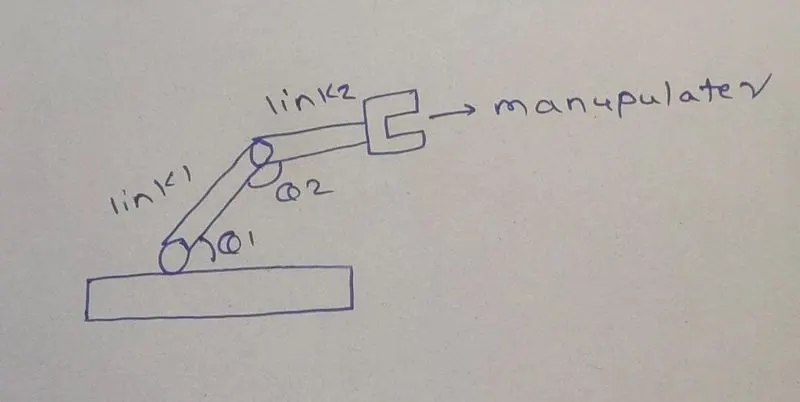
Step 1: calculate the position of link 1
The coordinate of starting point of link 1 is (0,0)
The coordinate of ending point of link 1 is (lcostheta,lsintheta)
Step 2: calculate the position of link 2
We have two points of link 2
1: ending point of theta 1 (x1,y1)
2: the end manupulater (x2,y2)
X2=x1+l2cos(theta2)
Y2= y1+l2sin(theta2)
We have coordinates of three points = [x0 y0] [x1 y1] [x2 y2]
lets begin the programming part in matlab
we should start with
%forward kinematics of 2R robotic arm manupulater
Then type
Clear all
Close all
clc
after that we should define some inputs
%inputs
L1 is going to be the length of first link
L2 is going to be the length of second link
L1:1;
L2:0.5;
We need to have ‘theta1’ and ‘theta2’
Theta1 = 45;
Theta2 = 30;
We have three coordinates
X0 = 0;
y0 = 0;
this are the starting point of robot
x1 = l1*cosd(theta1);
y1 = l1*sind(theta1);
this are the ending point of link one which
x2 = x1+l2*cosd(theta2);
y2 = y1+l2*sind(theta2);
all above points are required for make a plot.
after that we have to make a plot for this program
we should start with line command and provide x coordinate of the two points that makup the line
line([x0 x1],[y0 y1]
then we are going to get ‘linewidth’ command which gives us thiker line which is 3
line([x0 x1],[y0 y1],’linewidth’,’3’
we will assign color for it
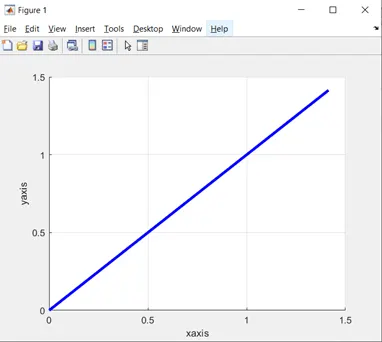
line([x0 x1],[y0 y1],’linewidth’,3,’color’b)
after we execute this program we get this plot.
For the second link we have to type
line([x1 x2],[y1 y2],’linewidth’,3,’color’g)
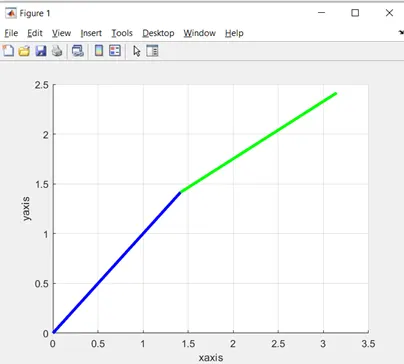
Above is the single plot program and after that we have to make the animation for the robotic arm
Lets start;
As usual we can start with
Clear all
Close all
clc
we have using the same think
%inputs
Length of link one is l1=1
Length of link one is l2=0.5 which is in metre
This time theta1& theta2 are going to be an array which is represent using ‘linspace’ command
Theta1 = linspace(0,90,10)
Theta2 = linspace(0,90,10)
Theta are 10 values between 0 to 90
And now we are going to using ‘for loop’ concept
For I = 1: length(theta1)
Theta2(i)
end
length of theta1 is the number of value in theta1 which is 0 to 90
for i we should have put I = 1:10 in the command window and the result is
>> i = 1:10
i =
1 2 3 4 5 6 7 8 9 10
If we type
Disp(‘hello’)
And delete the line theta2(i)
Then result in
hello
hello
hello
hello
hello
hello
hello
hello
hello
hello
Here we can also say
a= strcat(‘hello’, num2str(i);)
We are going to print hello followed by the number i
And the result is
a =
'hello1'
a =
'hello2'
a =
'hello3'
a =
'hello4'
a =
'hello4'
a =
'hello5'
a =
'hello6'
a =
'hello7'
a =
'hello8'
a =
'hello9'
a =
'hello10'
That is for loop does.
Then we are going to do
THETA1 = theta1(i)
THETA2= theta2(i)
As the value of I changes taking theta1&theta2
Capital THETA1 and THETA2 is an array contains only one value
And the other hand lower case theta1&theta2 has 10 values
Then we will copy the code of
l1 =1 ;
l2 = 0.5;
theta1=linspace(0,90,10);
theta2=linspace(0,90,10);
ct=1;
for i = 1:length(theta1)
THETA1=theta1(i);
for j = 1:length(theta2)
THETA2=theta2(j);
x0 = 0;
y0 = 0;
x1 = l1*cosd(THETA1);
y1 = l1*sind(THETA1);
x2 = x1+l2*cosd(THETA2);
y2 = y1+l2*sind(THETA2);
%plotting
line([x0 x1],[y0 y1],'linewidth',3,'color','b')
line([x1 x2],[y1 y2],'linewidth',3,'color','g')
end
end
result is
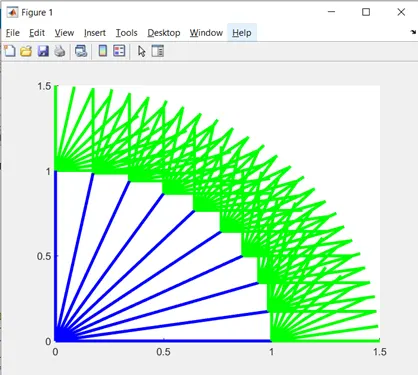
we have do some changes adding pause(0.3) and changes in the linspace command with
Theta1 = linspace(0,90,4)
Theta2 = linspace(0,90,4)
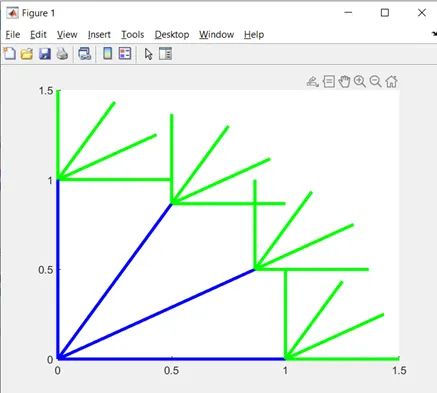
But still the plot is not looking good ,so what we can do
We delete the second line commad
And insert the coordinates [x1 x2] and [y1 y2] and linewidth is 3
And after executing this the problem is like different colors for each and every link, and the color is change randomly.
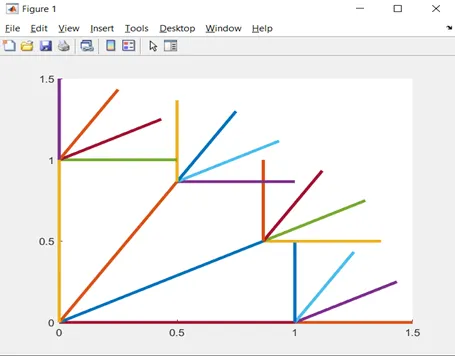
To make this clear we going to do fix our axis and change the x limits & y limits
Axis([0.1 1.5 0 1.5])
Now the plot is look more like an animation.
But still this is not the good solution we should have to make an animation.
We have to get individual frame that is like
M(ct)= getframe(gcf)
We are getting the frame that is in array called ‘M’
Then type,
Movie(m)
Videofile = videowriter(‘forward_kinematics.avi’,’Uncompressd Avi ’);
Once we have creat this file ,just open it,type
Open(videofile)
Write(videofile,M)
Close(videofile)
Now after going to execute the program its an a animation,and its play the movie
Now go to the location where the movie was saved,and just play it,and see the animation.
Here is the link for watch an animation
https://drive.google.com/file/d/1lWn5fRtVRiC77UTQb_Yfe4NO_W6cCP13/view?usp=sharing
conclusion: finally we getting an movie animation for robobotic arm with the help of matlab.
 clear all
close all
clc

%inputs
l1 =1 ;
l2 = 0.5;

theta1=linspace(0,90,10);
theta2=linspace(0,90,10);
ct=1;
for i = 1:length(theta1)
    THETA1=theta1(i);
    for j = 1:length(theta2)
        THETA2=theta2(j);
         x0 = 0;
         y0 = 0;

         x1 = l1*cosd(THETA1);
         y1 = l1*sind(THETA1);

         x2 = x1+l2*cosd(THETA2);
         y2 = y1+l2*sind(THETA2);

         %plotting
         plot([x0 x1],[y0 y1],[x1 x2],[y1 y2],'linewidth',3)
         axis([0.1 1.5 0 0.5])
         pause(0.03)
         M(ct)= getframe(gcf);
         ct=ct+1;
    end
end

movie(M)

https://drive.google.com/file/d/1lWn5fRtVRiC77UTQb_Yfe4NO_W6cCP13/view?usp=sharing
% forward kinematics of a 2R Robotic arm manipulater
clear all
close all
clc
%inputs
l1 = 2;
l2 = 2;
theta1 = 45;
theta2 = 30;
%coordinates
x0 = 0;
y0 = 0;
x1 = l1*cosd(theta1);
y1 = l1*sind(theta1);
x2 = x1+l2*cosd(theta2);
y2 = y1+l2*sind(theta2);
%plotting
line([x0 x1],[y0 y1],'linewidth',3,'color','b')
line([x1 x2],[y1 y2],'linewidth',3,'color','g')
grid on
xlabel('xaxis')
ylabel('yaxis')