Project 1 - Parsing NASA thermodynamic data
Aim:
parsing NASA thermodynamic data
objective:
- Write a function that extracts the 14 co-efficients and calculates the enthalpy, entropy and specific heats for all the species in the data file.
- Calculate the molecular weight of each species and display it in the command window.
What is file parsing:
Parsing a file means reading in a data stream and building a memory model of the content of that data. This aims at facilitating perfoming some kind of transformation on the data. Parsing splits a file or other input into pieces of data that can be easily stored or manipulated.
specific heat:
cp is called the specific heat at constant pressure and is related to the universal gas constant of the equation of state. This final equation is used to determine values of specific enthalpy for a given temperature.
cp=(a1+a2.*T+a3.*T.^2+a4.*T.^3+a5.*T.^4)*R;
enthalpy:
a thermodynamic quantity equivalent to the total heat content of a system. It is equal to the internal energy of the system plus the product of pressure and volume.
H=(a1+(a2.*T)/2+(a3.*T.^2)/3+(a4.*T.^3)/4+(a5.*T.^4)/5+(a6./T))*R.*T.
Entropy:
Entropy is a statistical measure of randomness that can be used to characterize the texture of the input image. Entropy is defined as -sum(p. *log2(p)) .
s=a1.*log(T)+a2.*T+(a3.*T.^2)/2+(a4.*T.^3)/3+(a5.*T.^4)/4+a7;
Gas constant:
the constant of proportionality in the gas equation. It is equal to 8.314 joule kelvin−1 mole−1
formula for calculating specific heat,entropy and enthalpy:
cp=(a1+a2.*T+a3.*T.^2+a4.*T.^3+a5.*T.^4)*R;
H=(a1+(a2.*T)/2+(a3.*T.^2)/3+(a4.*T.^3)/4+(a5.*T.^4)/5+(a6./T))*R.*T;
s=a1.*log(T)+a2.*T+(a3.*T.^2)/2+(a4.*T.^3)/3+(a5.*T.^4)/4+a7;
whereas ,
R=universal gas constant
T=temperature
Cp=specific heat(k)
S=entropy(kj/mol-k)
H=enthalpy(kj/mol)
a=coefficient where ,i 1 to 14
main code:
clear all
close all
clc
%input
R = 8.314; %gas constant
%reading data file
%open file and reading THERMO.dat file
f1 = fopen('THERMO.dat','r');
get = fgetl(f1);
%now reading temperature from this file
temp = fgetl(f1);
%slpiting
x = strsplit(temp);
%converting string into numbers
templow = str2num(x{2});
tempmid = str2num(x{3});
temphigh = str2num(x{4});
%temperature range
T = linspace(templow,temphigh,1000);
%skipping comment lines
for i = 1:3
get = fgetl(f1);
end
% reading the species
for i = 1:53
tline=fgetl(f1);
A=strsplit(tline,' '); %splitting into cell
species = (A{1});
%converting string into number
lowtemp = str2num(A{end-3});
midtemp = str2num(A{end-2});
hightemp = str2num(A{end-1});
t1= lowtemp;
t2= midtemp;
t3= hightemp;
tline1 = fgetl(f1);
% to find the position of E from line 1
a = strfind(tline1,'E');
%to extract the 14 coefitients
a1 = tline1 (1:a(1)+3); %getting line 1
a1 = str2double(a1); %converting string to number
a2=tline1(a(1)+4:a(2)+3);
a2=str2double(a2);
a3=tline1(a(2)+4:a(3)+3);
a3=str2double(a3);
a4=tline1(a(3)+4:a(4)+3);
a4=str2double(a4);
a5=tline1(a(4)+4:a(5)+3);
a5=str2double(a5);
tline2 = fgetl(f1); %getting line 2
b=strfind(tline2,'E');
a6=tline2(1:b(1)+3);
a6=str2double(a6);
a7=tline2(b(1)+4:b(2)+3);
a7=str2double(a7);
a8=tline2(b(2)+4:b(3)+3);
a8=str2double(a8);
a9=tline2(b(3)+4:b(4)+3);
a9=str2double(a9);
a10=tline2(b(4)+4:b(5)+3);
a10=str2double(a10);
tline3=fgetl(f1);
c=strfind(tline3,'E');
a11=tline3(1:c(1)+3);
a11=str2double(a11);
a12=tline3(c(1)+4:c(2)+3);
a12=str2double(a12);
a13=tline3(c(2)+4:c(3)+3);
a13=str2double(a13);
a14=tline3(c(3)+4:c(4)+3);
a14=str2double(a14);
mkdir(['C:\Users\DELL\Documents\MATLAB\species\',species]) %creating a folder
for k=1:length(t3)
if T(k)>t2
%high temperature coefficients.
cp=(a1+a2.*T+a3.*T.^2+a4.*T.^3+a5.*T.^4)*R;
H=(a1+(a2.*T)/2+(a3.*T.^2)/3+(a4.*T.^3)/4+(a5.*T.^4)/5+(a6./T))*R.*T;
s=a1.*log(T)+a2.*T+(a3.*T.^2)/2+(a4.*T.^3)/3+(a5.*T.^4)/4+a7;
else
%low temperature coefficients.
cp=(a8+a9.*T+a10.*T.^2+a11.*T.^3+a12.*T.^4)*R;
H=(a8+(a9.*T)/2+(a10.*T.^2)/3+(a11.*T.^3)/4+(a12.*T.^4)/5+(a13./T))*R.*T;
s=a8.*log(T)+a9.*T+(a10.*T.^2)/2+(a11.*T.^3)/3+(a12.*T.^4)/4+a14;
end
end
%plotting graphs
figure(1);
plot(T,cp);
grid on ;
title(species);
xlabel('temperature');
ylabel('specific heat');
figure(2);
plot(T,H);
grid on ;
title(species);
xlabel('temperature');
ylabel('Enthalpy');
figure(3);
plot(T,s);
grid on ;
title(species);
xlabel('temperature');
ylabel('Entropy');
%changing the directory and saving the file
cd(['C:\Users\DELL\Documents\MATLAB\species\',species])
saveas(1,'secific heat','jpg');
saveas(2,'enthalpy','jpg');
saveas(3,'entropy','jpg');
%molecular weight calculation
elements=['H','C','O','N','A'];
atomic_weight=[1.0079 12.0107 15.999 14.00673 39.948];
mol_mass=0
for i=1:length(species)
for m=1:length(atomic_weight)
if strcmp(species(1),elements(m))
mol_mass=mol_mass+atomic_weight(m);
position=m
end
end
n=str2double(species(1));
if n>1
mol_mass=mol_mass+atomic_weight(position)*(n-1);
end
end
sprintf('molecular weight of %s:%f u',species,mol_mass)
end
fclose(f1)
errors:
1 File: file_parsing.m Line: 39 Column: 1
At least one END is missing. The statement beginning here does not have a matching end.
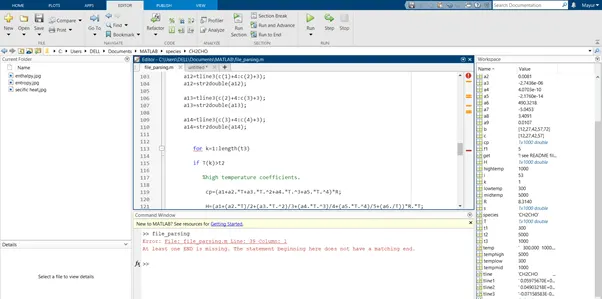
Step to overcome this error:
There is a error above is for one end missing foe loop
After adding final end the results are showing properly
- Dot indexing is not supported for variables of this type.
Error in file_parsing (line 128) cp=(a8+a9.T+a10.*T.^2+a11.*T.^3+a12.*T.^4)*R;
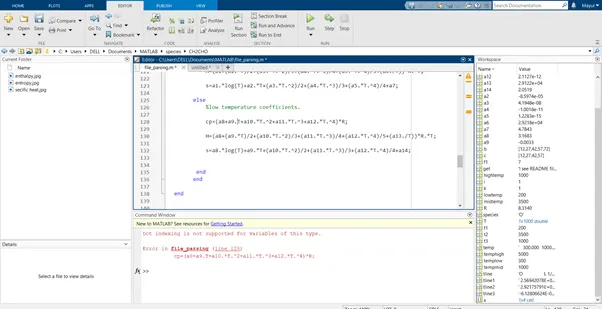
Step to overcome this error:
The error is missing the operature *
After adding this operater the results are proper showing.
The molecular weight of all species:
'molecular weight of O:15.999000 u'
'molecular weight of O2:31.998000 u'
'molecular weight of H:1.007900 u'
'molecular weight of H2:2.015800 u'
'molecular weight of OH:31.998000 u'
'molecular weight of H2O:3.023700 u'
'molecular weight of HO2:3.023700 u'
'molecular weight of H2O2:4.031600 u'
'molecular weight of C:12.010700 u'
'molecular weight of CH:24.021400 u'
'molecular weight of CH2:36.032100 u'
'molecular weight of CH2(S):72.064200 u'
'molecular weight of CH3:36.032100 u'
'molecular weight of CH4:36.032100 u'
'molecular weight of CO:24.021400 u'
'molecular weight of CO2:36.032100 u'
'molecular weight of HCO:3.023700 u'
'molecular weight of CH2O:48.042800 u'
'molecular weight of CH2OH:60.053500 u'
'molecular weight of CH3O:48.042800 u'
'molecular weight of CH3OH:60.053500 u'
'molecular weight of C2H:36.032100 u'
'molecular weight of C2H2:48.042800 u'
'molecular weight of C2H3:48.042800 u'
'molecular weight of C2H4:48.042800 u'
'molecular weight of C2H5:48.042800 u'
'molecular weight of C2H6:48.042800 u'
'molecular weight of CH2CO:60.053500 u'
'molecular weight of HCCO:4.031600 u'
'molecular weight of HCCOH:5.039500 u'
'molecular weight of H2CN:4.031600 u'
'molecular weight of HCN:3.023700 u'
'molecular weight of HNO:3.023700 u'
'molecular weight of N:14.006730 u'
'molecular weight of NNH:42.020190 u'
'molecular weight of N2O:42.020190 u'
'molecular weight of NH:28.013460 u'
'molecular weight of NH2:42.020190 u'
'molecular weight of NH3:42.020190 u'
'molecular weight of NO:28.013460 u'
'molecular weight of NO2:42.020190 u'
'molecular weight of HCNO:4.031600 u'
'molecular weight of HOCN:4.031600 u'
'molecular weight of HNCO:4.031600 u'
'molecular weight of NCO:42.020190 u'
'molecular weight of CN:24.021400 u'
'molecular weight of HCNN:4.031600 u'
'molecular weight of N2:28.013460 u'
'molecular weight of AR:79.896000 u'
'molecular weight of C3H8:48.042800 u'
'molecular weight of C3H7:48.042800 u'
'molecular weight of CH2CHO:72.064200 u'
Plots of some species:
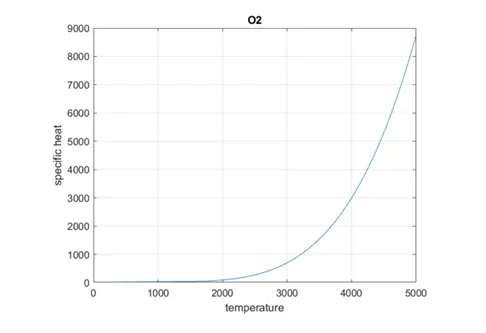
Plot of Species O2(specific heat vs temperature)
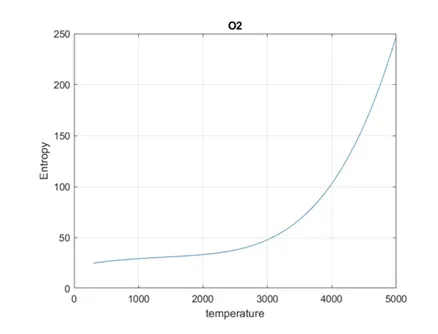
Plot of Species O2( entropy vs temperature)
Plot of Species O2(enthalpy vs temperature)
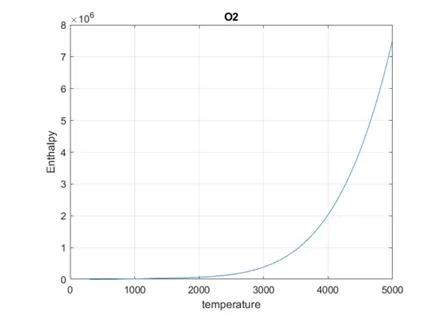
Plot of Species N2(specific heat vs temperature)
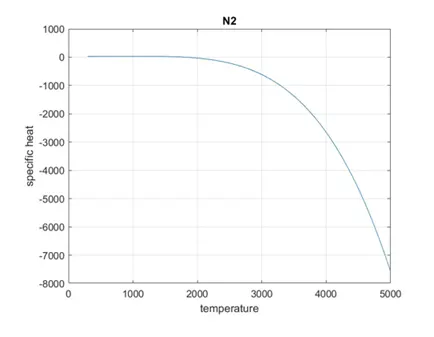
Plot of Species N2(entropy vs temperature)
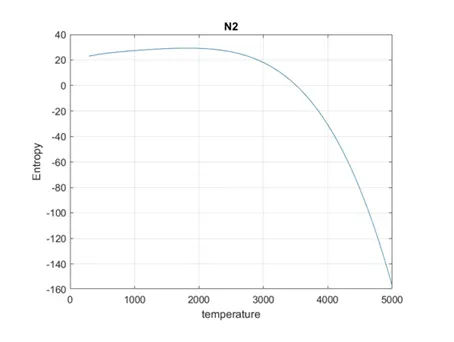
Plot of Species N2(enthalpy vs temperature)
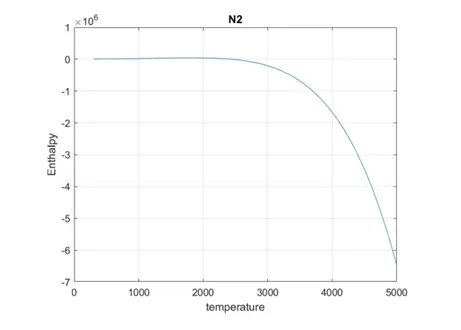
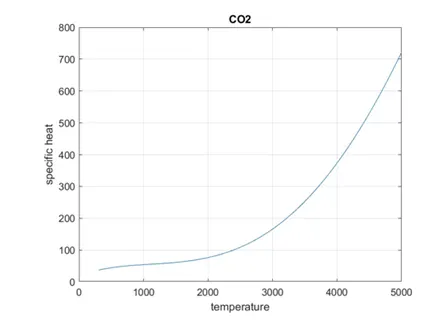
Plot of Species CO2 (specific heat vs temperature)
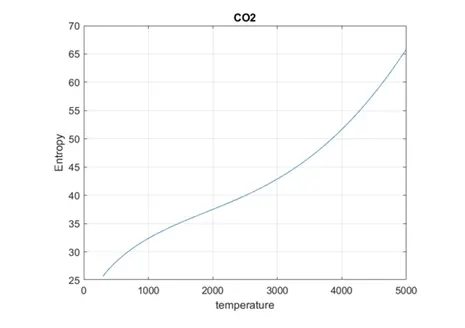
Plot of Species CO2 (entropy vs temperature)
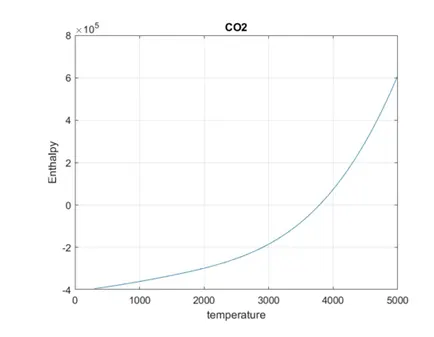
Plot of Species CO2 (enthalpy vs temperature)
Graph file of all species:


Conclusion:
Finally we got the graphs of all species and find out the molecular weight of the same by using matlab.