Week 2- 2R Robotic Arm Challenge
A program in Matlab to simulate the forward kinematics of a 2R Robotic Arm
let us suppose a robotic arm consist of two link and arm. Our aim is find all possible position that the arm can move with repect to the links movement. let us suppose links are connected via pin joint and link 1 connected with base. theta 1 be the angle between base and the link 1. theta 2 be the angle between the link 1 and link 2. arm is fixed on link 2.
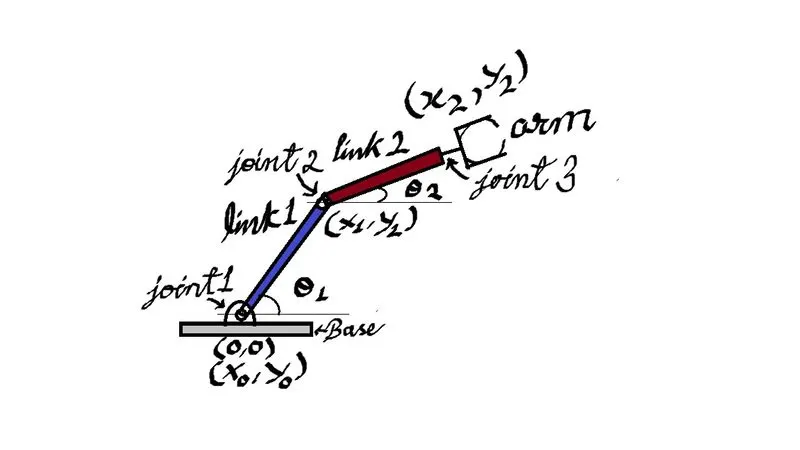
- let the length of link 1 = l1 = 3 m and link 2 = l2 = 1.5 m
let inclination of link 1 and link 2 are theta_1 and theta_2 respectively
%input
l1 = 2;
l2 = 1;
- theta represented by 'th' . we are providing multiple values of theta by using 'linspace' command linspace(0,90,10) represents (initial value,final value,interval)
th_1 = linspace(0,90,10);
th_2 = linspace(0,90,10);
- counter command = 'ct' is a variable that simply increments (or decrements) by a specific 'step' value in every iteration of a loop.
ct = 1; - for loop command is used for repeated operation. i = statement = starting:ending. in our case we are creating loop inside loop so that we can get the position of both link with respect to the values of each angles we have inputed
- first loop is for each position of link 1 with respect to the value of th_1
for i = 1 : length(th_1)
TH_1 = th_1(i);
- second loop is for each position of link 2 with respect to the value of th_2
for j = 1 : length(th_2)
TH_2 = th_2(j); - it represent the position of joint 1 which connect link 1 with base at (0,0)
x0 = 0;
y0 = 0; - it reoresent the position of joint 2 which connect link 1 with link 2
x1 = l1*cosd(TH_1);
y1 = l1*sind(TH_1);
- it reoresent the position of joint 3 which connect link 2 with arm
x2 = x1 + l2*cosd(TH_2);
y2 = y1 + l2*sind(TH_2); - plotting the position of links with respect values of input angle
plot([x0 x1],[y0 y1],[x1 x2],[y1 y2],'linewidth',3);
axis([-1 4 -1 4]) - it represent timelapse with respect to the frame pause(0.03)
N(ct) = getframe(gcf);
ct = ct+1;
xlabel('x axis')
ylabel('y axis')
grid on
end
end - this command is used to convert number of frames into video files named "video file 1'
movie(N)
videofile = VideoWriter('video file 1','Uncompressed AVI');
open(videofile)
writeVideo(videofile,N)
close(videofile)
% A program in Matlab to simulate the forward kinematics of a 2R Robotic Arm
%let the length of link 1 = l1 = 3 m and link 2 = l2 = 1.5 m
%let inclination of link 1 and link 2 are theta_1 and theta_2 respectively

%input
l1 = 2;
l2 = 1;

% theta represented by 'th'
% we are providing multiple values of theta by using 'linspace' command
%linspace(0,90,10) represents (initial value,final value,interval)
th_1 = linspace(0,90,10);
th_2 = linspace(0,90,10);

% counter command = 'ct' is a variable that simply increments (or decrements) by a specific 'step' value in every iteration of a loop.
ct = 1;

% for loop command is used for repeated operation.
% i = statement = starting:ending
% in our case we are creating loop inside loop so that we can get the
% position of both link with respect to the values of each angles we have
% inputed

%first loop is for each position of link 1 with respect to the value of th_1

for i = 1 : length(th_1)
   TH_1 = th_1(i);

   %second loop is for each position of link 2 with respect to the value of
   %th_2
    for j = 1 : length(th_2)
        TH_2 = th_2(j);

        % it represent the position of joint 1 which connect link 1 with base at (0,0)
        x0 = 0;
        y0 = 0;

        % it reoresent the position of joint 2 which connect link 1 with
        % link 2

        x1 = l1*cosd(TH_1);
        y1 = l1*sind(TH_1);

        %it reoresent the position of joint 3 which connect link 2 with arm

        x2 = x1 + l2*cosd(TH_2);
        y2 = y1 + l2*sind(TH_2);

        %plotting the position of links with respect values of input angle
         plot([x0 x1],[y0 y1],[x1 x2],[y1 y2],'linewidth',3);
         axis([-1 4 -1 4])

         %it represent timelapse with respect to the frame
         pause(0.03)
          N(ct) = getframe(gcf);
           ct = ct+1;
         xlabel('x axis')
         ylabel('y axis')
         grid on
    end
end

%this command is used to convert number of frames into video files named
%"video file 1'
 movie(N)
 videofile = VideoWriter('video file 1','Uncompressed AVI');
  open(videofile)
 writeVideo(videofile,N)
 close(videofile)
Video link
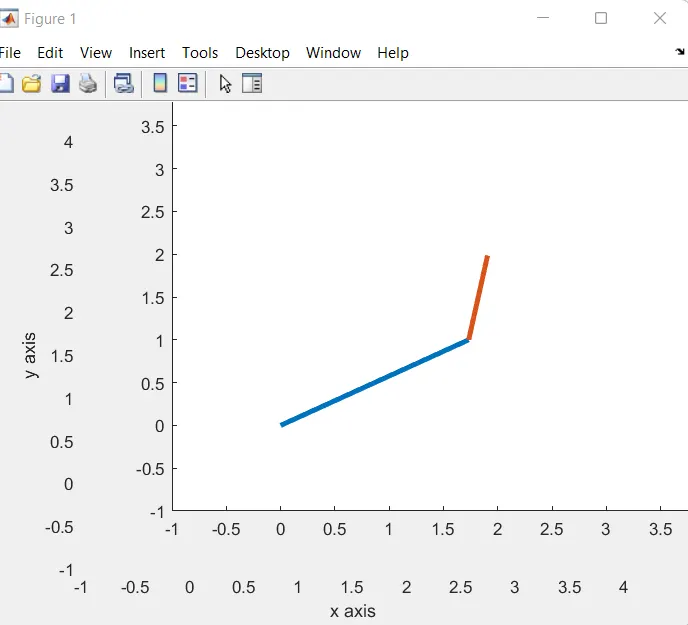
Error faced while writting codes
1. while converting frames into animation code, initially i used initials 'M(ct)' but when i hit run key, it doesn't work, error bar shows 'M' overwritten. then i replaced 'M' with 'N'.
2. i Mistakenly put 'ct = ct+1;' above ploting commands, it showed illogical graphs.
3. while initial coding after providing intial inputs, i have coded following
th_1 = linspace(0,90,10)
th_2 = linspace(0,90,10)
figure(ct);
line([x_0 x_1],[y_0 y_1], 'linewidth',3,'color','b');
line([x_1 x_2],[y_1 y_2], 'linewidth',3,'color','m');
ct = ct + 1;
that had hanged my laptop for an hour and i have to force to restart it. this happens because 'th_1 = linspace(0,90,10)' and 'th_2 = linspace(0,90,10)' together created 100 plots.