Week -2
1. The first experiment is to Make a Simulink model of Doorbell using solenoid block.
Objective:
Here we are going to see the operation of the Electromagnetic door bell.
Blocks used:
- Voltage souce : which provided the potential difference to the circuit and engages the circuit. (50V is given as a parameter)
- Switch : which is used to open and close the circuit depending on the physical signal provided to it. [The closed resistance is 0.01Ohm and open conductane G is 1e-8]
- Pulse generator: This produces the pulse as per the given parameters (4 sec period with 50% duty cycle)
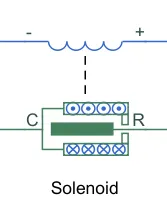
- Solenoid: this converts the electrical energy to the mechanical movement. (Here it moves the metal part, which is supposed to be hitting the bell structure when kept in the proximity.) (50 Vdc and 0.05 Idc is the trigerring point in electrical part with 7.5 to 1 of pull in forces [F1 F2])
- Electrical Reference: this is used to provide the Electrical reference to the Electrical part of the circuit.
- Mechanical Translational reference: this is to provide the mechanical reference point to the mechanical part of the model.
- Scope : used to display the output of the ideal force sensor.
- Ideal Force Sensor: This is to measure the force exerted in the R to C port of the model [which is the positive direction].
- PS-Simulink Converter: this is used to convert the physical signal [force signal from force sensor] to simulink output signal [scope].
- Simulink-PS Converter: This is used to convert the simulink input signal [pulse signal] to physical signal.
- Solver Configuration: This configures the parameters that the model needs for simulation.
- Current Sensor : This measures the current in the circuit.
Model:
Here you can see the connection between the various blocks which is expalined earlier.
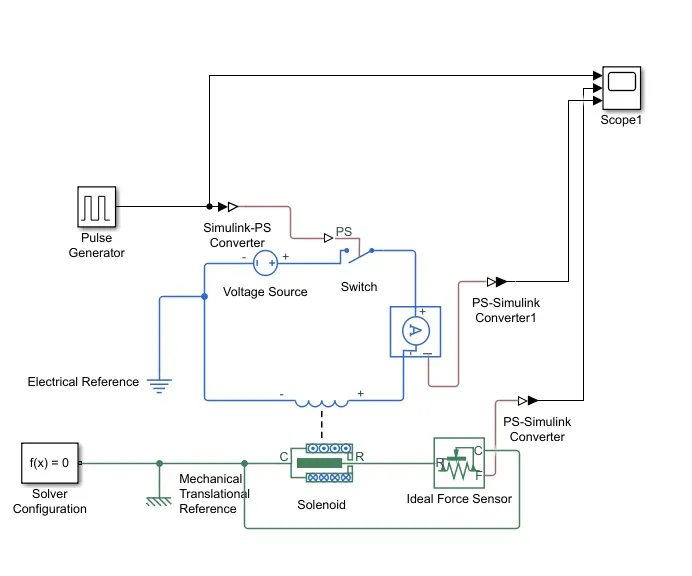
In the model we can observe that there are two physical circuits one is electrical and another is mechanical.
The electrical is denoted by the blue colour and the green specifies the mechanical components.
We can also see the solenoid where the dot and cross notation are used to denote the current flow in the coil around the core.
The solenoid has the motion direction under excitaiton where port R moves away from port C.
The ideal force sensor gives a positive value when the direction of motion is form port R to port C.
Observation:
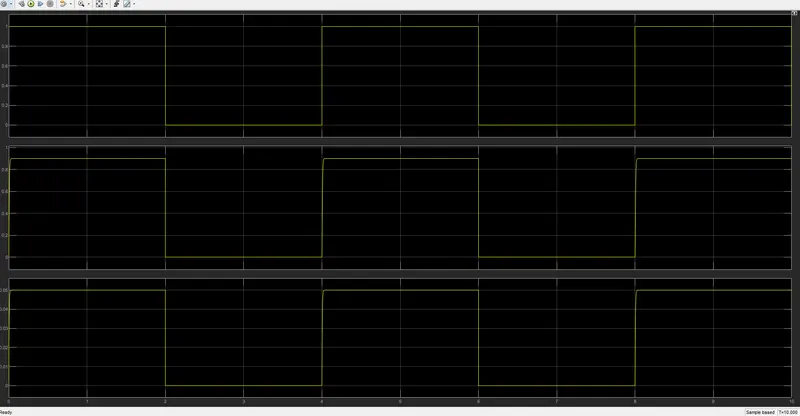
The pulse generator has a 50% duty cycle of 4 second period which specifies the 2 sec on time and 2 sec off time.
This signal is given to the converter which converts to physical signal that triggers the switch position.
ON State:
The pulse form the pulse generator [0-2 sec] if converted to the PS signal the switch is in ON state the voltage source excites the coil of the solenoid, and the current is measured as 0.05A.
which inturn displaces the solenoid, that causes the force sensor to measure the force exerted [0.9N].
That is then converted and displayed in the scope.
OFF State:
When the pulse is on the second half [2-4 sec] of the duty cycle the switch is in off state, this makes the coil de-energize with the current of 0A.
Making the Solenoid to be in the intial state, thus no force will be exerted in the force sensor.
Note:
- First Graph shows the Pulse generator output.
- Second shows the Ideal Force sensor output.
- Third shows the current in the circuit.
Result:
By simulation the above experiment we can have an idea of the operation of Door bell along with the movement of the plunger and the excitations in the electrical circuits.
2.The second experiment is to Use a thermistor to sense the temperature of a heater & turn on or turn off the fan.
Objective:
In this we are going to see the operation of the thermistor which is to sense the temperature and with the corresponding values we would like to have an application of operating a fan.
Blocks used:
- Signal Builder: This generates the custom signals for the simulation, in our case temperature is given in kelvin format.
- Controlled temperature source: this block is a temperature source which can be controlled using the external signal (S port). The positive temperature difference is caused when temperature at port B is greater than port A.
- Solver Configuration: This configures the parameters that the model needs for simulation.
- PS-Simulink Converter: this is used to convert the physical signal to simulink output signal [scope].
- Simulink-PS Converter: This is used to convert the simulink input signal [pulse signal] to physical signal.
- Thermistor: This block is NTC Thermistor (Negative Temperature Coefficient), i.e resistance decreases with increase in temperature.
- Battery: This is used to provide the voltage to the electrical circuit.
- Resistor: This is the usual resistor block which restricts the flow of current.
- Voltage sensor: This is a typical voltage measurement.
- Constant Block: this provides the constant value.
- Switch:It has 3 inputs and one output, where one input is used for threshold so that the switch can toggle between the other inputs when the threshold is reached.
- Scope: This gives a visual graphical representation of the output values.
- Thermal reference is used to provide reference temperaure which is absolute zero.
- Electrical Reference is used to provide electrical ground.
Model:
Here you can see the connections between the models.
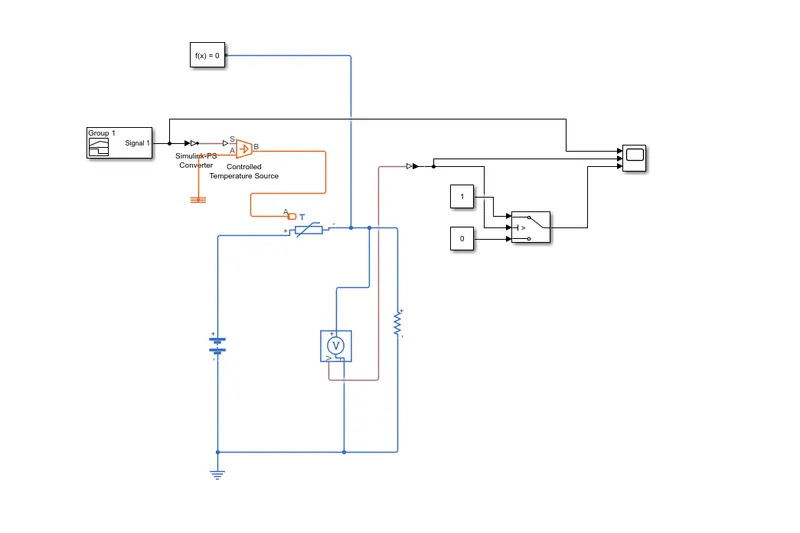
In the model we can observe that there is two colours, the orange colour indicates the thermal circuit and the blue indicates electrical circuit. The signal builder is used to generate the desired signal and fed to the controlled temperature source which gives the temperature variations according to the thermistor.
The thermistor is of NTC type thus the resistance reduces as the temperature increases, in this case when the temperature is 27 we get the least resistance from the thermistor, thus observed from the graph.
The switch is given a threshold at 25 degree which is the objective of this experiment as to switch the fan.
Observation:
The input signals for this experiment is provided by the signal builder which we have configured in a way that the required conditions are done.
Which is then fed to the temperature source which gives the variation in the temperature to the thermistor. This thermistor will change its resistance in accordance to the temperature it receives. Thereby changing the resistance of the circuit. The load resistor is connected in series to the thermistor and its voltage drop is measured in the voltage sensor.
This change in the threshold value for 25 degree temperature is noted and this threshold value is used for the switch for the switching above 25 degree of temperature.
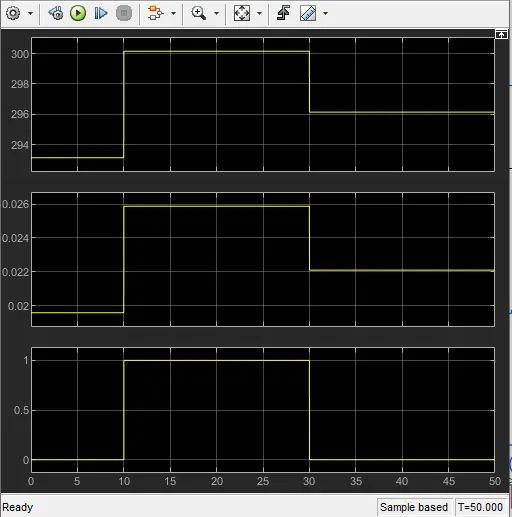
From the graph we could see
- The first graph shows the signal builders values which is converted to kelvin [for 20,27,23 degree of temperature].
- The second graph shows the voltage drop across the 1 ohm resistor.
- The third graph shows the switching of the switch.
Result:
From this simulation we can see that this model replicates the temperature controlled switching which extends its application to cooling certain environments.