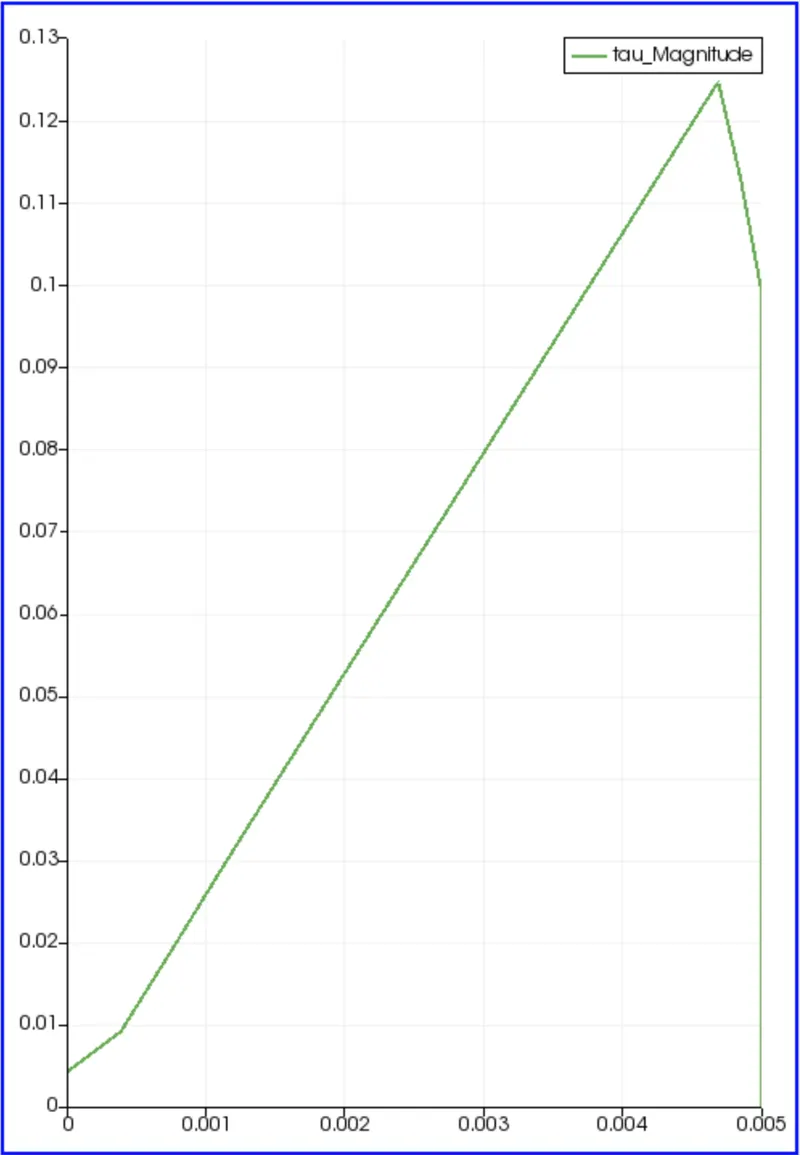
Week 12 - Validation studies of Symmetry BC vs Wedge BC in OpenFOAM vs Analytical H.P equation
Aim: To simulate wedge flow using OPENFOAM for different angles of wedge and to capture the results that are obtained from the given angles for flow.
Simulation Flow Through a Pipe in OPENFOAM:
Objective: 1. The main objective of the project is to simulate the flow through the pipe in OPENFOAM software.
Procedural Steps: 1. Write the program for generation of the blockMeshDict file or computational mesh for wedge angle and grading scheme.
2. Calculate the length of the pipe using the entry length formula of laminar flow through the pipe.
3. Show that the entry length is enough for producing the fully developed flow.
4. Compare the velocity profile at different lengths of the pipe.
5. Show that the velocity profile is fully developed.
6. Post-process velocity and shear stress.
Assumptions: 1. Flow is 2-dimensional.
2. Flow is steady, laminar and incompressible.
3. Fluid properties are constant at all points.
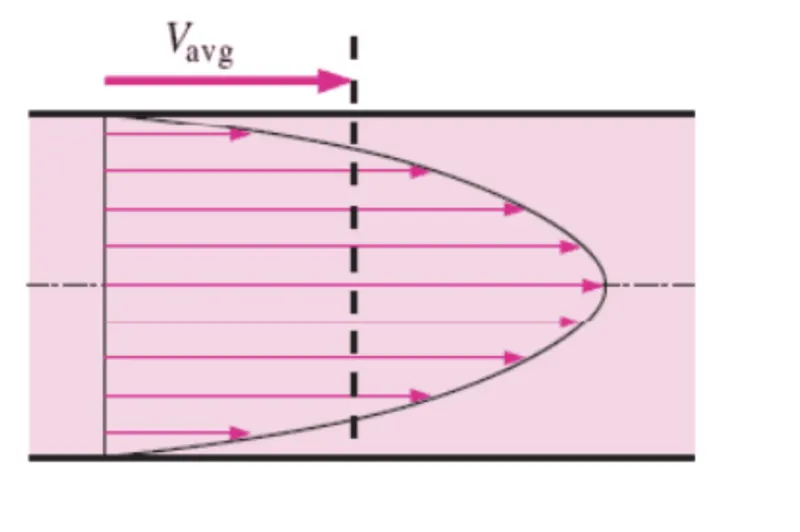
Laminar Flow Through a Pipe: In this project, we strive to simulate a section of a pipe(wedge shaped geometry) to understand various aspects of flow through the pipe. The fluid chosen is water and flow is laminar and incompressible. Furthermore, we neglect any cross-sectional changes. The considered Reynold's number is `R_e=2100`. Internal flow occurs when the fluid is filled entirely in a conduit and is driven mainly by pressure difference. Fluid velocity in the pipe changes from zero at the surface because of the no-slip boundary condition to a maximum at pipe's centre. The average velocity remains constant in incompressible flow when cross-section of pipe is constant.
Reynold's Number: Denoted by `R_e`. The transition from laminar flow to turbulent flow occurs from laminar to turbulent for smooth pipe with no viscous dissipation. It depends on the geometry, surface temperature, flow velocity, face roughness, etc. Reynold's no. is an important dimensionless number which is the ratio of the inertial force to the viscous force and is expressed for internal flow in a circular section of a pipe as:
`R_e=(V_(avg)D)/v=(rhoV_(avg)D)/mu`-------->(1)
In this case, we're taking `R_e`as 2100.
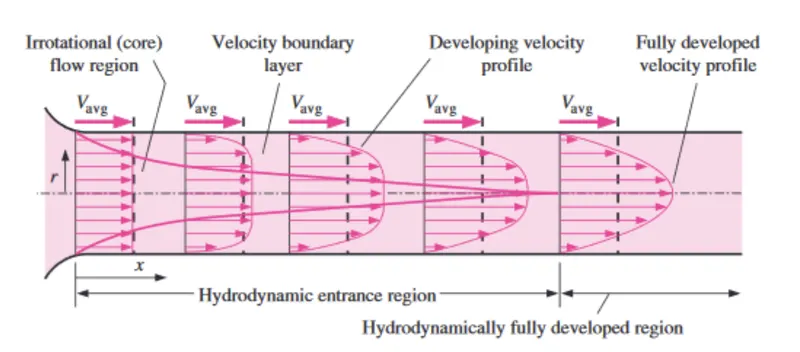
Hydrodynamic Length: Denoted by `L_e`. The region from the pipe inlet to the point at which the velocity boundary layer merges at the centreline is called the hydrodynamic entrance region in which the velocity profile is fully developed is called the "Fully Developed Region". Here, we take `L_e`as 12.6 meters and round it off to 15 as it is the nearest value.
Diameter of Pipe: We can assume the diameter of the pipe to be 10mm or 0.001 meter.
Calculation of Average Velocity: To calculate the velocity of the fluid i.e. average velocity at the inlet pipe, we have the following given data that we need to use in the formula:
1. Reynold's no. or `R_e`=2100.
2. D(density) of the liquid at 25 degrees celsius=0.01
Substituting the given data in eqn. (1), we get:
`V_(avg)=(2100*(8.9*10^-7))/(0.01)`which gives 0.1869 m/s as the result.
Calculation of Pressure Drop:
According to Hagen-Poiseuilles Equation:
Pressure Drop, `triangleP=(32.mu.LV)/(D^2)`
`triangleP=(32.(8.4*10^-4)*1.5*0.1869)/(0.01^2)=0.0789m/s`
Calculation of Maximum Velocity: To calculate the maximum velocity, we have the following formula:
`V_( max)=2.V_(avg)=0.3738m/s`
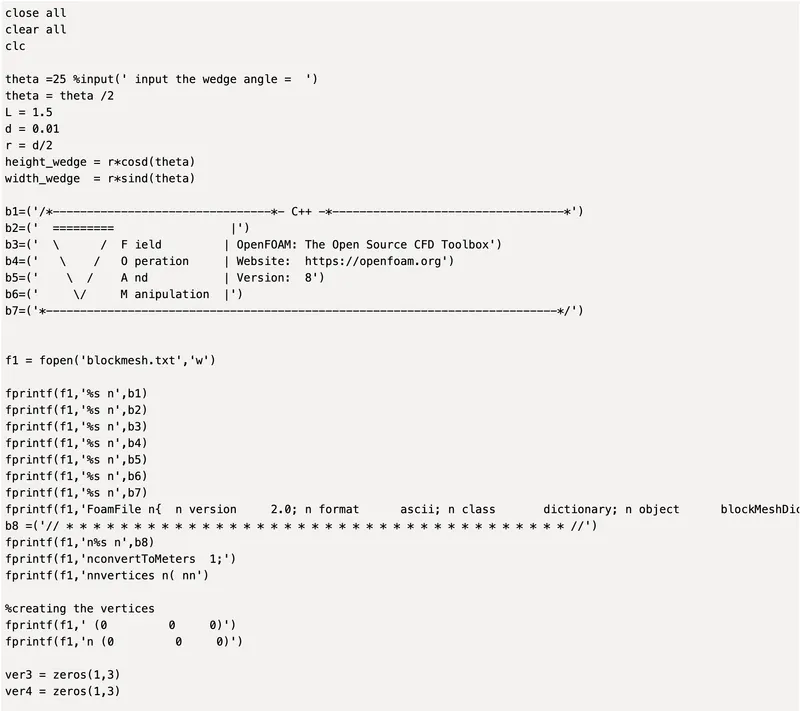
Main MATLAB Code that Creates blockMeshDict File:
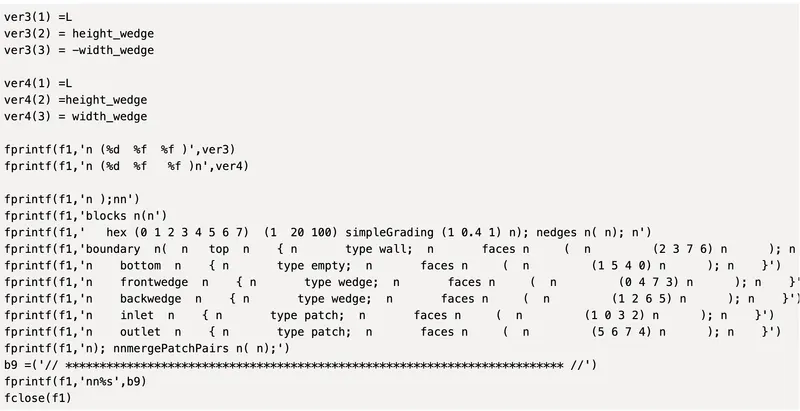
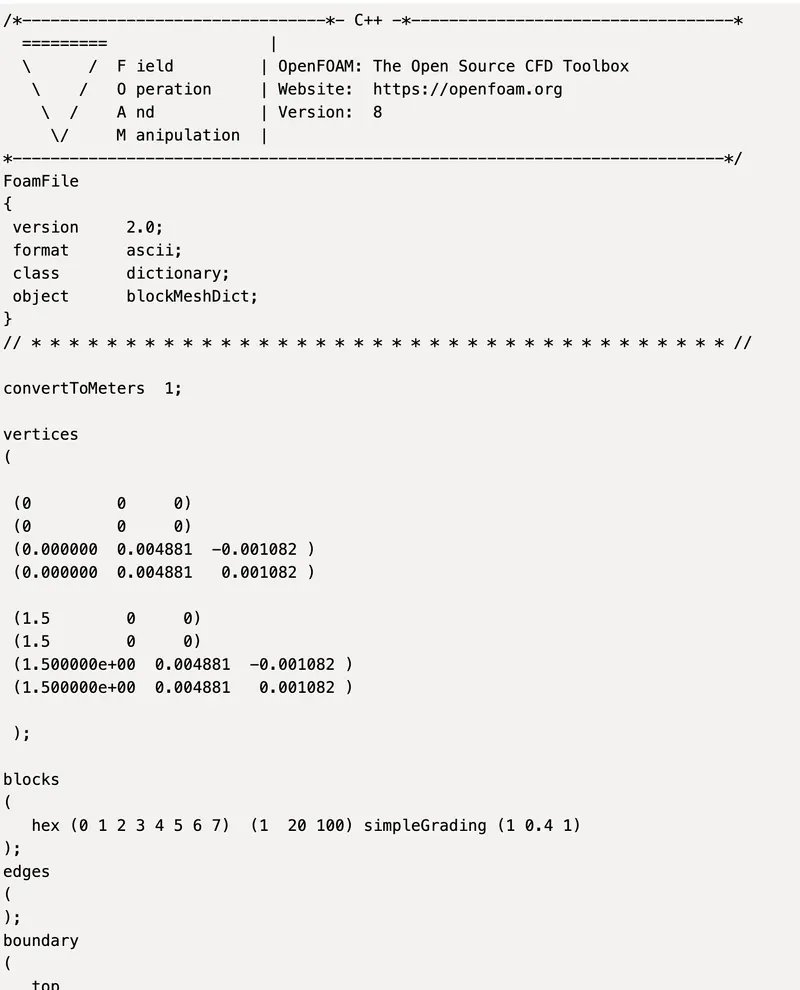
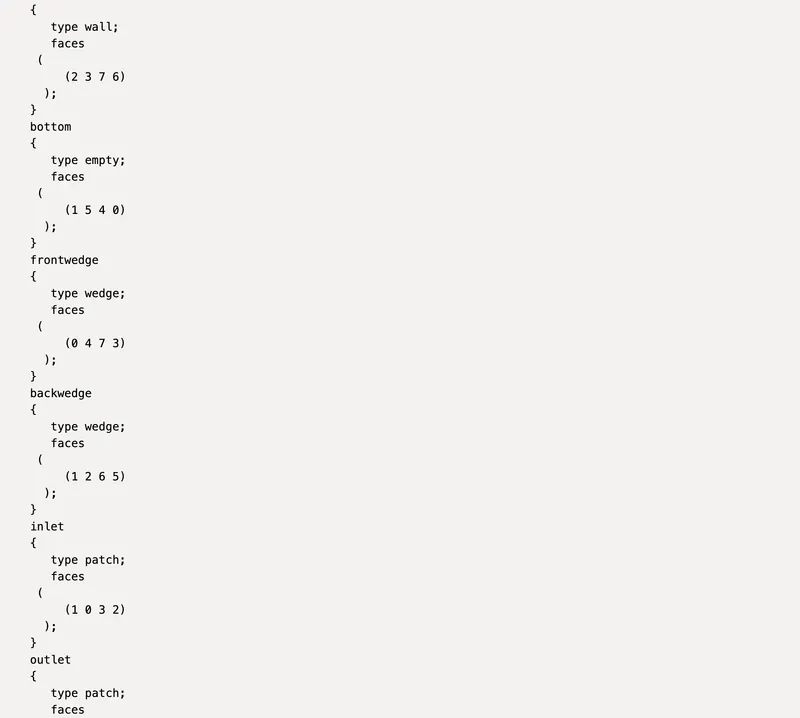
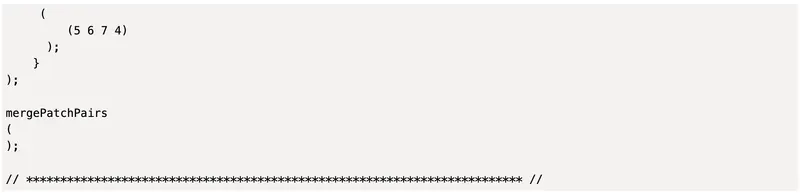
blockMeshDict file that creates wedge of angle 10:
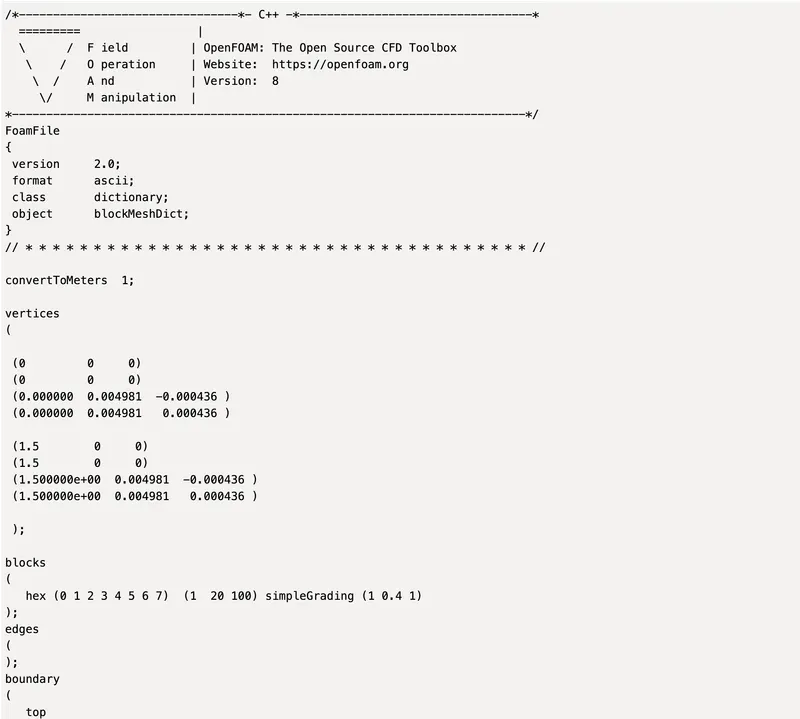
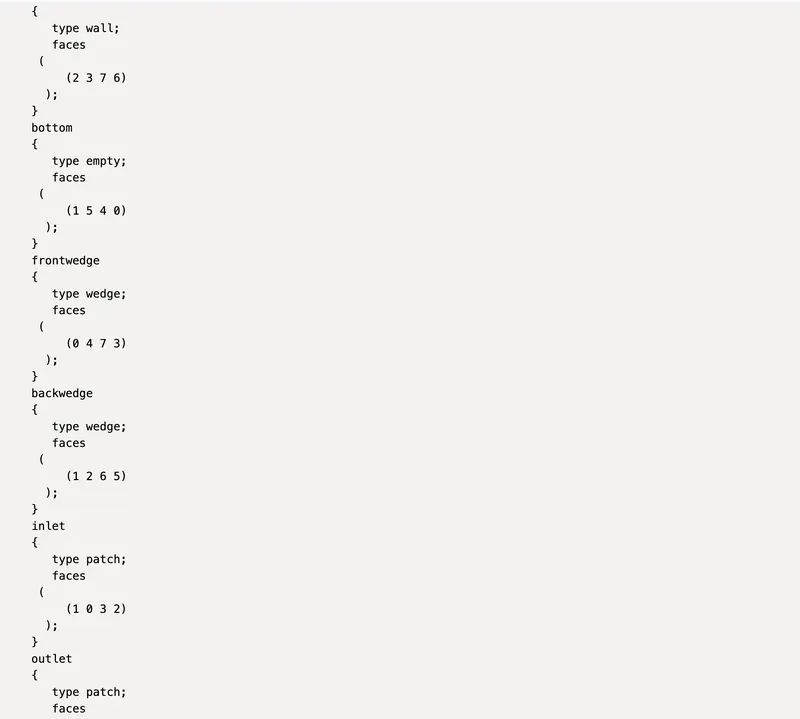
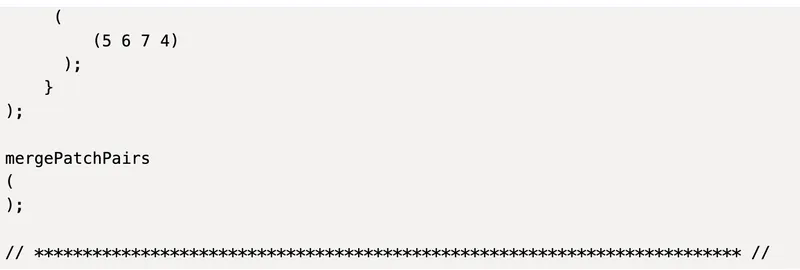
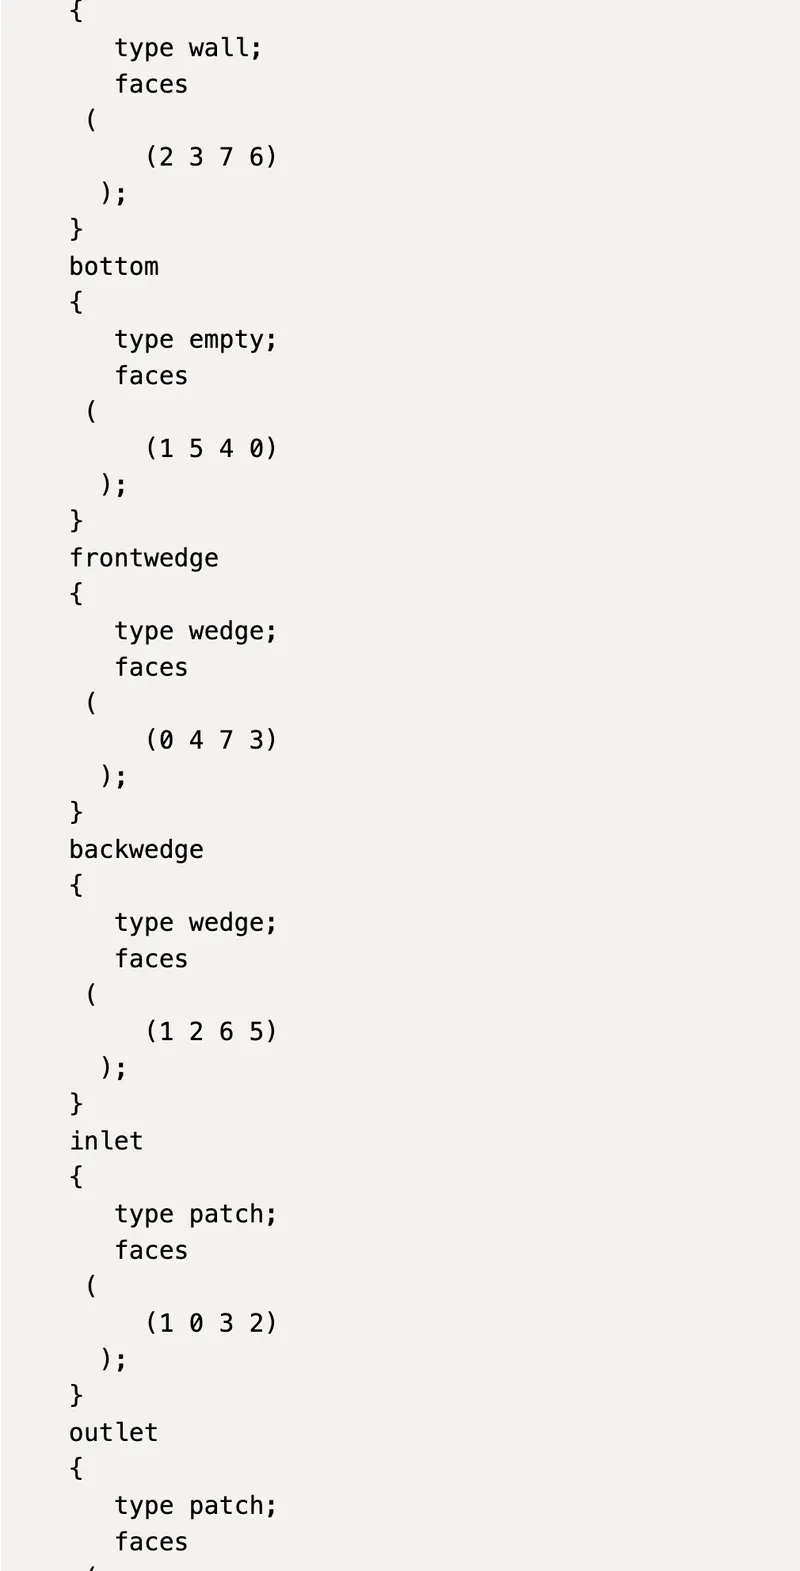
blockMeshDict file that creates wedge of angle 25:
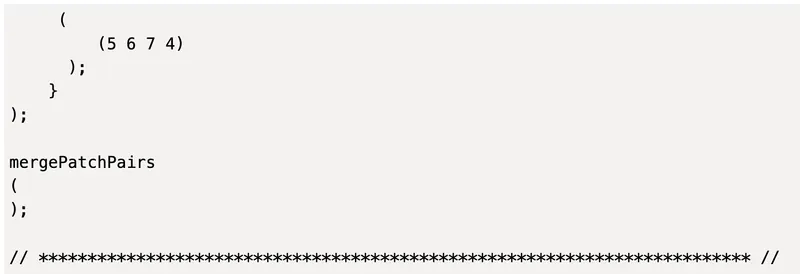
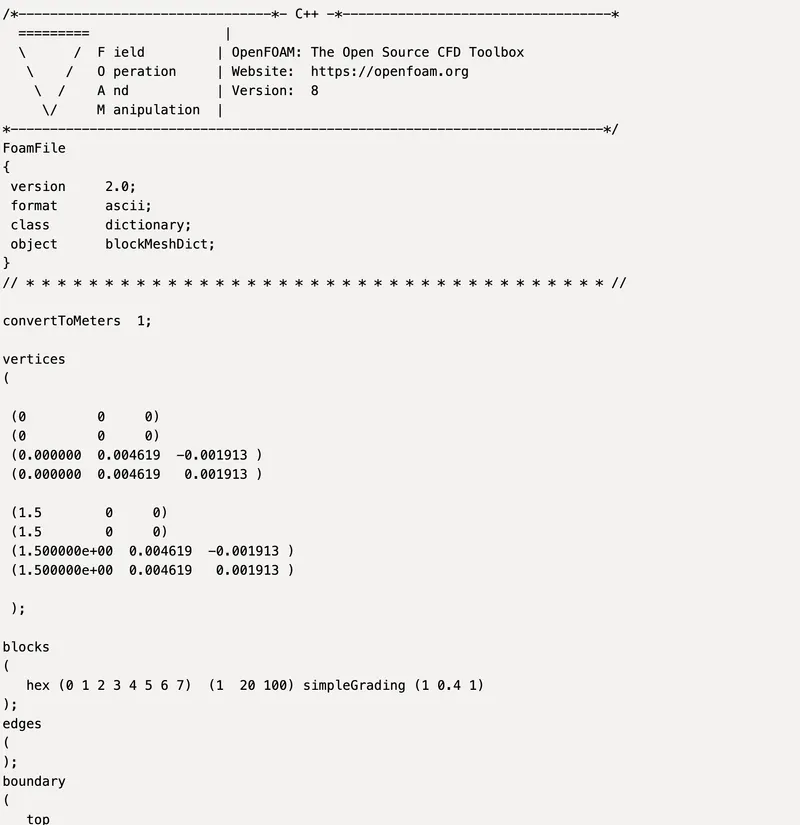
blockMeshDict file that creates wedge of angle 45:
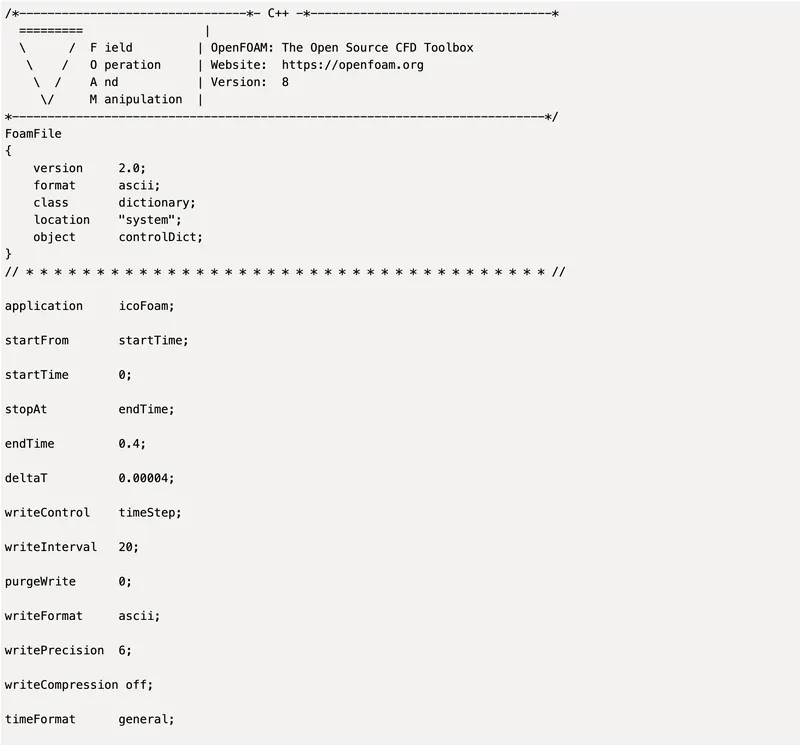
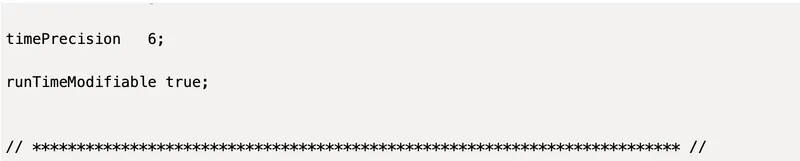
controlDict file:
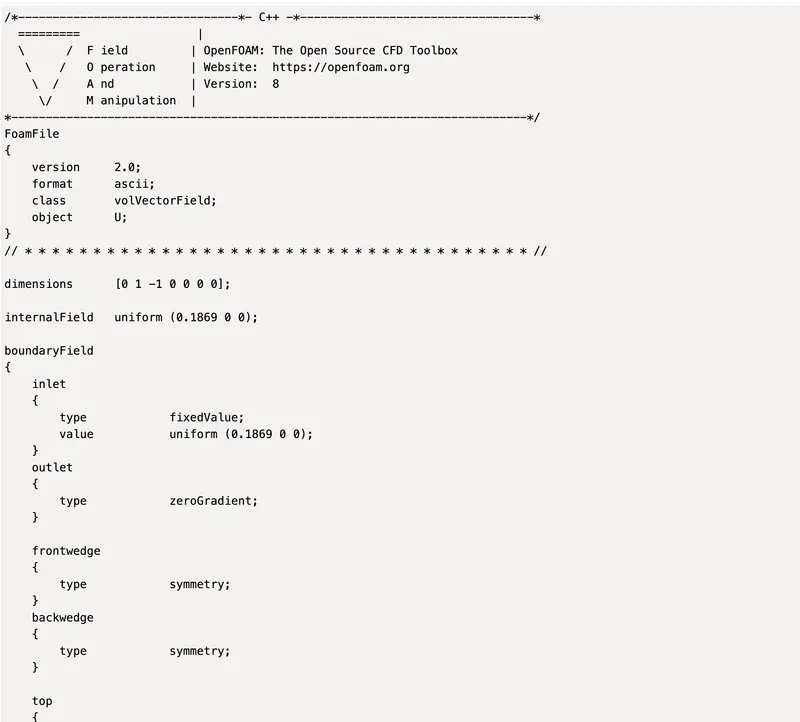
velocity file:

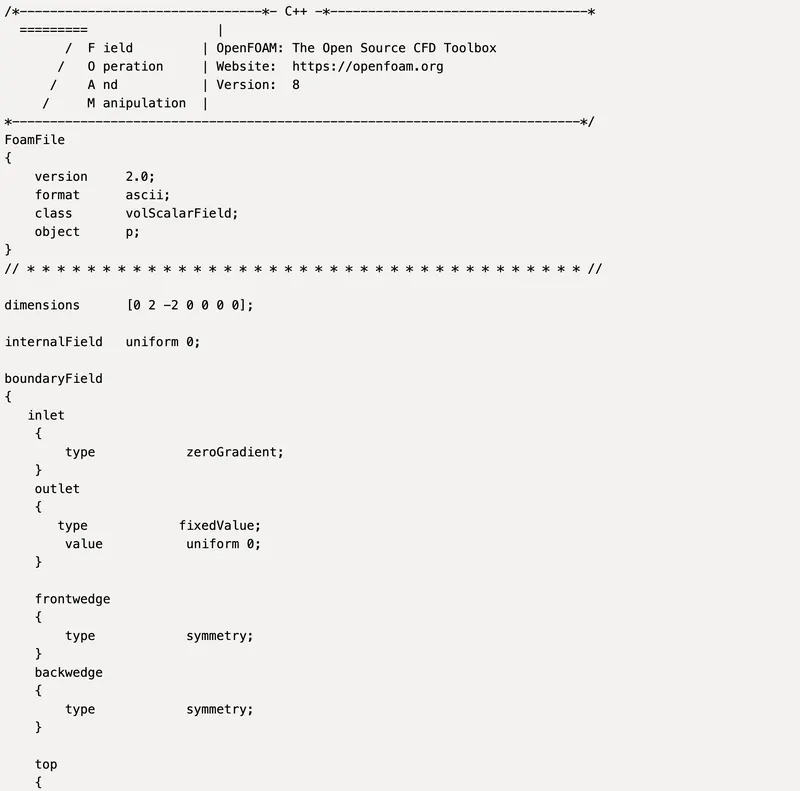
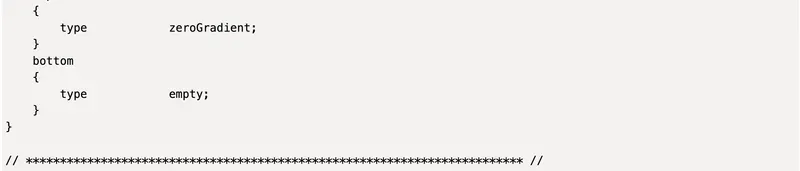
pressure file:
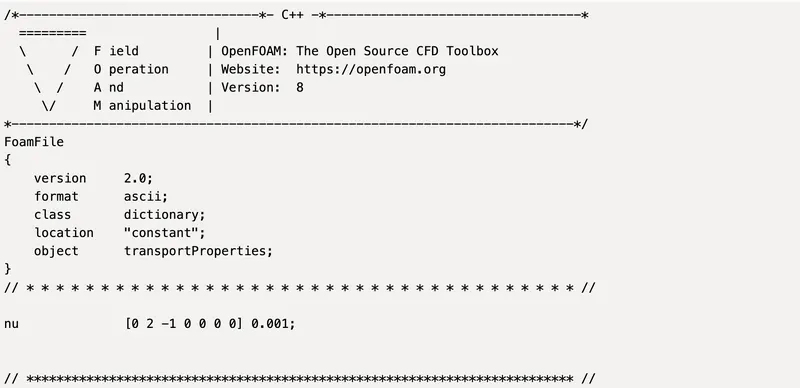
transportProperties file:
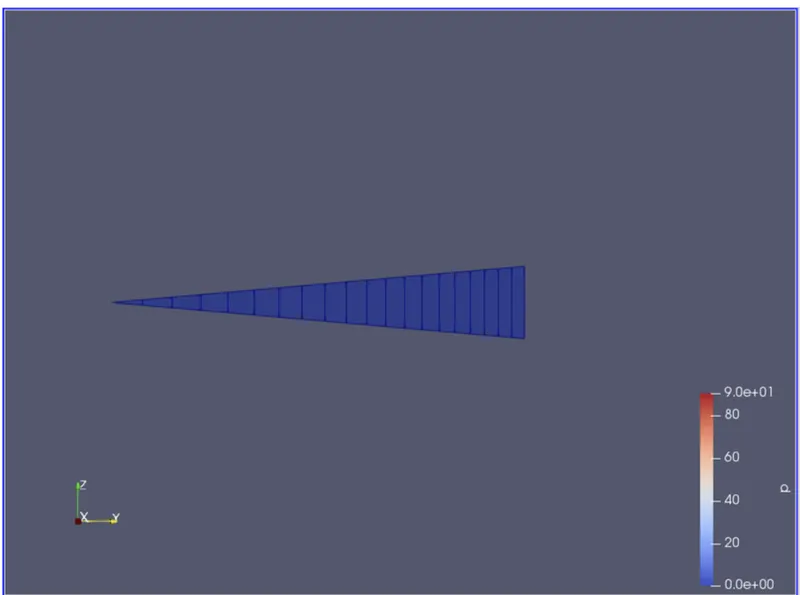
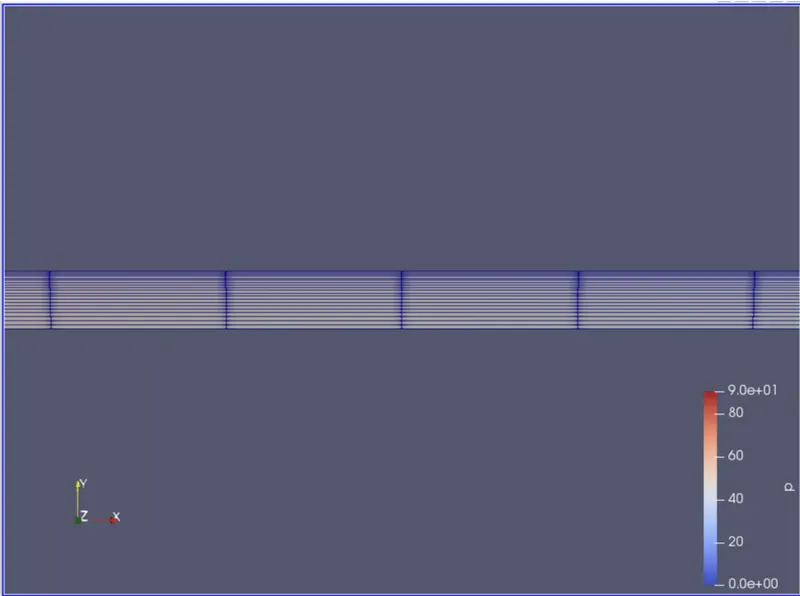
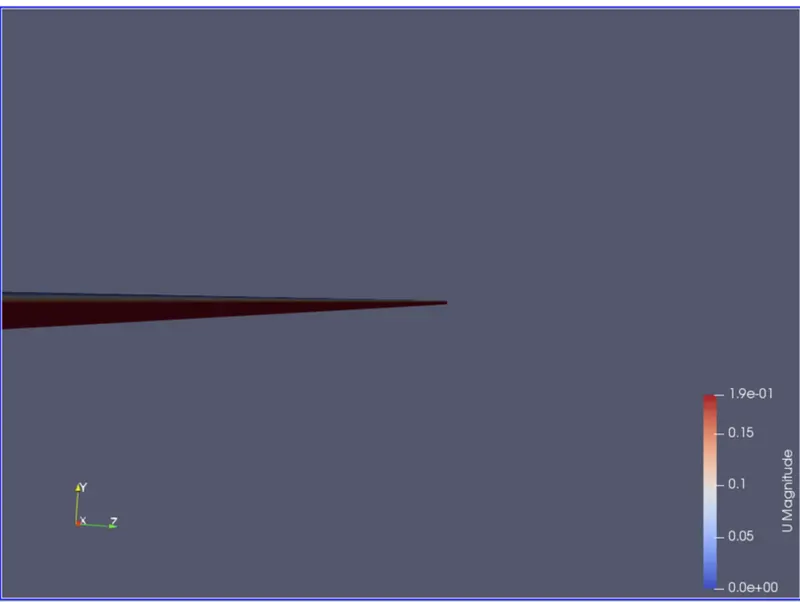
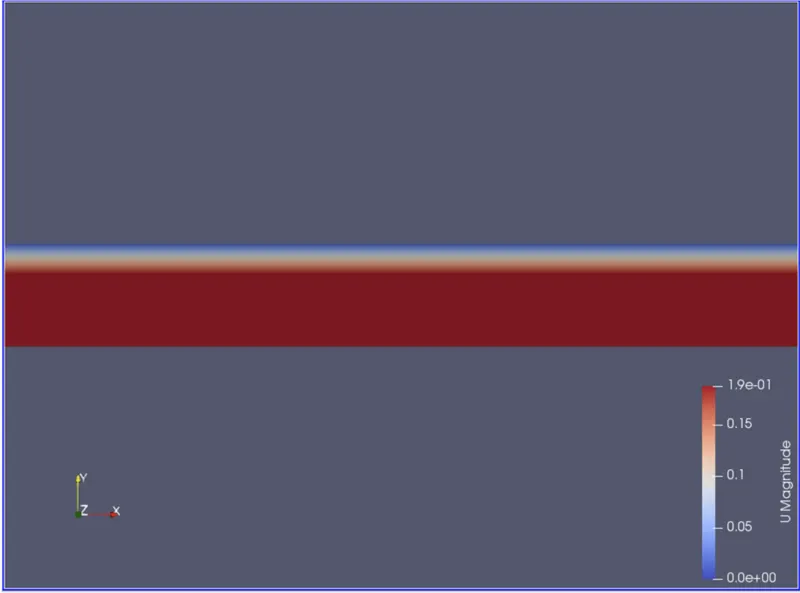
Results for Wedge Angle of 10 Deg:
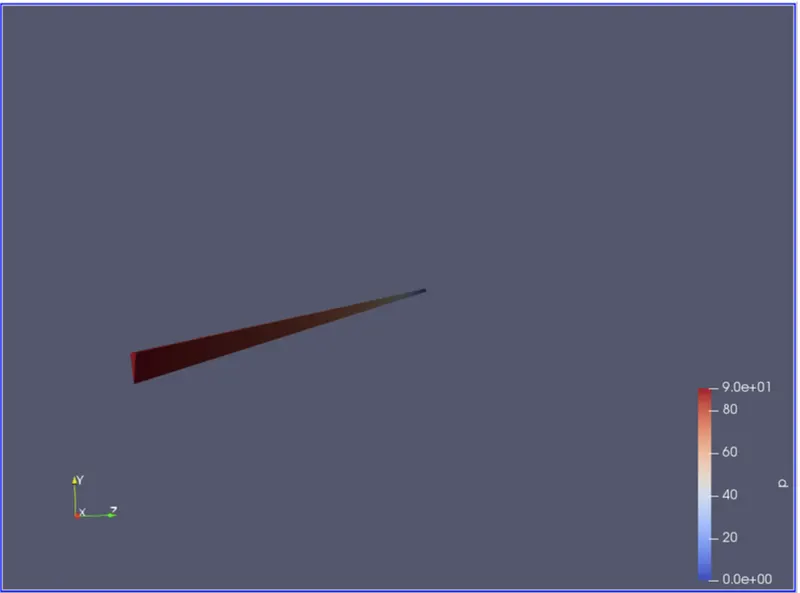
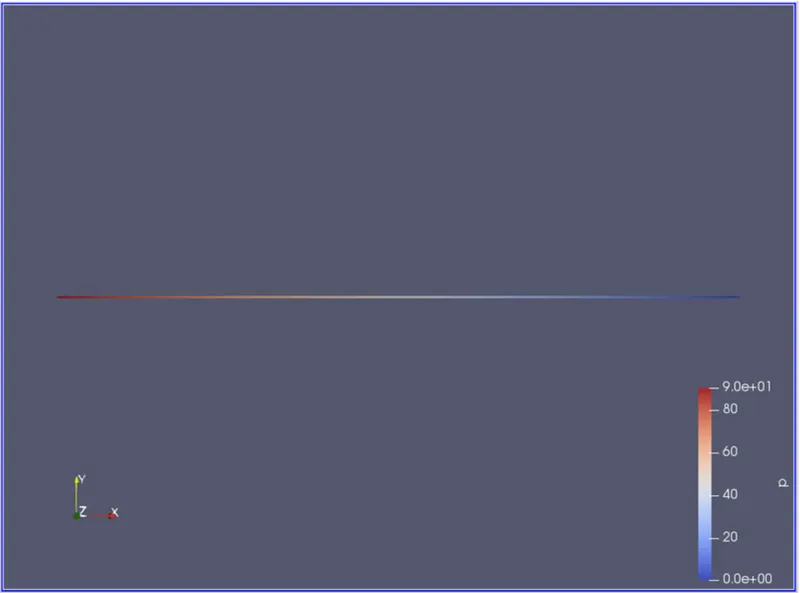
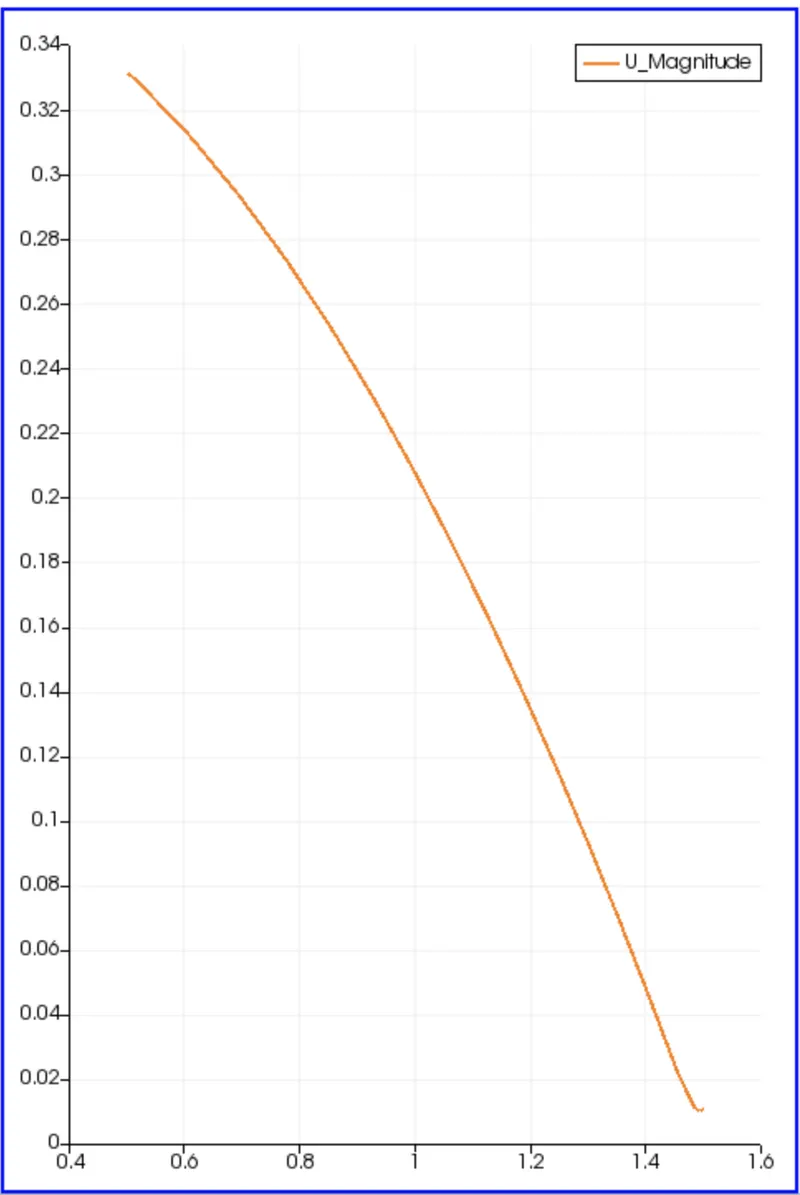
Velocity Plot Along Length Less Than Hydrodynamic Length:
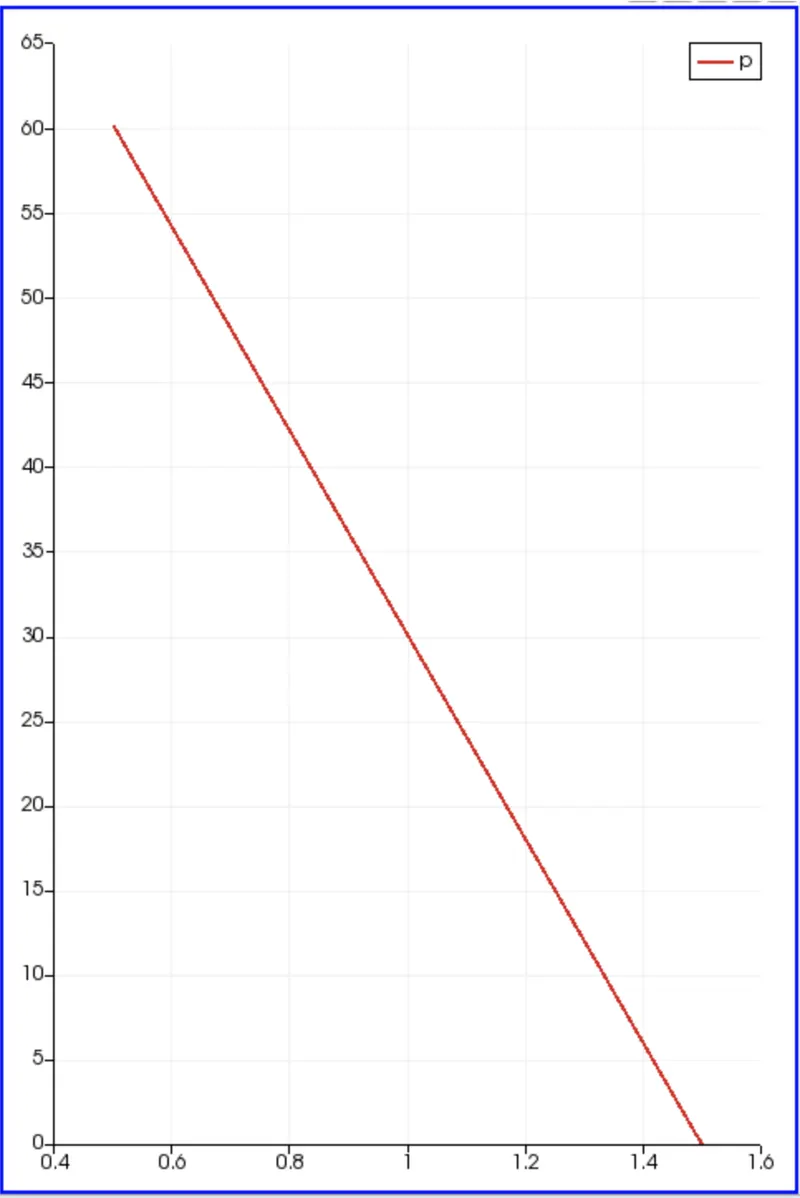
Pressure Plot Along X-Axis for Wedge Angle 10 Deg:
Velocity Plot for Fully Developed Flow for Wedge Angle 10 Deg:
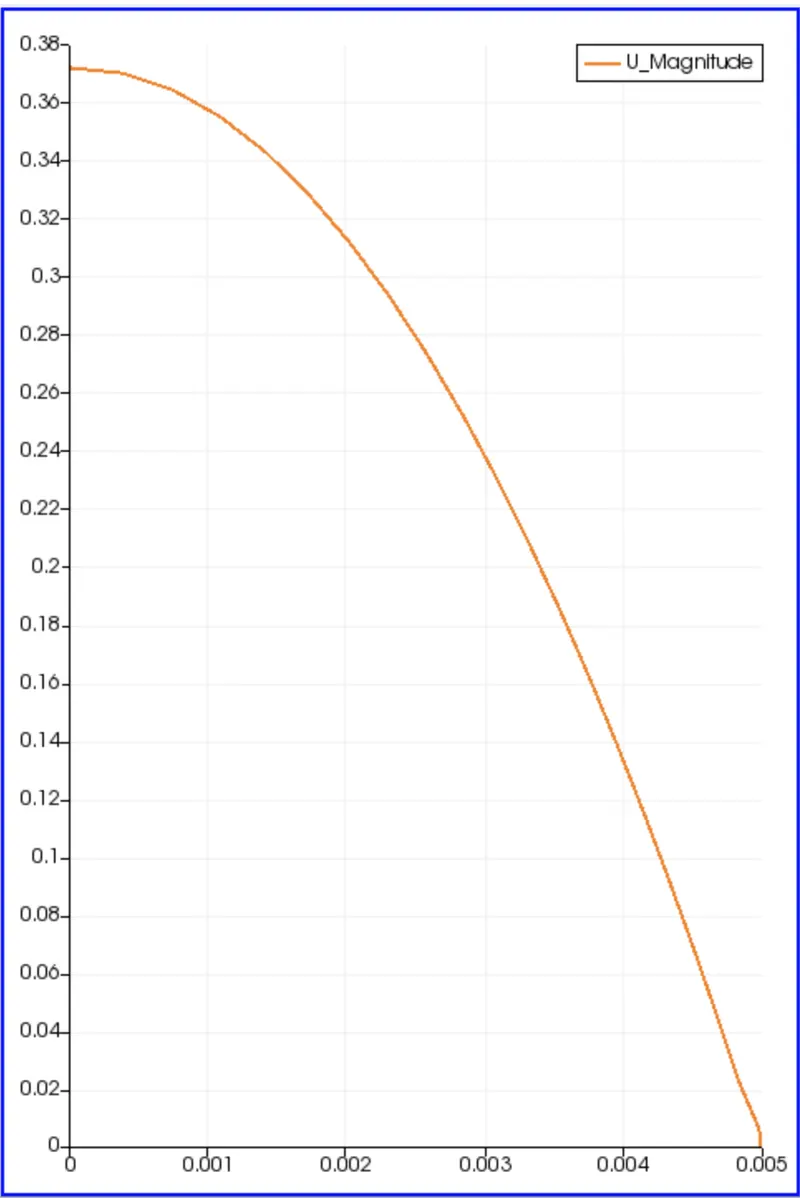
Shear Stress Plot Along Y-axis:
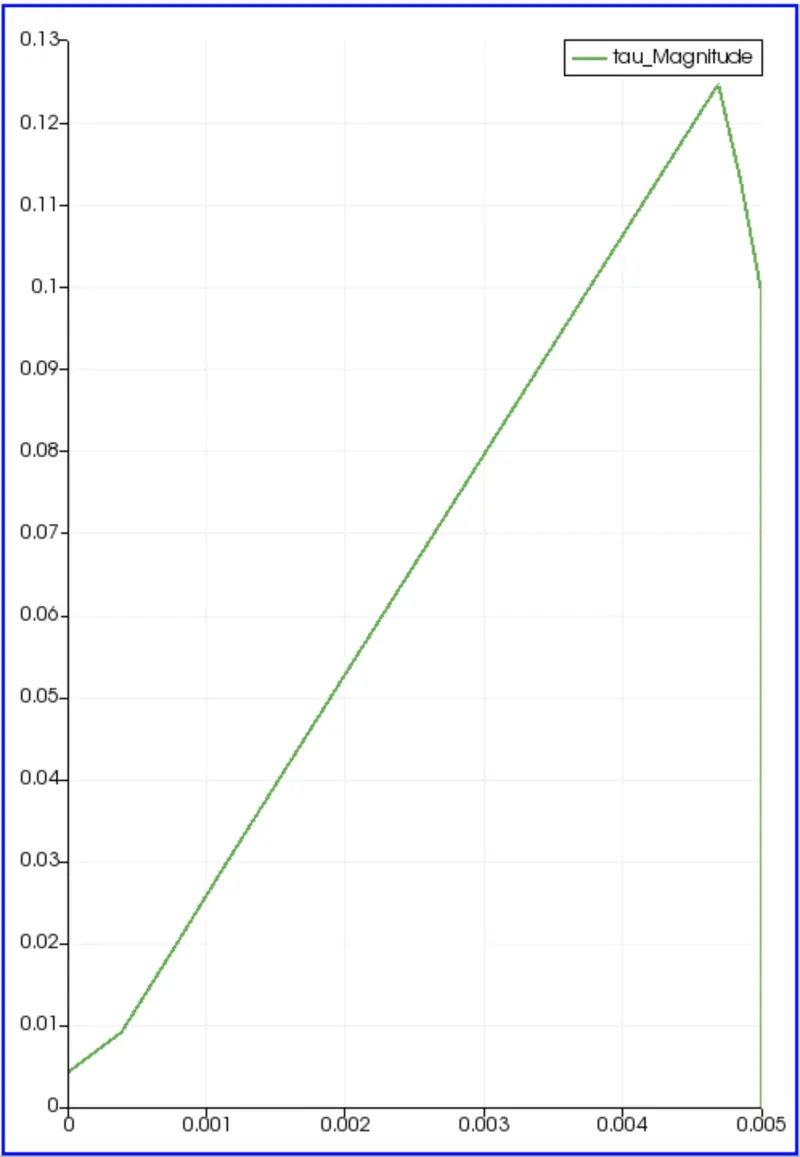
Results for Wedge Angle of 25 Deg:
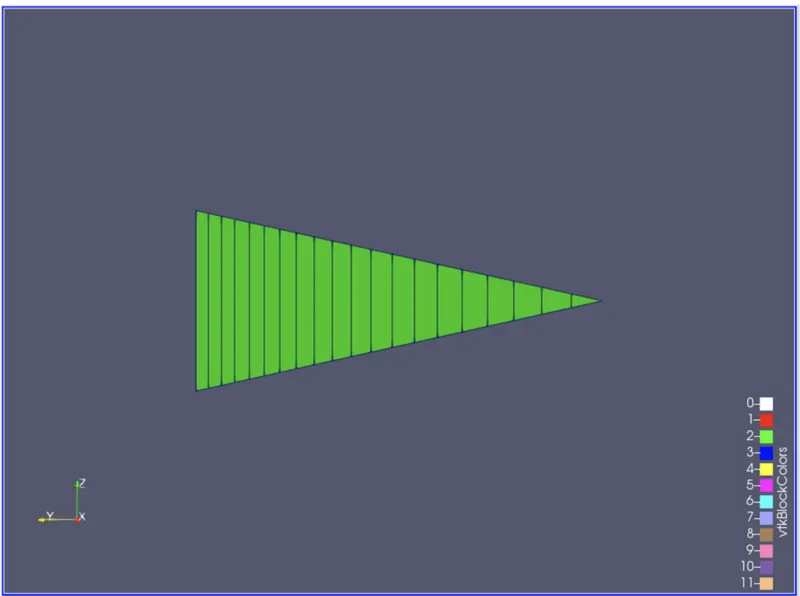
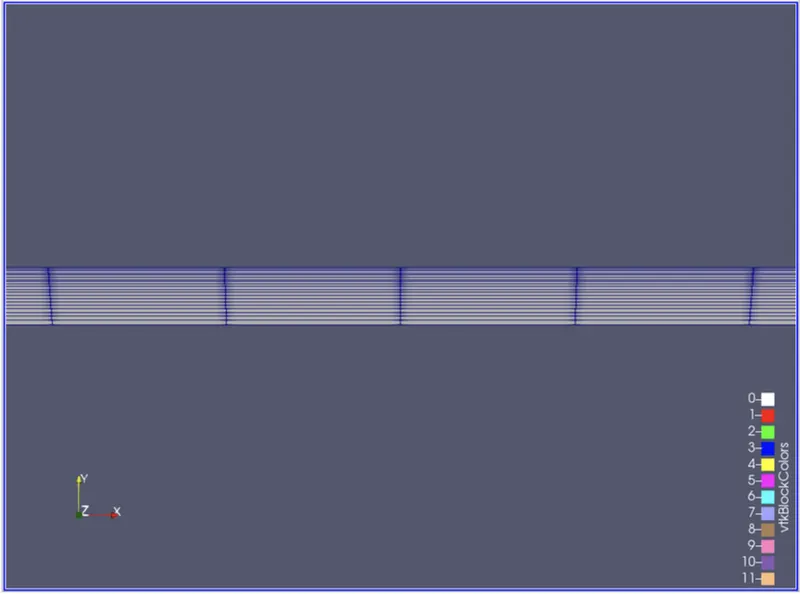
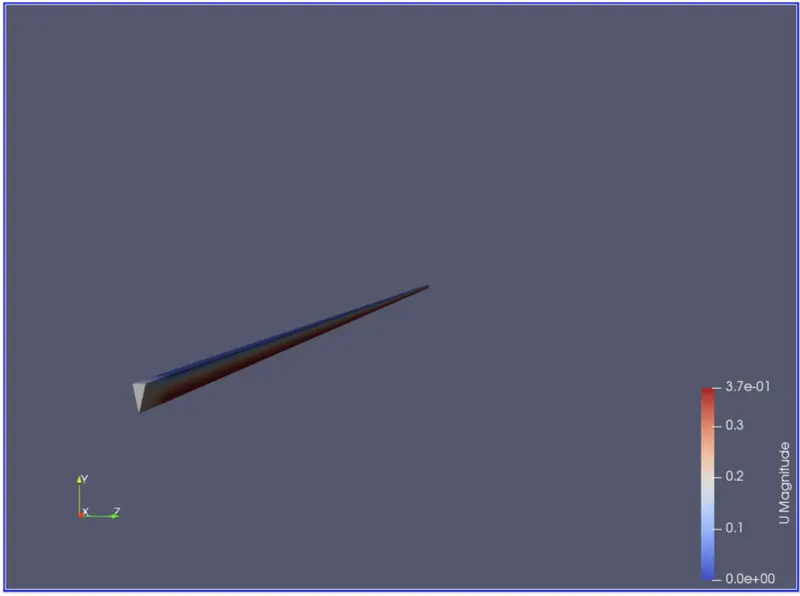
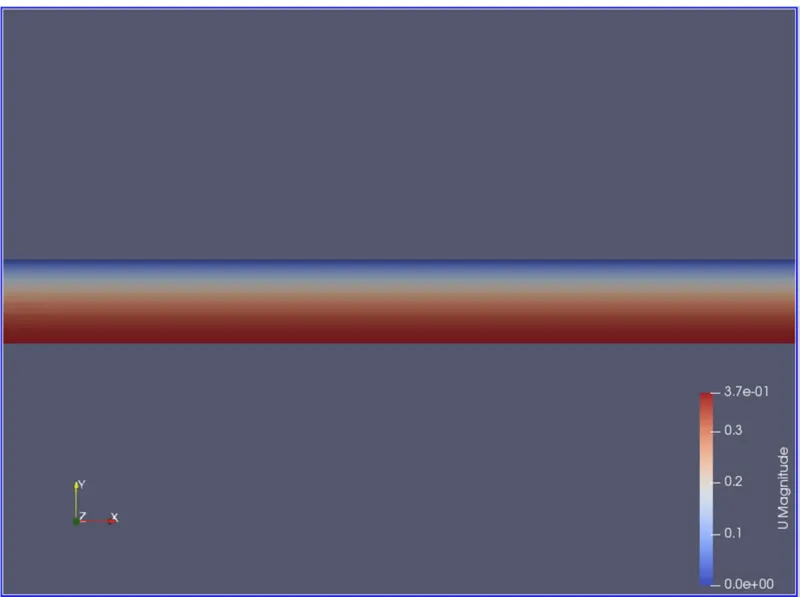
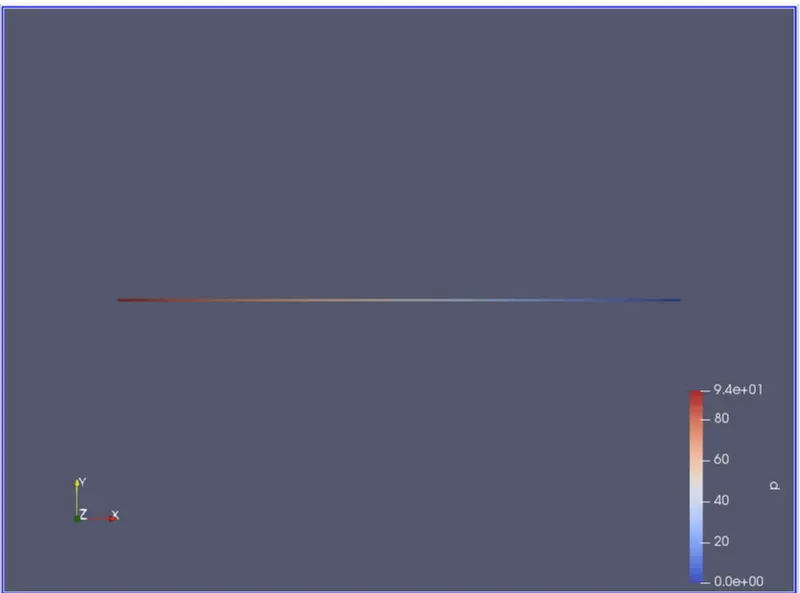
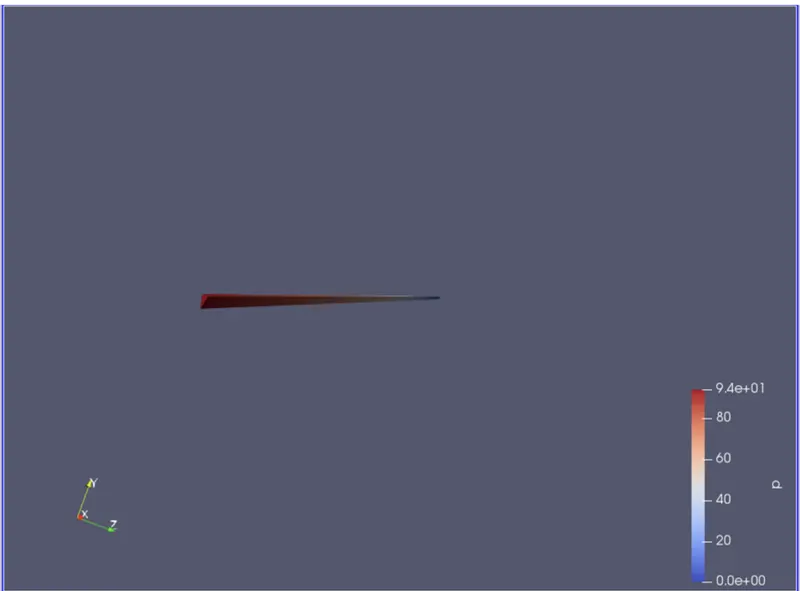
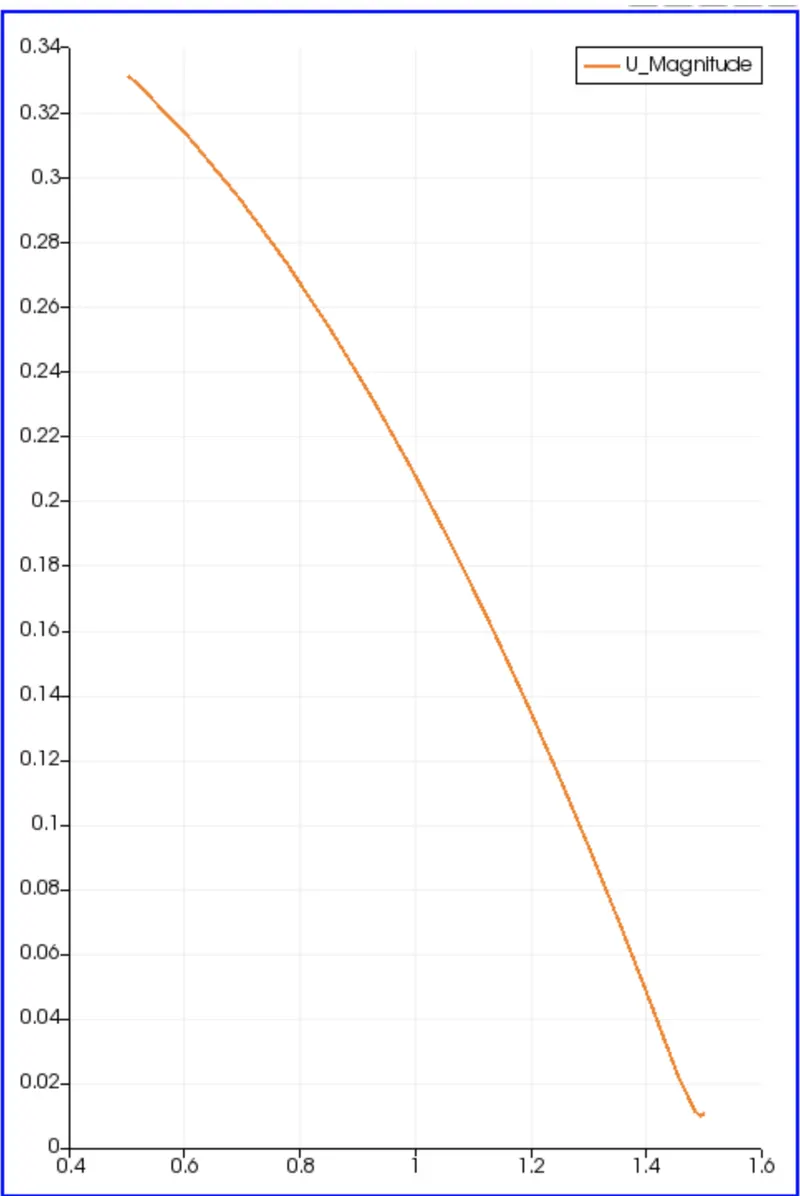
Velocity Plot Along for Wedge Angle 25 Deg:
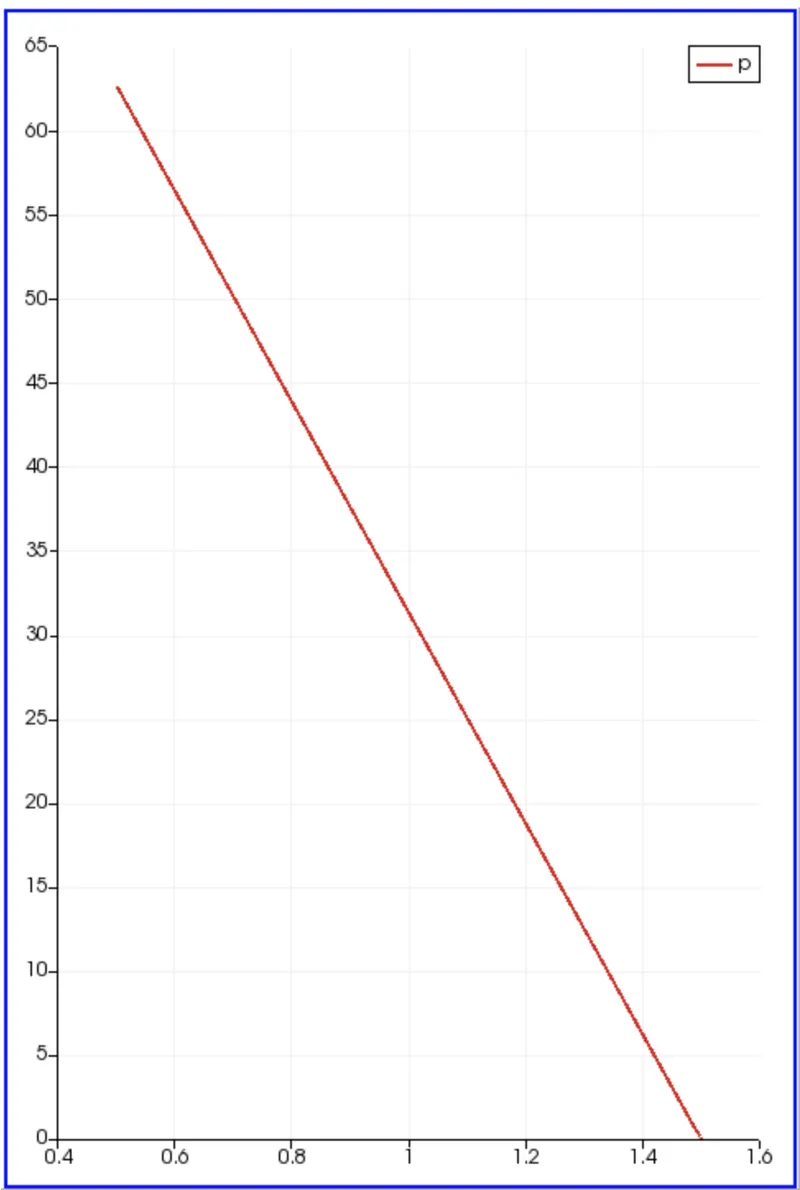
Pressure Plot Along X-axis for Wedge Angle 25 Deg:
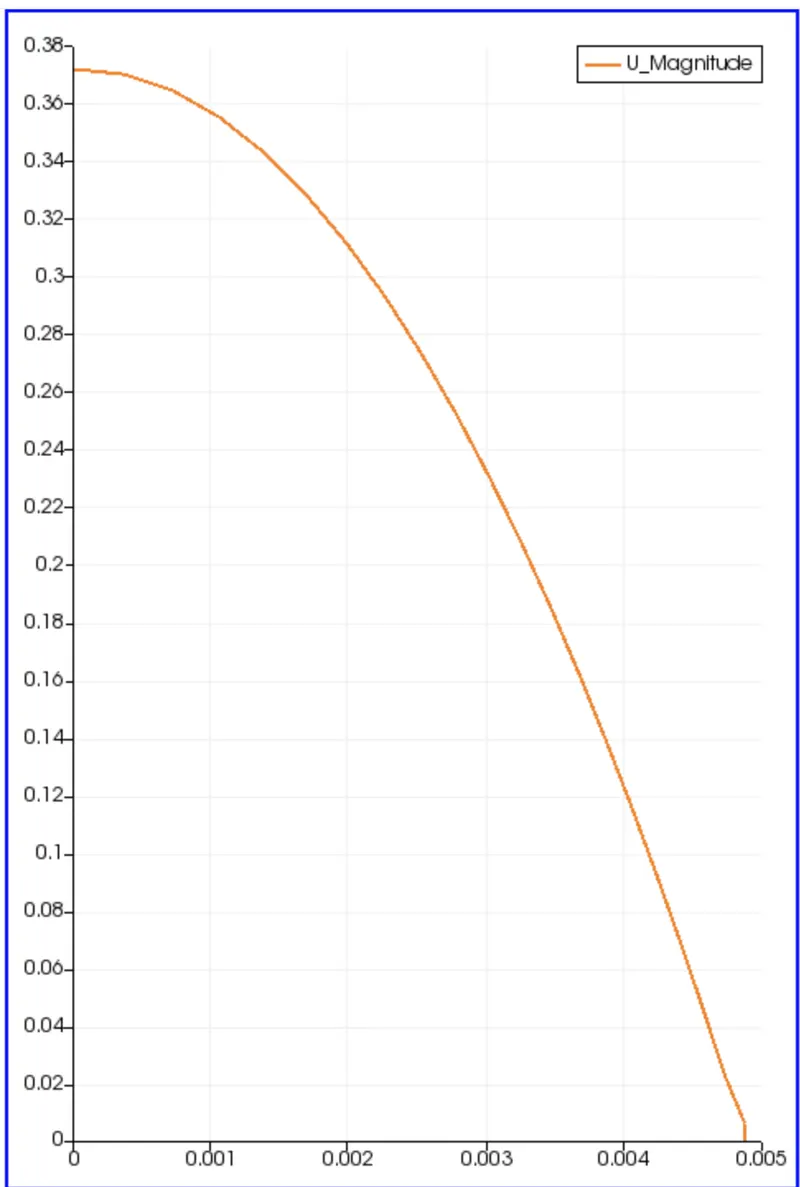
Fully Developed Velocity Plot Along Y-axis:
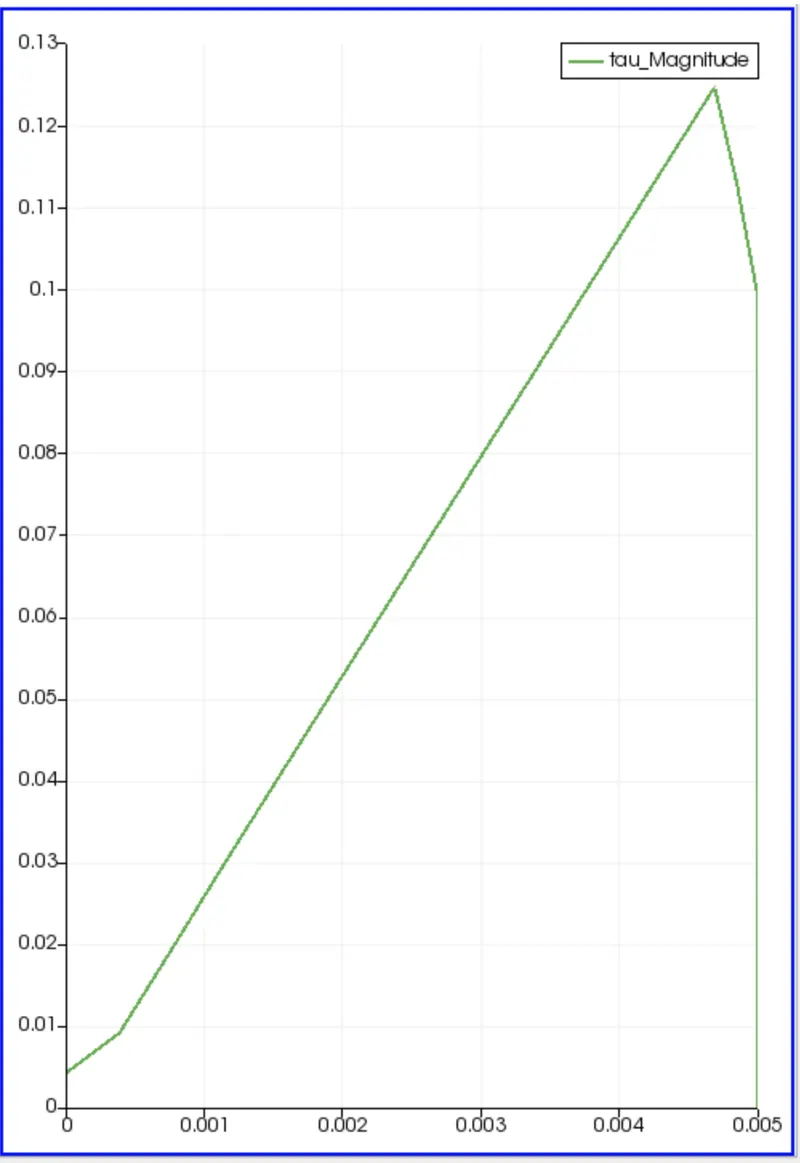
Shear Stress Curve:
Results for Wedge Angle of 45 Deg:
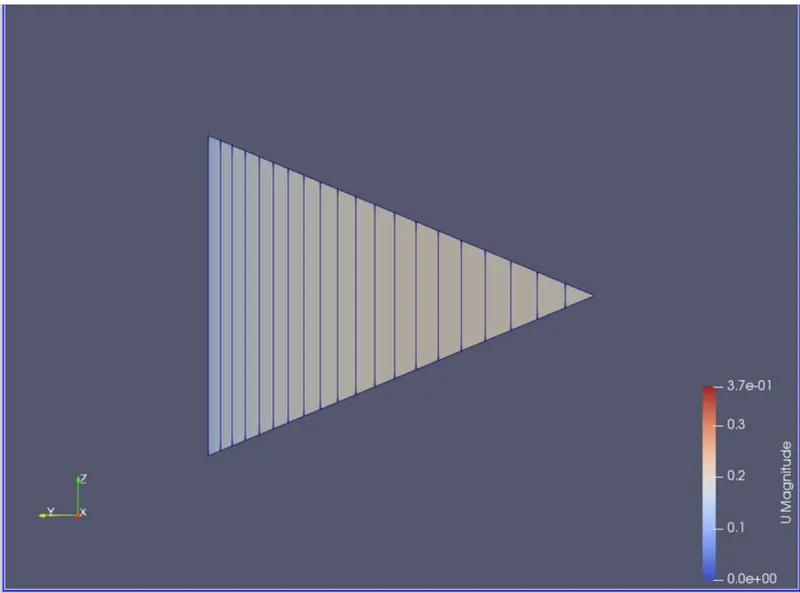
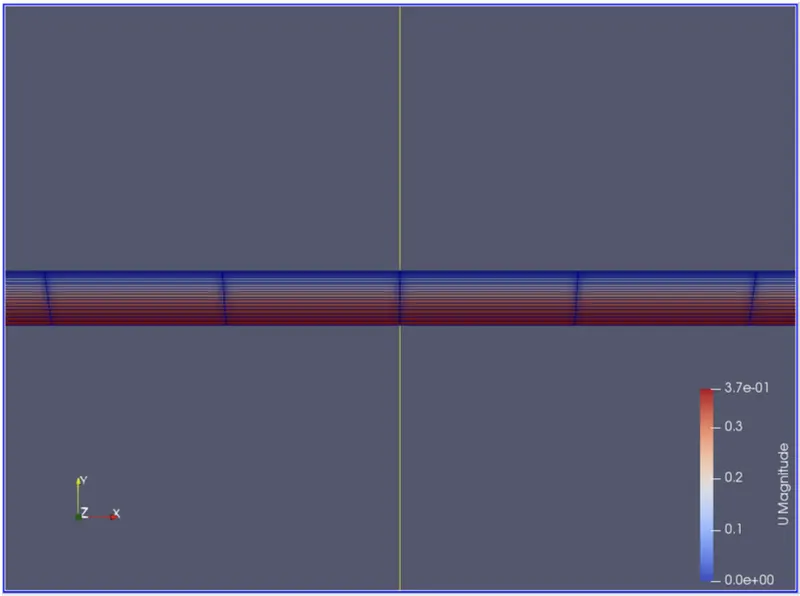
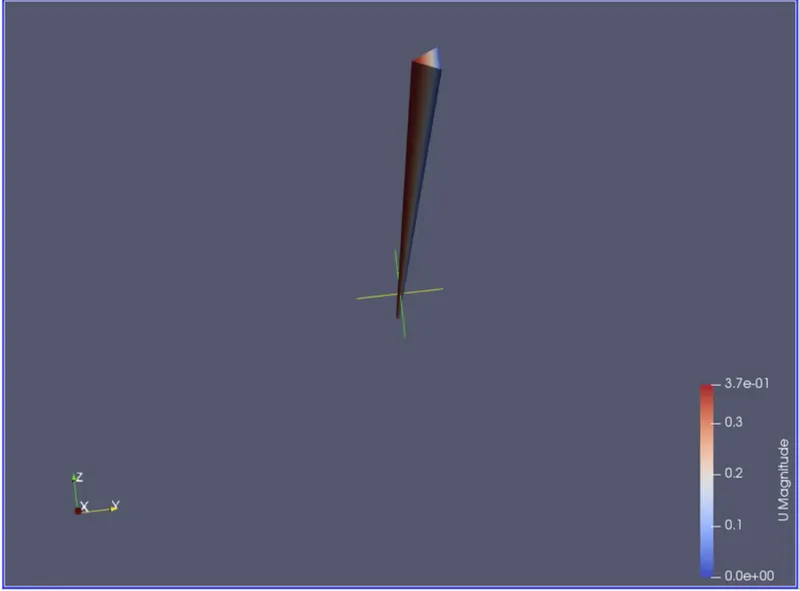
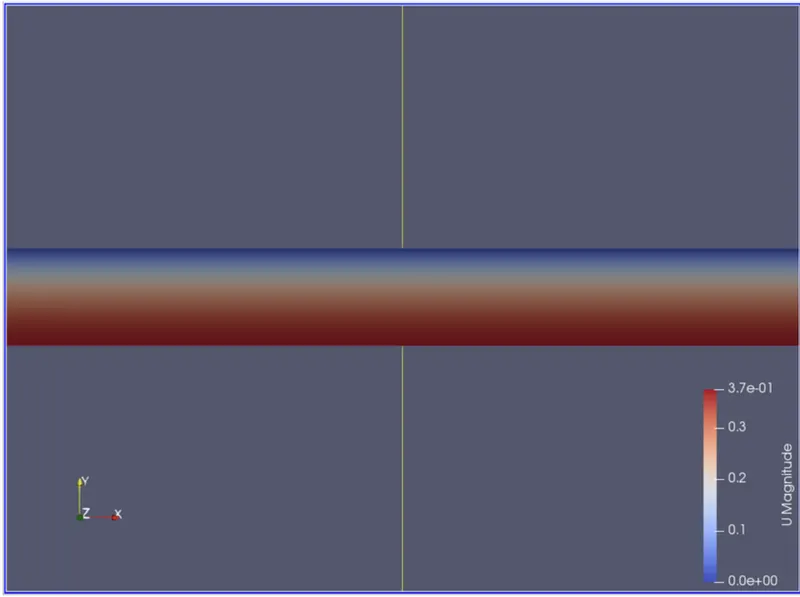
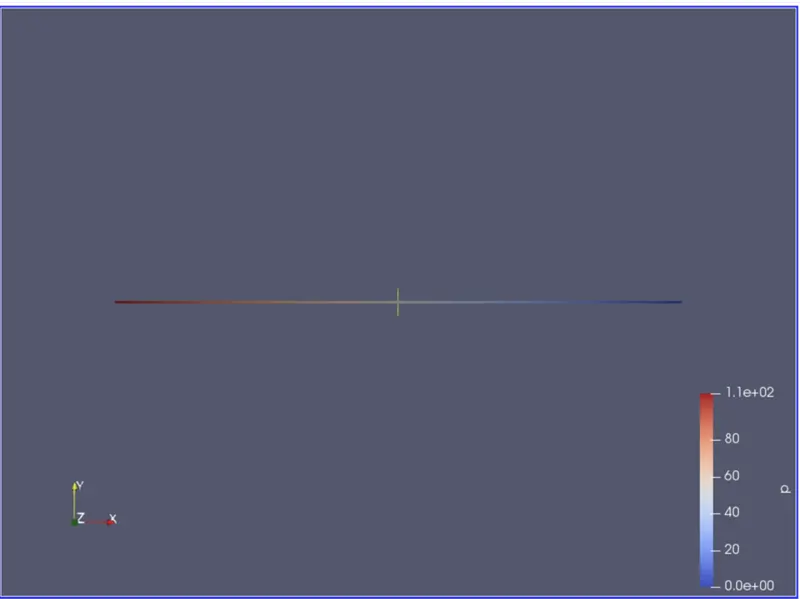
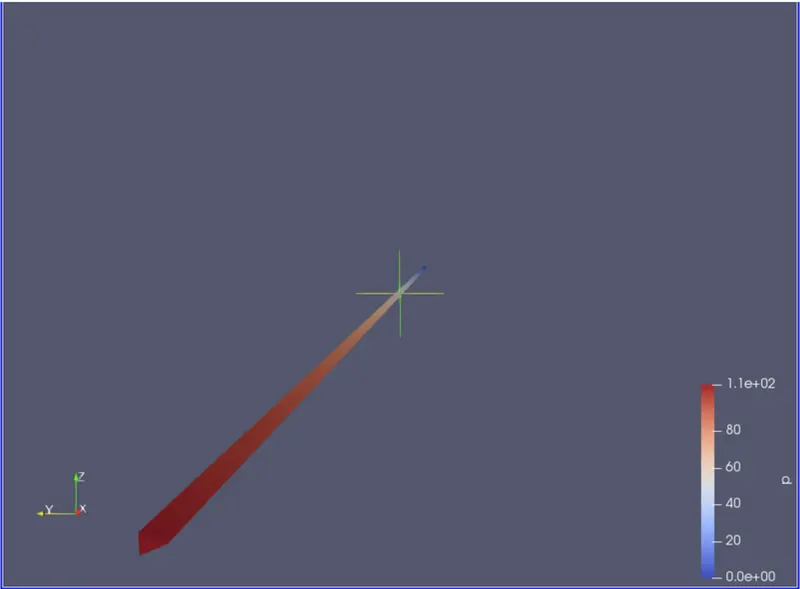
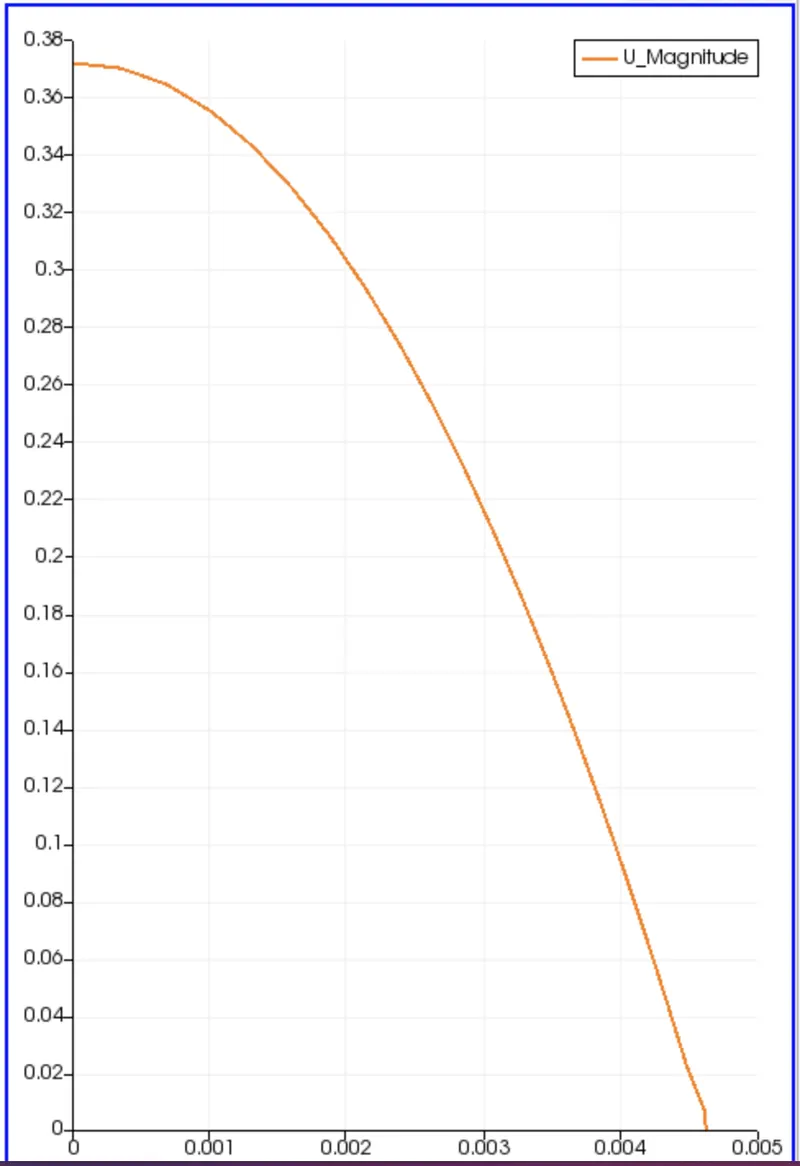
Fully Developed Velocity Plot Along Y-axis for Wedge Angle 45 Deg:
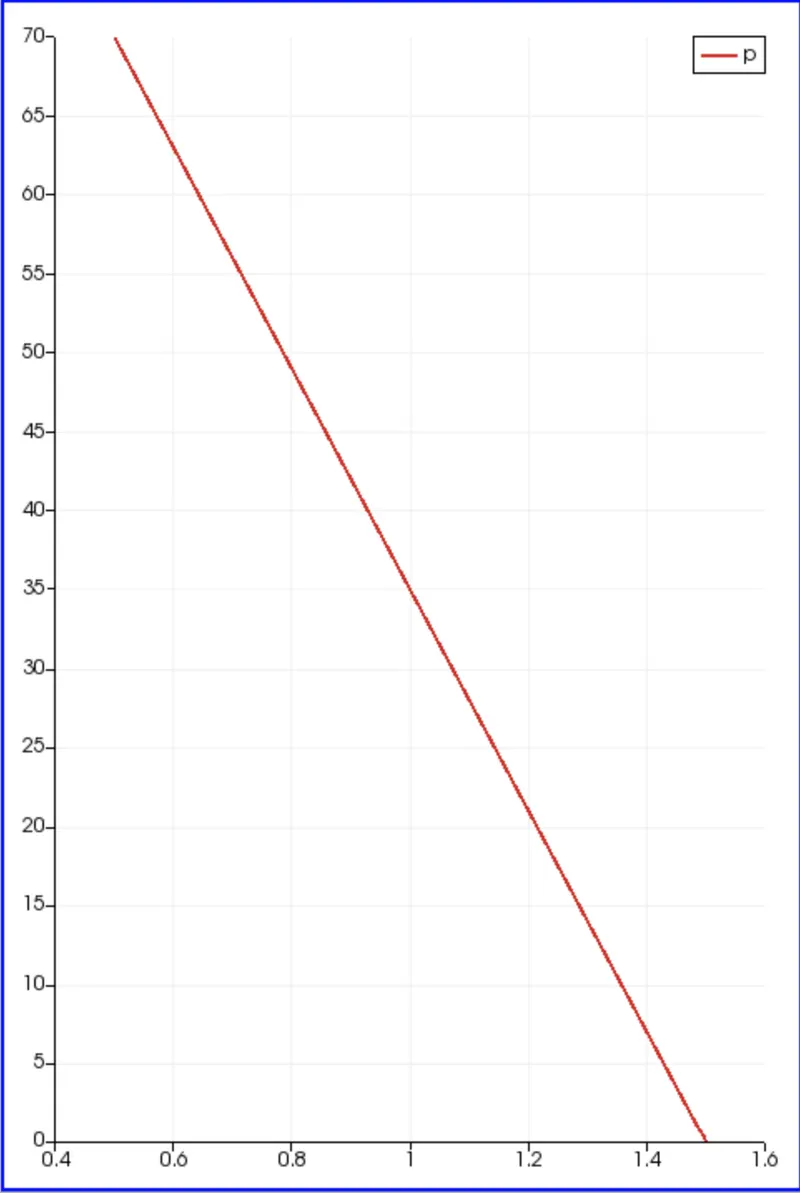
Pressure Plot Along X-axis for Wedge Angle 45 Deg:
Velocity Plot Along Y-axis for Wedge Angle 45 Deg:
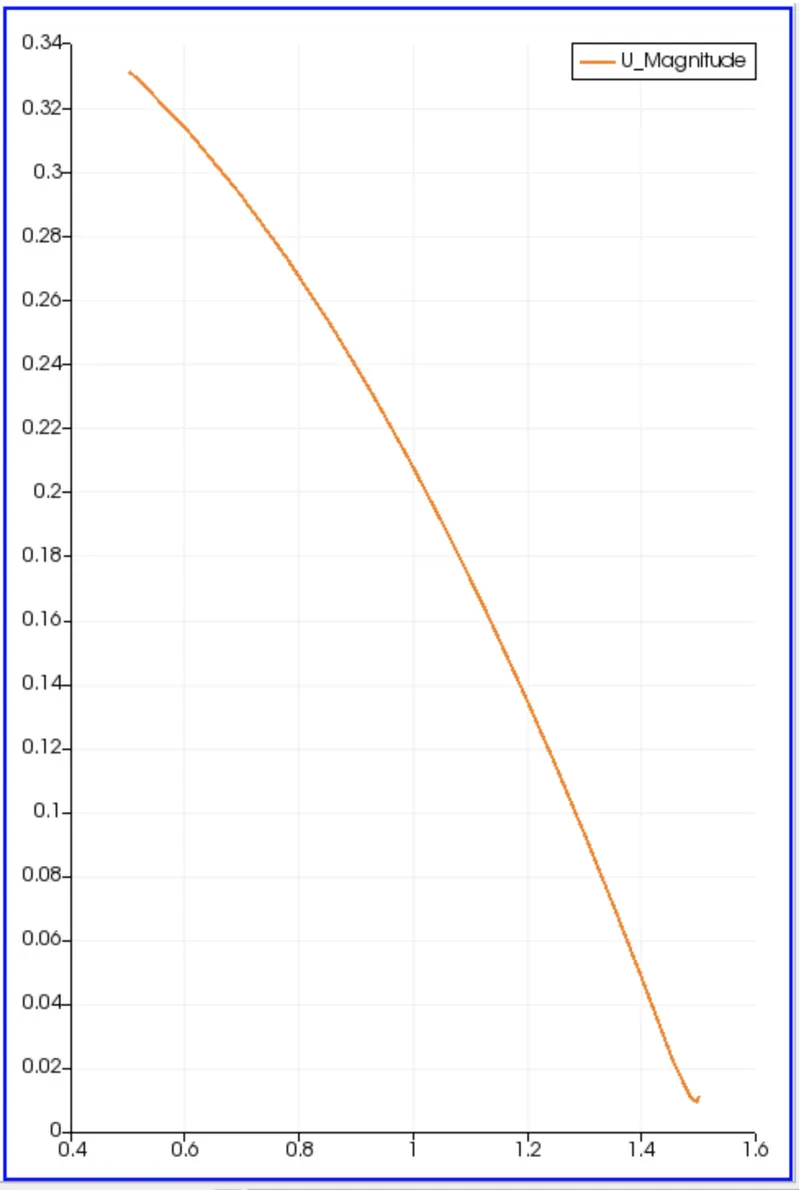
Shear Stress Curve: