Week 11: FSAE Car Project
Aim:
Perform an external aerodynamics analysis over the FSAE car model
Mercedes is going to be racing at two characteristically different racetracks.
1st Race is at Albert Park, Melbourne, Australia. As you can see in the following track map- it has a lot of turns. The average lap speed is estimated to be at 45kmph.
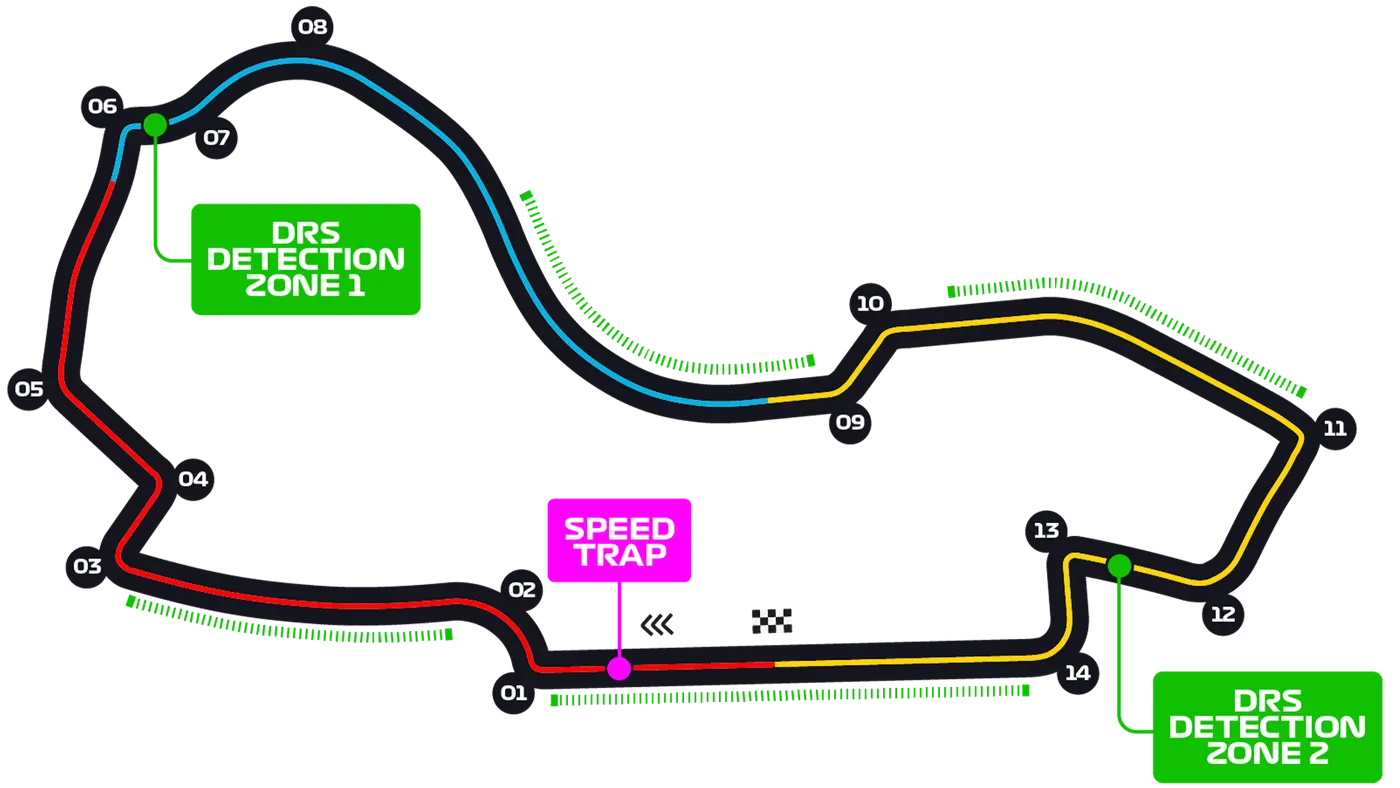
Looking at the track it has 70% turns at 45 degrees, 20% turns at 80 degrees, 10% turns at 20 degrees.
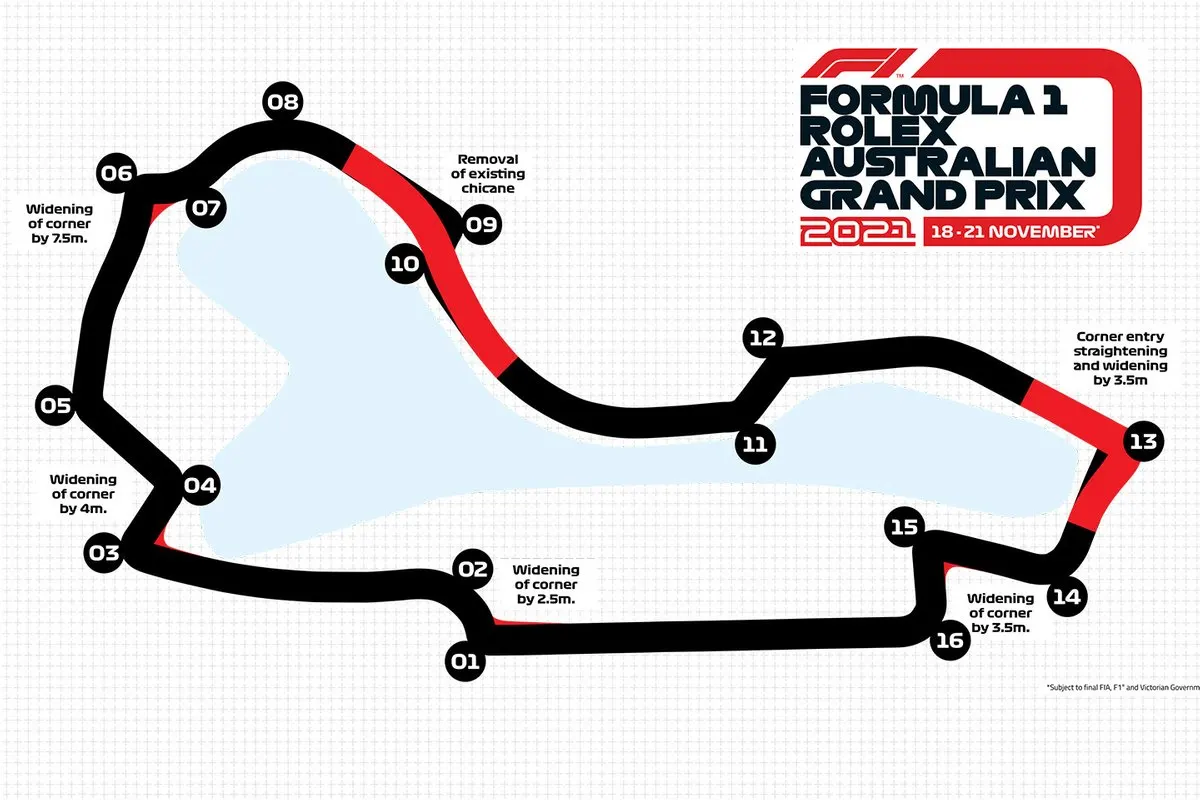
The Round 2 of the championship battle will put us at the iconic circuit of Monza in Italy. Monza's racing circuit is known for its long straights with lap speeds averaging 75 kmph.
Theory:
Formula-SAE cars are made for speed, maneuverability, optimal lightweight chassis. From these listed characteristics, the speed and corner maneuverability with maximum grip depend on the aerodynamic factors of the vehicle. On the straights, you need less drag with a full car body and during cornering, you need optimal downforce viz. negative lift. These aerodynamics factors play a deciding role in whether you gonna win the weekend or not.
The drag force is the force acting parallel to the ground (horizontal) in the direction of fluid flow. As it acts against the direction of motion of the racecar, reducing it to a major extent improves fuel economy(as the force required to propel the vehicle forward reduces). The negative lift or downforce is the force acting perpendicular to the direction of fluid flow towards the ground. This force helps in maintaining the traction with the ground, which is very important when controllability is taken into concern. So, increasing the downforce would benefit the car with controllability in all the circumstances that the car would need to undergo in the race-track.
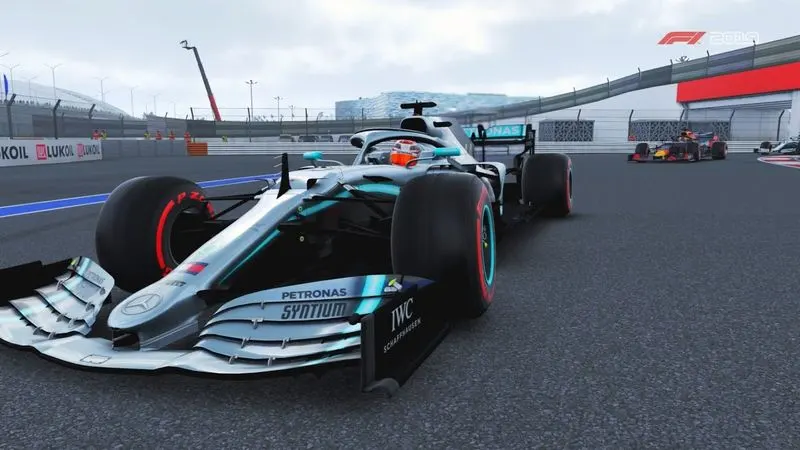
- Airplane wings create lift, but the wings on a Formula racecar produce downforce, which holds the car onto the track, especially during cornering. The angle of both front and rear wings can be fine-tuned and adjusted to get the ideal balance between air resistance and downforce.
- The body needs to be streamlined in shape to reduce drag force, create a high-pressure zone above the ground.
- The underbody is kept low to the ground to create a venturi effect with the low-pressure region and high-velocity air moving underneath it. This creates a large amount of downforce keeping the car away from slipping during turns.
Geometry:
Case Setup:
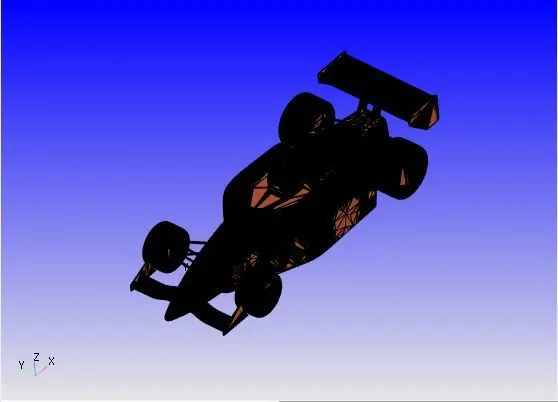
The Geometry was scaled using a proper scale. For that, the geometry was converted in Metre using the Scale feature. The diagnostic tool was used to find the open edge, Intersection edges, and other errors like orientation errors. Many features were used to repair the geometry which are as follows
- Deleting the edge, node, face.
- Patching the edge using the patch tool.
- Stitching the two misaligned edges.
The car geometry that was provided had 48 total open edge errors. so geometry cleaning plays an important role in setting up a simulation of a car.
First, the problem surfaces(Triangle) were deleted. Then the extra edges were removed to make a perfect open loop that can be a patch letter. For patching those new open edge
s the edges were checked and a patch repair option was used to patch the open edge method. Then the geometry was checked again to find any error.
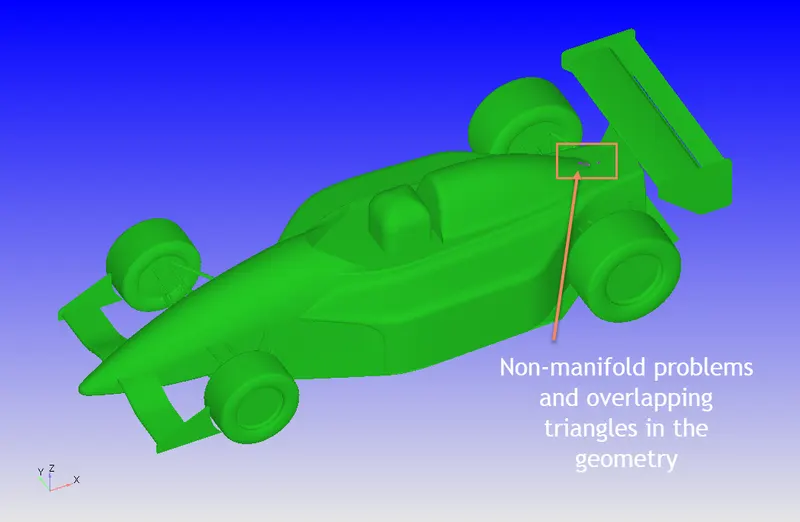
The normal orientation was fixed using the automatic option present in Transform>Normal> Automatic fix all the normals.
2. Assigning boundary flags for different components of the car can be done by using boundary fencing, where we create a fence around different boundaries to flag and select that boundary using boundary fencing selection. After assigning the boundary we have to delete the flat surface of the tire so that the wind tunnel and the tire surface do not coincide to create a meshing error.
3. Boundary-->Fence--> Between 2 vertices the option is used to create the fence around each and every boundary one edge at a time. Then they are flagged accordingly for conveniences such as Rear wing, front wheels, rear wheels, front suspension right, front suspension left, rear suspension right, rear suspension left, front wings right, front wings left, underbody, human, and the body.
4. As the wake region along the rear end of the car is the point of concern, the length of the wind tunnel is generally taken around 10 to 50 times that of the length of the car. Here, 3L in front of the car & 10L until the end of the wind tunnel is taken as the length. The width of the WT is about 2 times the length of the car so that the flow is not affected by the side walls. The height of the Wind Tunnel is approximately the length of the car (i.e. 2.5m).
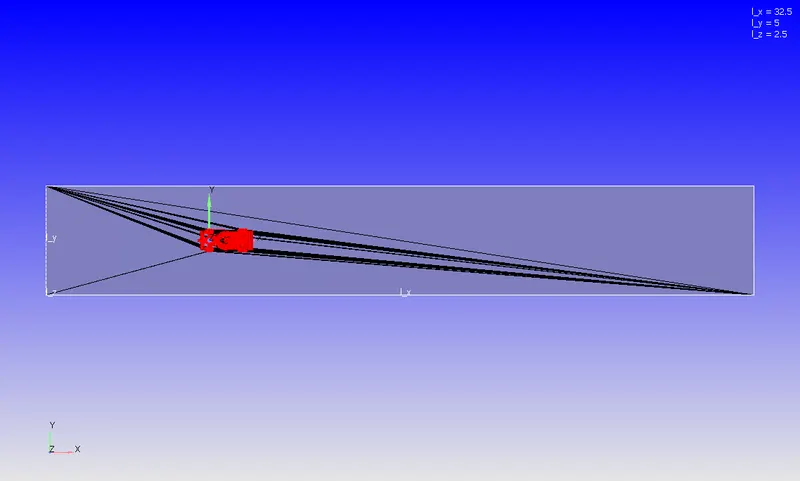
5. As the track of race 2 involves only straights and no major turns, it is designed first as per the above dimensions. After creating the wind tunnel, the various boundaries such as inlet, outlet, top-side walls, and bottom-wall are flagged in addition to the existing boundaries.
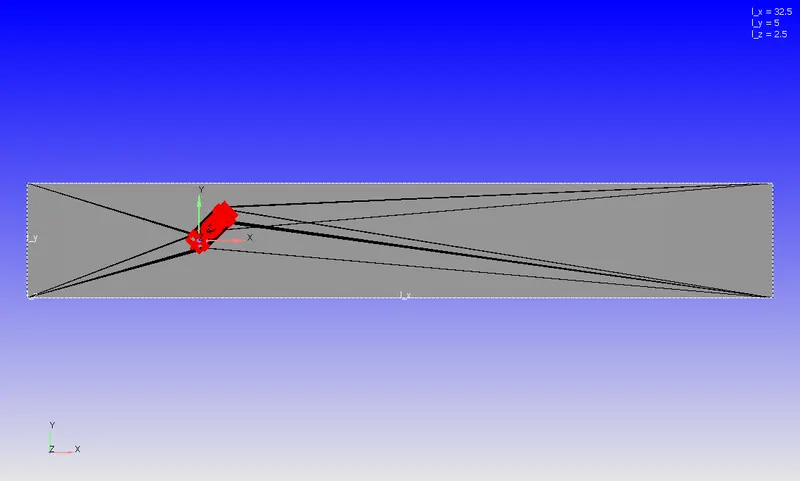
6. For Race 1 at Albert Park, the wind tunnel is similar in dimension to the previous, but as the race track contains a lot of turns, the car is turned to an angle based on the weighted average
of the given angles. The car has to take 70% of the turn at 45 degrees, 20% of turn at 80 degrees, 10% of turn at 20 degrees. so to take a complete turn car has to turn at an average angle.
Weight Average =
where,
Substituting values in the equation above,
Weighted Average Angle = (0.7*45 + 0.2*80 +0.1*20)/(0.7+0.2+0.1) = 49.5 deg
7. the car is turned thru' 49.5deg about the center of the car, using the Transform -->Rotate option of Converge CFD. To be particular, it is rotated about the z-axis as the reference axis, with an angle of 49.5deg w.r.t. the x-axis.
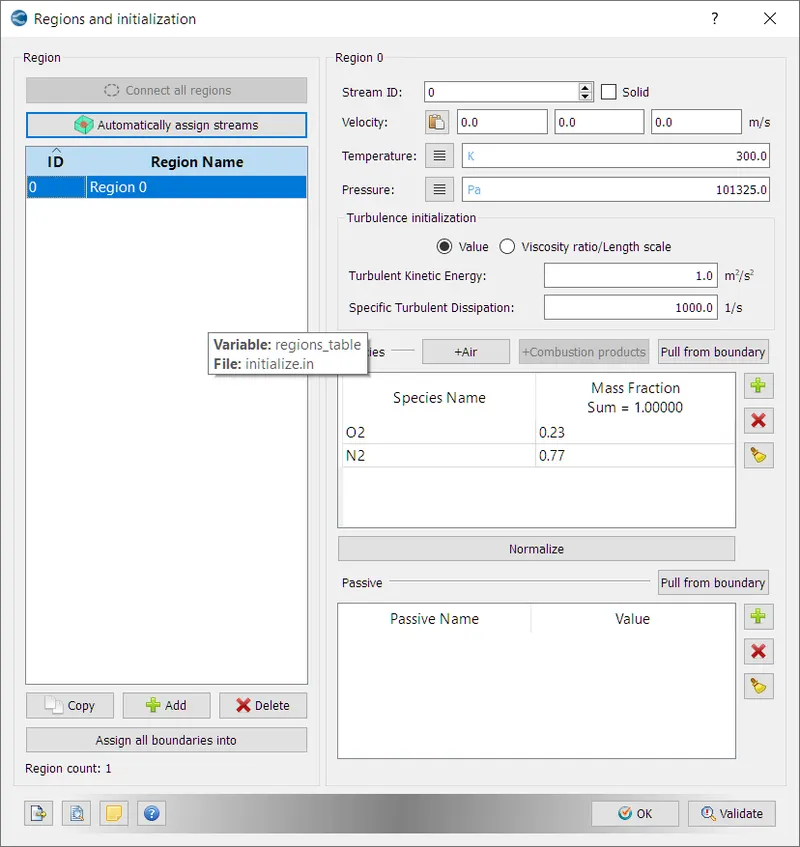
8. The inputs for the simulation are given by means of case setup. The fluid/material medium is selected as air, and its default properties are specified.
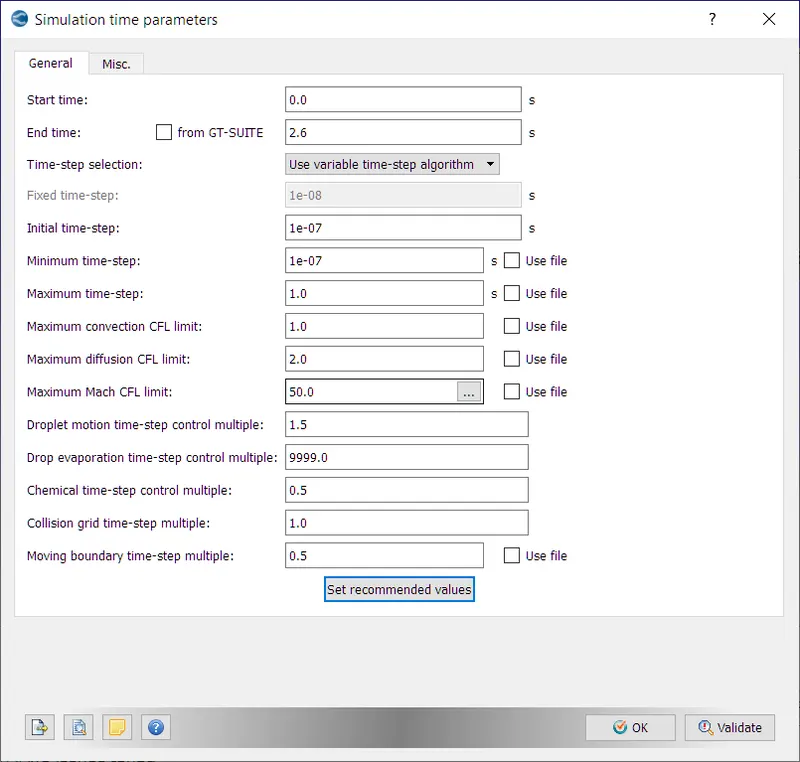
9. The Simulation Parameters are specified as the transient solver is selected under Run Parameters as it is a time-dependant simulation and other default parameters are validated. The Simulation time parameter is calculated using the Flow-through time.
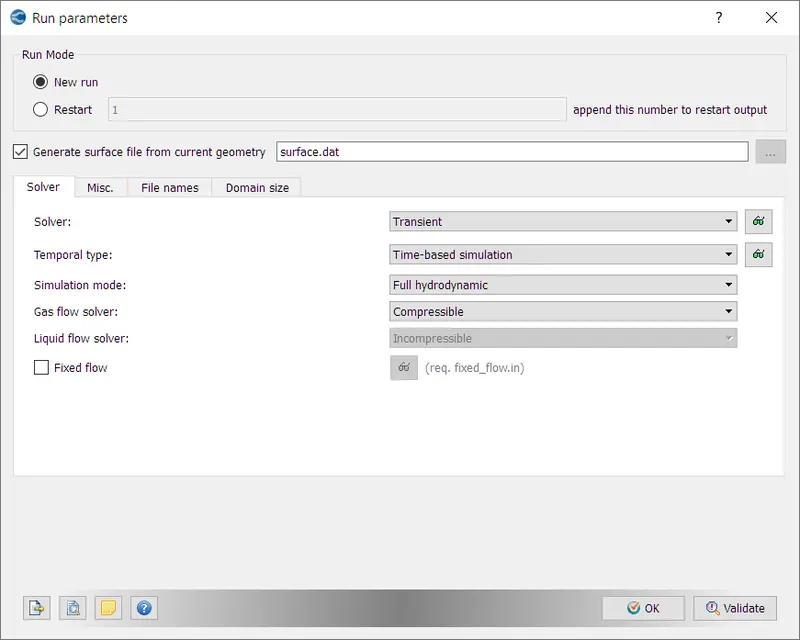
10. The entire length of the wind tunnel created is 32.5 m. Say that the flow of 20.83 m/s, starts from the inlet and reaches the exit of the wind tunnel, so the time taken by the flow to reach the exit of the tunnel is,
t=32.5/20.833 = 1.56 sec.
Let us simulate the flow about 3 to 4 times, therefore total time or end time of the simulation is
1.56* 4 = 6.24 sec 7 sec.
11. The Boundary Conditions are given as follows
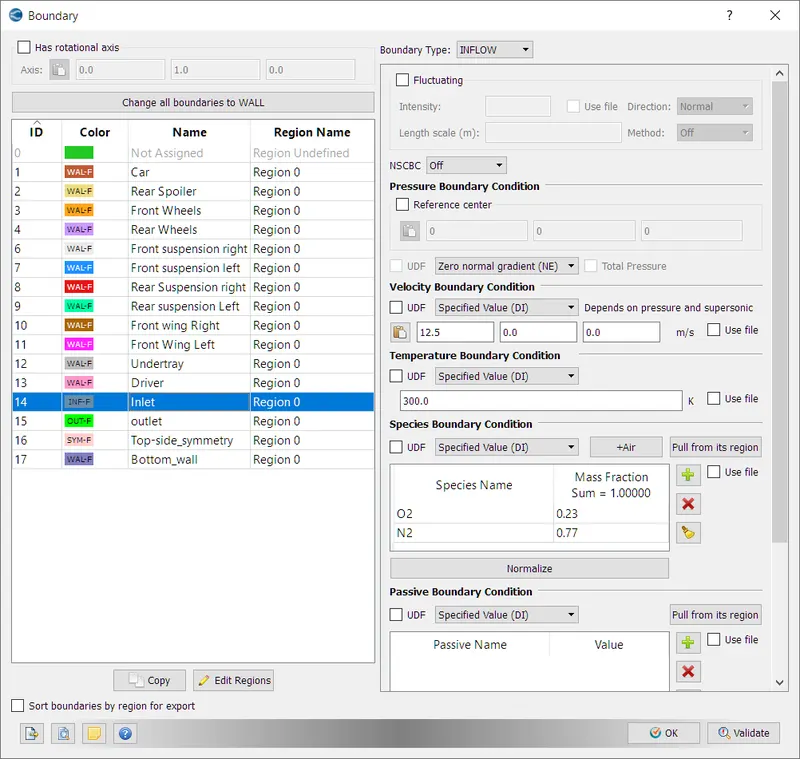
| Boundary Name | Boundary Conditions |
| Car | Wall boundary: Law-of-the-wall option is selected as the boundary layer formation is required in this region. |
| Rear Spoiler | Wall boundary: Law-of-the-wall option is selected as the boundary layer formation is required in this region. |
| Front Wheels | Wall boundary: Law-of-the-wall option is selected as the boundary layer formation is required in this region. |
| Rear Wheels | Wall boundary: Law-of-the-wall option is selected as the boundary layer formation is required in this region. |
| Front Suspension Right | Wall boundary: Law-of-the-wall option is selected as the boundary layer formation is required in this region. |
| Front Suspension Left | Wall boundary: Law-of-the-wall option is selected as the boundary layer formation is required in this region. |
| Rear Suspension Right | Wall boundary: Law-of-the-wall option is selected as the boundary layer formation is required in this region. |
| Rear Suspension Left | Wall boundary: Law-of-the-wall option is selected as the boundary layer formation is required in this region. |
| Front Wing Right | Wall boundary: Law-of-the-wall option is selected as the boundary layer formation is required in this region. |
| Undertray | Wall boundary: Law-of-the-wall option is selected as the boundary layer formation is required in this region. |
| Driver | Wall boundary: Law-of-the-wall option is selected as the boundary layer formation is required in this region. |
| Inlet | Inflow boundary: Velocity along x=12.5 m/s and fluid medium air is added. Pressure-Neumann BC |
| Outlet | Outflow boundary: Pressure=101325Pa. Velocity-Neumann BC. Air is the working fluid. |
| Top-side Symmetry | Symmetric Boundary |
| Bottom Wall | Wall boundary: Law-of-the-wall option is selected as the boundary layer formation is required in this region. |
12. Standard k−ω model as it is an external flow. With automatic capturing of wall-function enabled, to capture the growth of boundary layer when a flow interacts with the body. This records the viscous sub-layer in an accurate way. The k−ω turbulence model is selected under the Physical models. This model is a combination of RNG
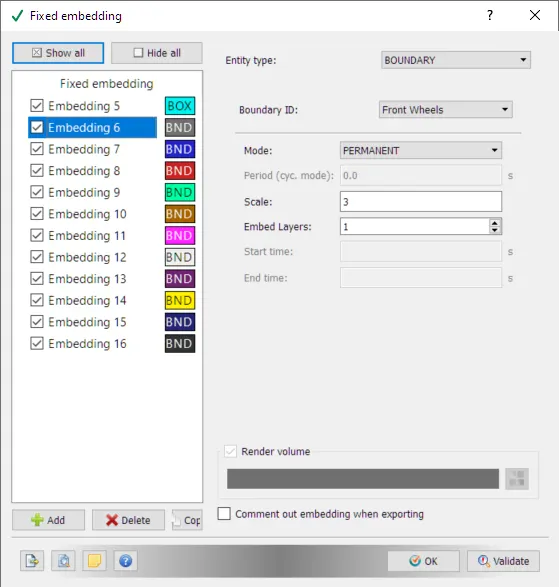
k−ε turbulence model and Standard k−ω model. This acts as k−ω model near the wall boundaries and RNG model away from the wall. Hence, it gives an accurate prediction of the simulation both near a wall and away. Moreover, it is accorded for its automatic wall treatment.
13. After setting up the grid size and embedding scale, the input files are generated and exported to a folder. Using Cygwin, the converge executable files are run and output files are generated.
14. These outputs are converted into a form Paraview can interpret, by means of the option available in converge studio to run the post-convert executable.
15. Then the outputs are post-processed using Paraview software and the simulation results are analyzed.
Results:
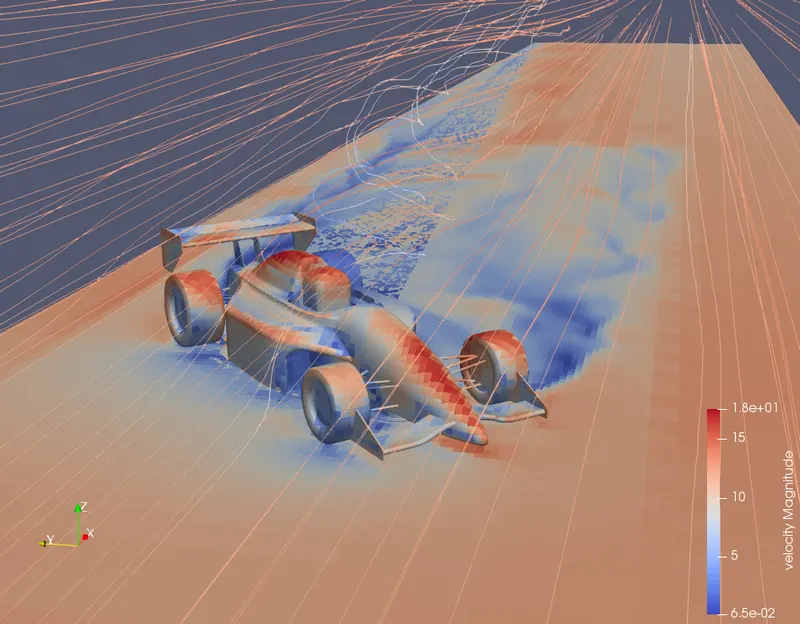
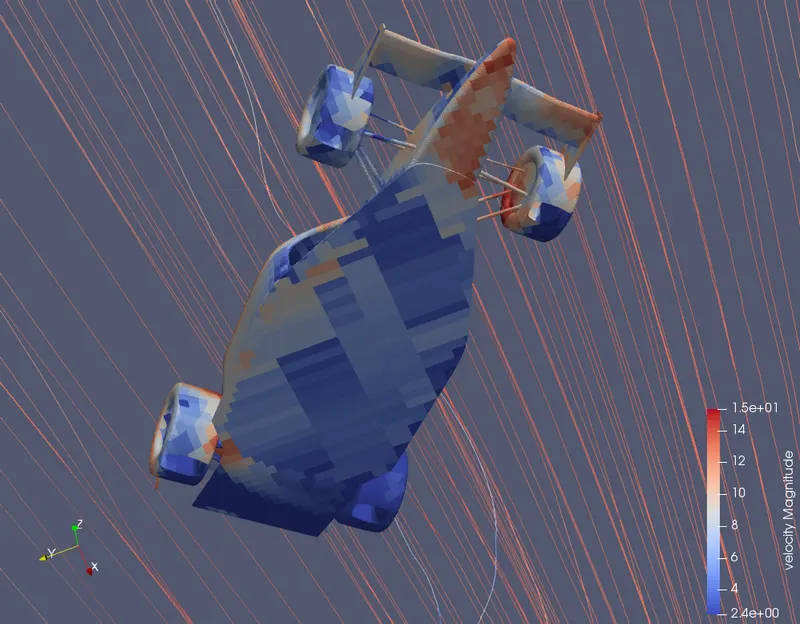
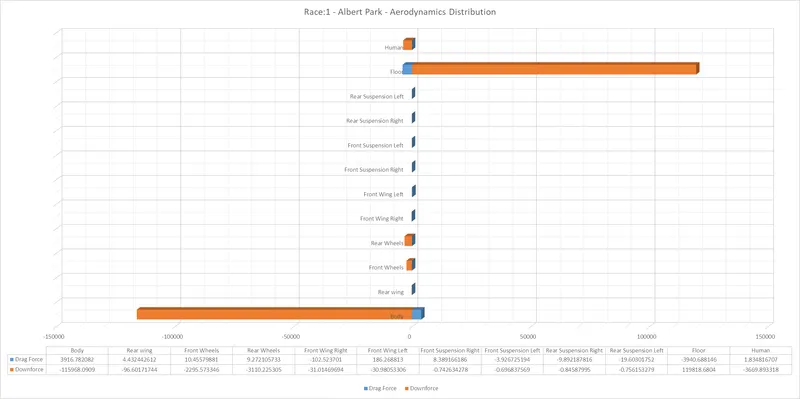
Race 1: Albert Park with lots of Turns
| Boundary | Plot |
| Car Body | 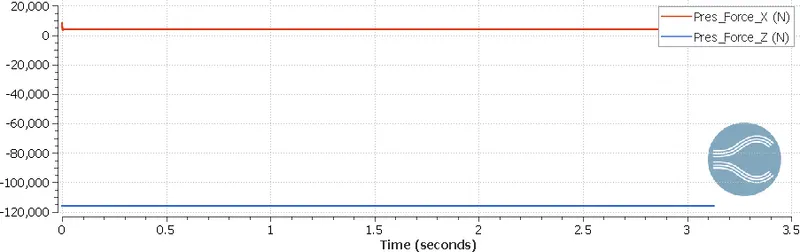 |
| Rear Wing | 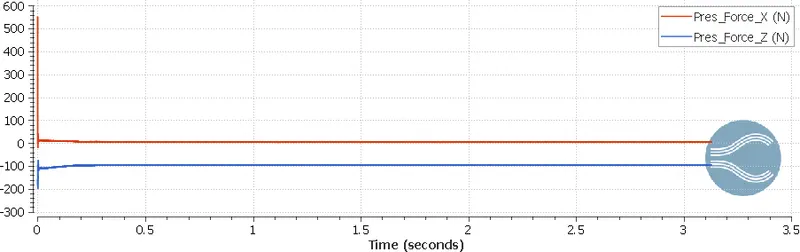 |
| Front Wheels | 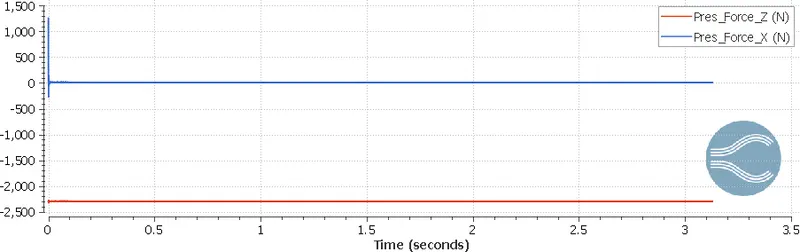 |
| Rear Wheels | 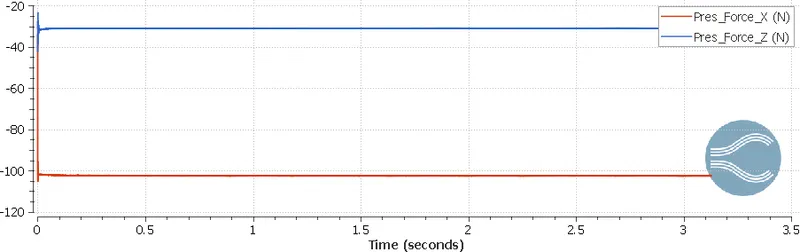 |
| Front Wing Right | |
| Front Wing Left | 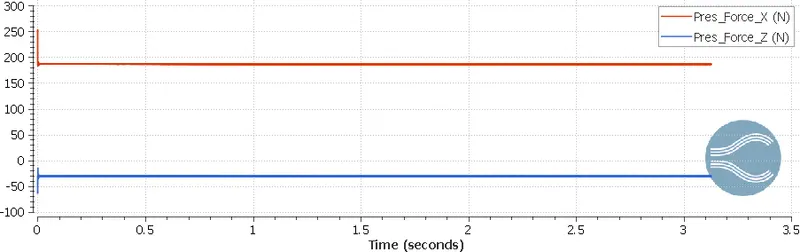 |
| Front Suspension Right | 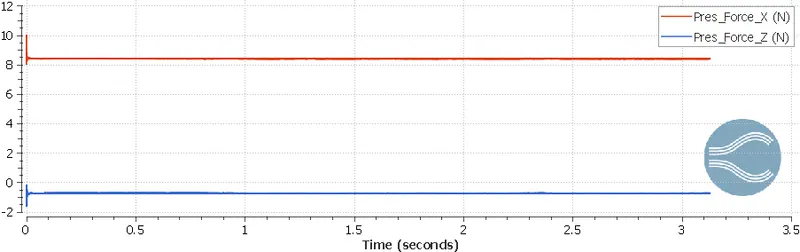 |
| Front Suspension Left | 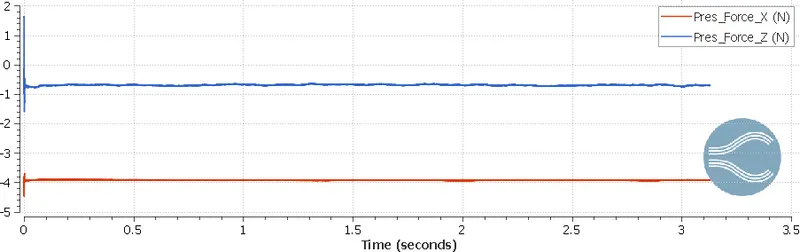 |
| Rear Suspension Right | 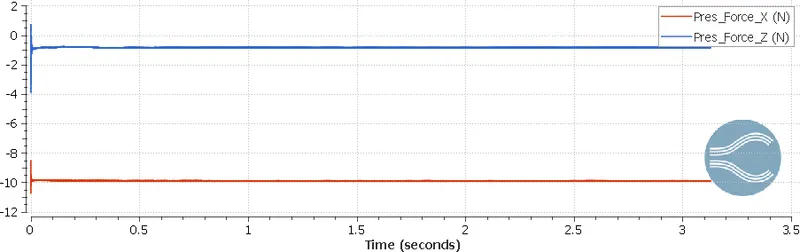 |
| Rear Suspension Left | 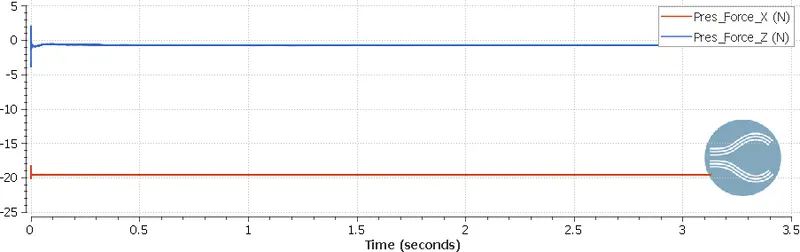 |
| Underbody - Floor | 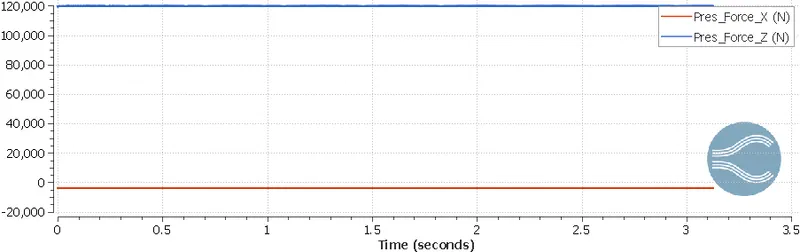 |
| Human | 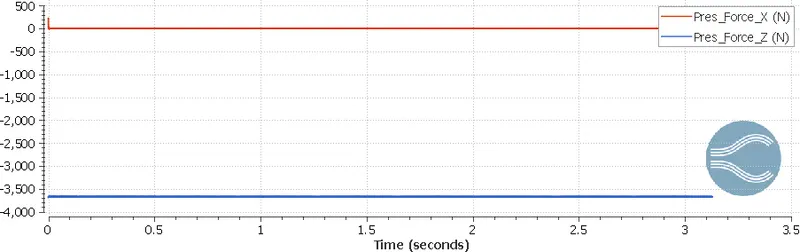 |
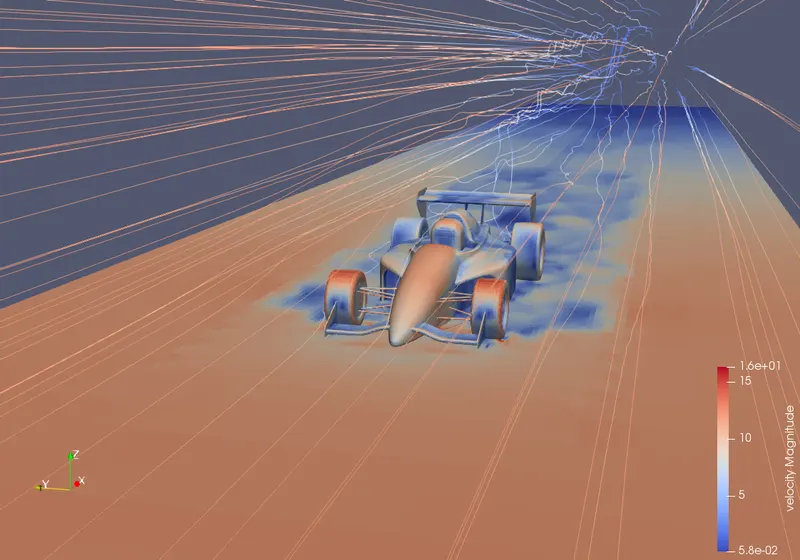
Race 2: Monza Circuit with straights
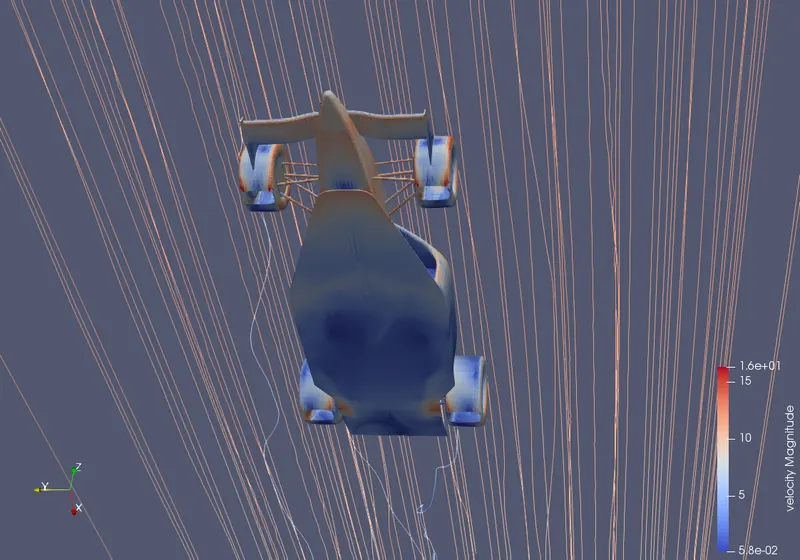
| Boundary | Plot |
| Car Body | 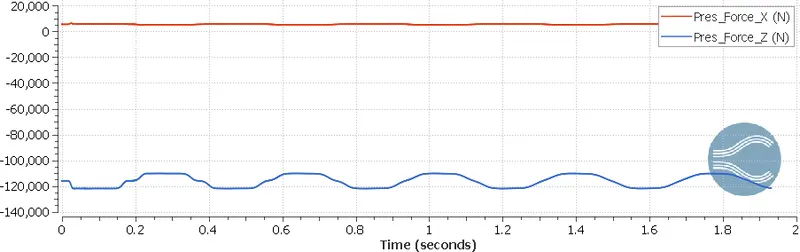 |
| Rear Wing | 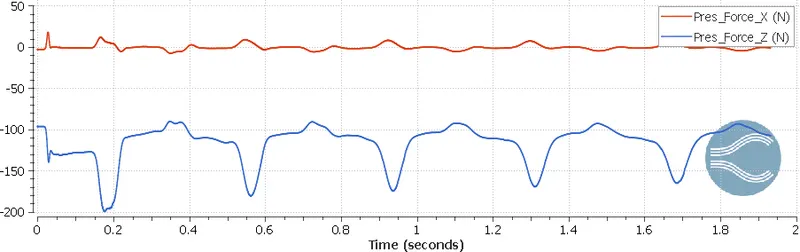 |
| Front Wheels | 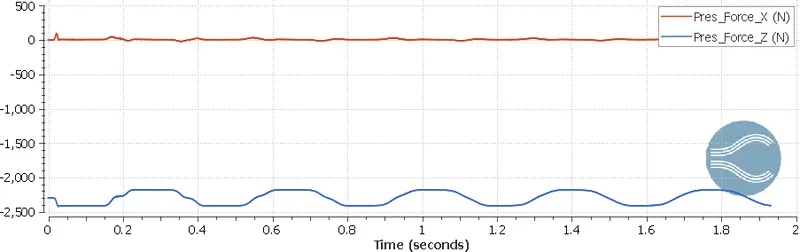 |
| Rear Wheels | 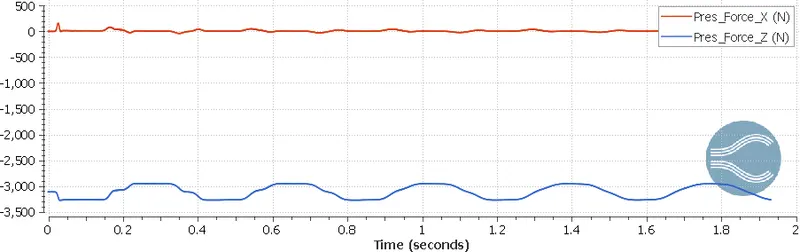 |
| Front Wing Right | 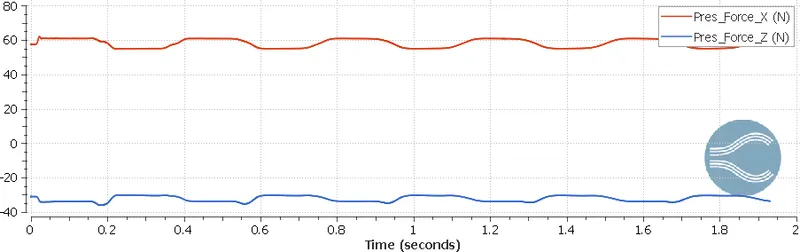 |
| Front Wing Left |  |
| Front Suspension Right | 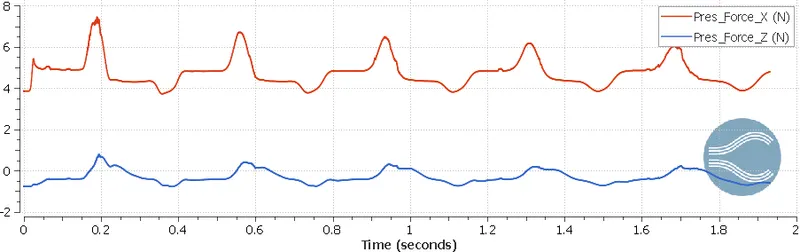 |
| Front Suspension Left |  |
| Rear Suspension Right | 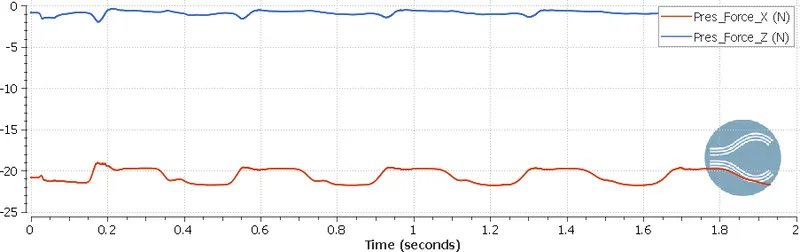 |
| Rear Suspension Left | 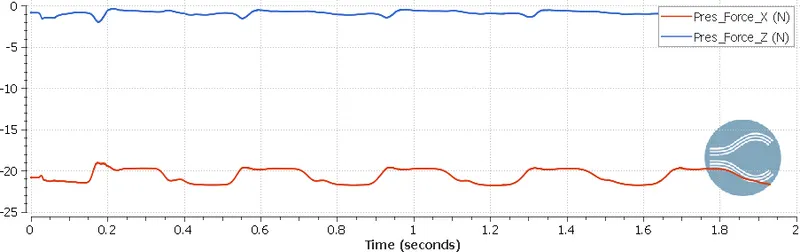 |
| Underbody - Floor | 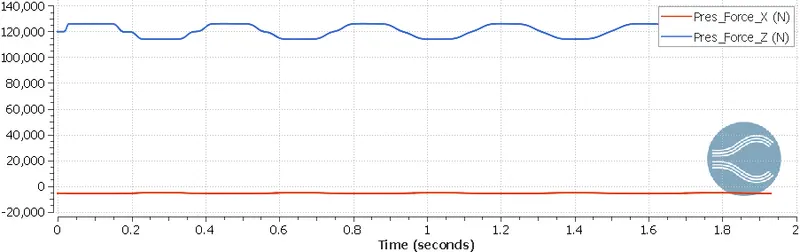 |
| Human | 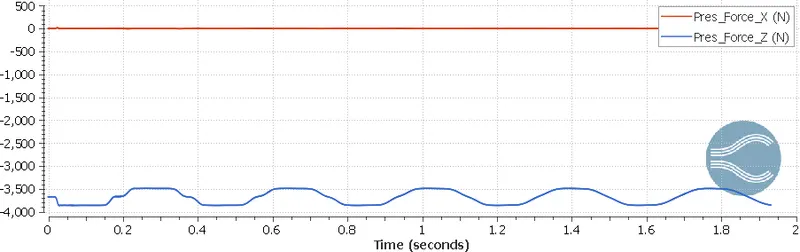 |
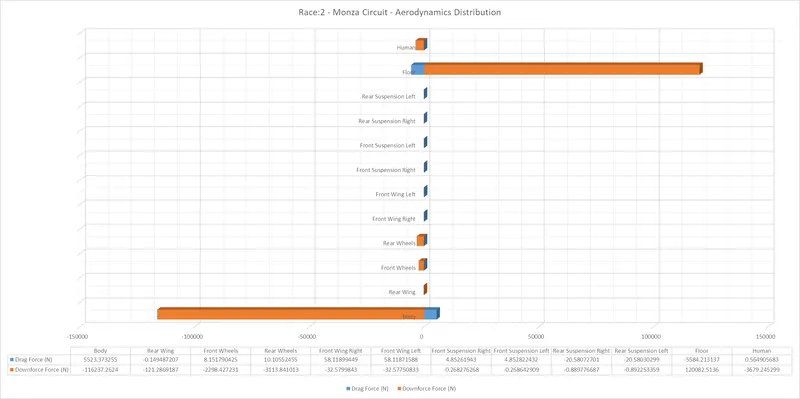
Summary of Results:
- the negative lift force generated on the car's underbody in race 1 is much higher than race 2. because during the turns there should be more negative lift force generated on the car so that the car stick to the road.
- The flow over the rear wing as seen that it creates lift force over the corners by seeing the velocity profiles. This is because the generation vortices and the airfoil
in the car wing usually have a low aspect ratio and in turn, it creates the drag behind the body and also reduces the angle of attack of free stream air. To improve
the lift is to increase airfoil thickness and also increase the height of the endplate. The Y plus is uniform throughout the body. The forces on the suspension links are
very low and there is a need for a change of suspension links. - more lift force is generated on the car body in race 1 compared to race 2.
by seeing the pressure contours, there is more pressure acting on the tires which means more drag force got induced because of tires. - the drag force increased in race 2 with an increase in velocity compared to race 1.
- accurate results will be going to appear with more refinement of cells.
- According to the result observed in the front wing, it did not generate more downforce than needed, thus, the front wing should be designed aerodynamically to increase the overall downforce on the car.
- The car body was rotated at an angle of 49.5 degrees which is a side slip angle and the tire experiences more load because of turning and high-velocity region in
the nose and the air ducts then the low-pressure region in the flow separation region streamline visualization will create drag into rn both combine to produce
lift.
Conclusion:
The Aerodynamics behavior of the FSAE car for two different track conditions has been analyzed.