Week-11 Challenge: Braking
1.For a defined driving cycle, calculate the energy required for braking.
Breaking energy is calculated for customised driving cycle
consider the vehicle which is 1000kg in weight is travelled 5Km with many speed deceleration terms
WKT, Breaking enrgy=`(1/2*m*V^2)/t`
m=mass of the vehicle
V=change in speed of the vehicle during decelaration in m/ses
t=time duration
As we know that the energy can never be created or be destroyed with the today's development we have been able to utilize the enegry which is been wasted at the time of braking. The kinetic energy which assists the vehicle to move also gets dissipated while the braking is done.
The car reduced its speed during deceleation or brake
In that
V=2.77m/s in 1s for 10 times which means it may 90 to 80kmph or 60 to 50 kmph or 10 to 0kmph in speed or any change in speed is only 10mkmph
so Be=`(1/2*1000*2.77^2)/1`=3836.45*10=38360joule`
V=5.44m/s in 2s for 4 times which means it may 100 to 80kmph or 60 to 40 kmph or 30 to 10kmph in speed or any change in speed is only 20mkmph
so Be=`(1/2*1000*5.44^2)/2`=7398.4*4=29593.6joules
V=5.44m/s in 3s for 3 times which means it may 100 to 80kmph or 70 to 50 kmph or 20 to 0kmph in speed or any change in speed is only 20mkmph
so Be=`(1/2*1000*5.44^2)/3`=4932.2*3=14796.6joules
V=8.33m/s in 4s for 3 times which means it may 90 to 60kmph or 80 to 50 kmph or 40 to 10kmph in speed or any change in speed is only 30mkmph
so Be=`(1/2*1000*8.33^2)/3`=11564.8*3=34694.4joules`
V=11.1m/s in 5s for 1 times which means it may 90 to 50kmph or 70 to 30 kmph or 40 to 0kmph in speed or any change in speed is only 40mkmph
so Be=`(1/2*1000*11.1^2)/5= 12321`joules
V=16.6.m/s in 5s for 1 times which means it may 100 to 50kmph or 80 to 30 kmph or 50 to 0kmph in speed or any change in speed is only 50mkmph
so Be=`(1/2*1000*16.6^2)/5= 27556`joule`
and the calculation includes almost all deceleration which means consider if the vehicle decelearates from 90kmph to 50kmph in 5sec and it again accelerates from 50 to any speed then change in speed during decelaration is 40kmph and it again decelerates from 50kmph to 0kmph which means change in speed is 50kmph this type of similar velocities 10kmph,20kmph,30kmph 50kmphs are used for calculating Breaking energy for a car using drive cycle
so total Breaking energy=38360+29593.6+14796.6+34694.4+12321+27556=157321.6joules=43.7Wh
2.Why electric motor can’t develop braking torque at high speed similar to starting? How electric and mechanical brakes are coordinated?
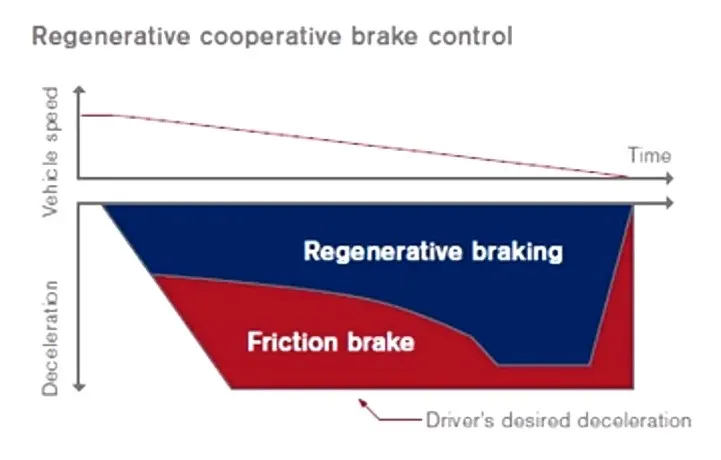
When the motor is at rest and it has to operate from standstill position to the reach the moderate speed the higher torque is required to bring the motor in operation. Whereas when the vehicle is already at high speed the capping or the limit is reached by the motor operation and thus any further higher torque could not be obtained while braking. The braking operation happens in the motion which is been distributed as per proportion in the Brake Energy and the Regenerative Braking.
Initially motor used to run in constant region by adjudting the V/f ratio
`V/Fpropflux prop T``
and when speed is increased or frequency increases motor used to run in constant power region because of the battery voltage limitations. so V/F ratio can't able to maintain.so we can not able maintain same torque as speed increases
Electrical Braking and Mechanical Braking
In mechanical braking which we usually see and experience in all vehicles the brake pedal in the vehicle cabin helps us to engage or disengage the brakes. Currently the braking technology have done wonders by inventing life saving braking technologies such as ABS, EBD, BA and many others. All these technologies play vital role in stopping the vehicle and coming back to rest from a high speed. In all these vehicles when the driver applies the brakes the brake pads come closer to the disc connected with the driving disc. The brake pads usually help in efficient braing,
There are 2 generic methods by which the vehicle could be braked in the Electric Brakes
- Series - The Regenerative Braking or the Mechanical braking both are applied one after another
- Parellel - The Regenerative Braking or the Mechanical braking both are applied parellely.
When the brake pedal is pressed the hydraulic fluid reaches the brake pistons and created the braking pressure on the wheels and the same kinetic energy is been used by the Regenerative Braking for generating more power using the Bi-directional motor which operates as a generator while braking.
An example of the proposition of Regenerative Braking and the Mechanical Braking
Nissan Lead - EDIB (Electronic Driven Intelligent Braking)
3.Make a MATLAB program which plots contour of given motor speed, torque and efficiency values. Attach the code as a .m file attach a screenshot of all the plots.
MATLAB program which plots contour of given motor speed, torque and efficiency values is shown below and it is plotted using known loss coefficients and copper losses,iron losses and windage loss and motor loss constant
Copper Losses -I^2*R, where R is the Armature resistance and we say that Torque is proportional to Current, this copper loss can be consider as .where is to take care of resistance of brushes and also take care of ux and its effect.
Copper losses = `kc*T^2`
Iron Losses - Iron Losses are nothing but Magnetic losses, which is denoted as , where factor is based on the Magnetic eld effect. For Permanent Magnets have constant Magnetic eld and this Iron losses is based on the value of and this are going to change according to the Speed. At Various Speed have different value of Back EMF and that is going to affect the Iron Losses.
Iron Losses =`ki*w`
Windage Losses - This is a Mechanical or friction of Windage losses. This is based on size of shape of Motor and the amount of windage losses that the motor is going to experience.
Windage Losses =`kw*w^3`
Constant Losses - This is denoted as C.
Total Losses - The Total Losses are considering the above four losses and denoted as,
Total Losses =kc*T^2+ki*w+kw*w^3+C

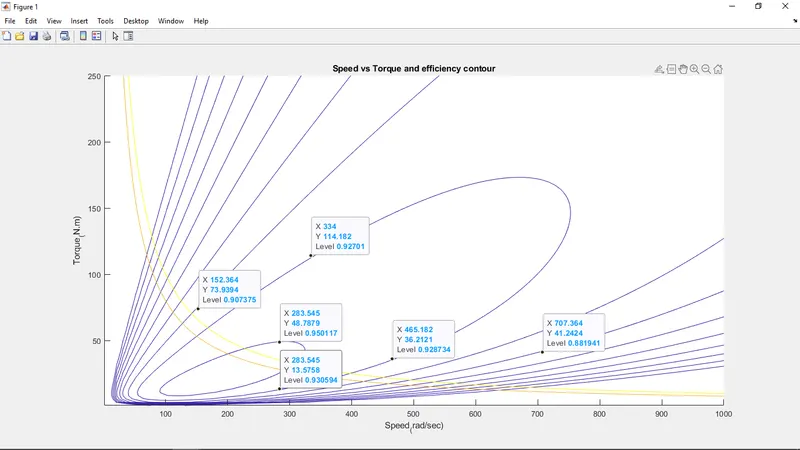
Now we can see below the contour plot of speed torque and efficiency values
the contour plot analysed with 8kw and 10kw power curves
we can seew the many points showing speed torque and efficiency and as the circle gets small the efficiency also increases