Week-11 Challenge: Braking
1.For a defined driving cycle, calculate the energy required for braking.
answer :
To calculate the energy required for braking during a defined driving cycle, you will need to consider the following factors:
-
The mass of the vehicle: The heavier the vehicle, the more energy will be required to bring it to a stop.
-
The initial velocity of the vehicle: The faster the vehicle is moving, the more energy will be required to bring it to a stop.
-
The deceleration rate: The faster the vehicle needs to be brought to a stop, the more energy will be required.
-
The efficiency of the brakes: The more efficient the brakes, the less energy will be required to bring the vehicle to a stop.
The governing equation that is used here for the calculation of braking energy.
The braking energy is nothing but the kinetic energy of the vehicle when the brakes are applied.
The equation of kinetic energy is given by:
K.E - 1/2*(M*(V^2))
where M is the mass of the vehicle in kg
V is the velocity of the vehicle in m/s
To calculate the energy required for braking, you can use the following equation:
Energy required (Joules) = 0.5 * mass of vehicle (kg) * velocity (m/s)^2 * deceleration rate (m/s^2)
Keep in mind that this equation is a rough approximation and does not take into account the efficiency of the brakes or other factors that may affect the energy required for braking.
For more accurate calculations, it may be necessary to use more advanced modeling techniques or to gather data from real-world testing.
------------------------------------------------------------------------------------------------------------------------------------------------------------------------------------------------------------------------------
2.Why electric motor can’t develop braking torque at high speed similar to starting? How electric and mechanical brakes are coordinated?
answer :
An electric motor can generate braking torque at high speeds, but it may not be as effective as at lower speeds due to the laws of physics. When an electric motor is running at high speeds, the magnetic field created by the winding of the stator (stationary part of the motor) becomes less effective at interacting with the magnetic field of the rotor (rotating part of the motor). This means that it becomes more difficult to produce a strong braking torque at high speeds.
Additionally, the mechanical components of the motor, such as the bearings and gears, may not be able to withstand the high stresses that are generated when the motor is operating at high speeds and producing high levels of braking torque. This can lead to mechanical failure or damage to the motor.
In general, it is more effective to use an electric motor to generate braking torque at lower speeds, where the magnetic field interactions are stronger and the mechanical components of the motor are subjected to less stress.
There are a few different ways that electric and mechanical brakes can be coordinated:
-
Hybrid braking system: In a hybrid vehicle, both electric and mechanical brakes may be used to slow the vehicle. The electric brakes may be used to slow the vehicle at lower speeds, while the mechanical brakes may be used at higher speeds or when more braking force is needed.
-
Regenerative braking: Some electric vehicles use a system called regenerative braking, which uses the electric motor to slow the vehicle and generate electricity that is stored in the battery. This can be used in conjunction with mechanical brakes, which may be used to provide additional braking force as needed.
-
Electromechanical brakes: Some vehicles use an electromechanical brake system, which combines both electric and mechanical components. In this system, an electric motor is used to actuate the brake pads, which apply pressure to the brake rotors to slow the vehicle.
Overall, the coordination between electric and mechanical brakes will depend on the specific design of the braking system and the needs of the vehicle. In many cases, the two types of brakes will work together to provide the optimal amount of braking force for the given driving conditions.
------------------------------------------------------------------------------------------------------------------------------------------------------------------------------------------------------------------------------
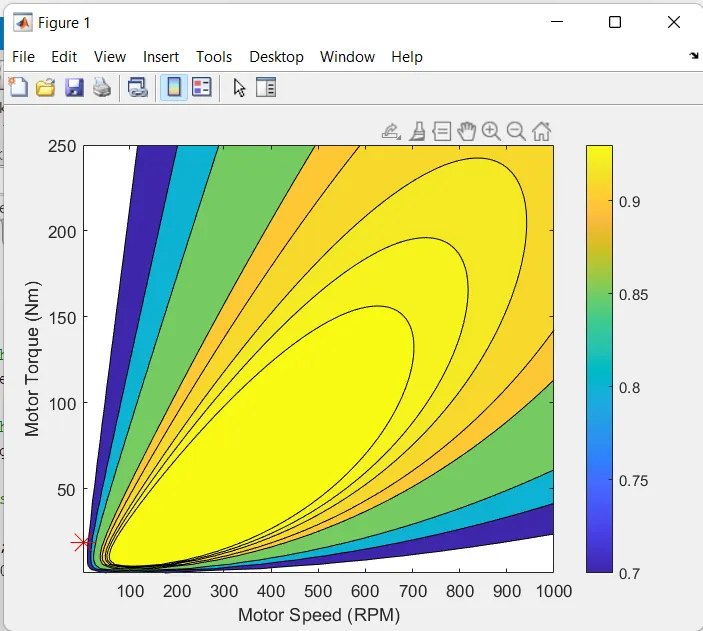
3.Make a MATLAB program which plots contour of given motor speed, torque and efficiency values. Attach the code as a .m file attach a screenshot of all the plots.
answer:
clc;
close all;
clear all;

% Define the range of motor speeds (in RPM)
speed_range = linspace(1,1000);

% Define the range of motor torques (in Nm)
torque_range = linspace(1,250);

% Motor loss constants
Kc = 0.2;     % Copper losses constant
Ki = 0.008;   % Iron losses constant
Kw = 0.00001; % Windage losses constant
ConL = 20;    % Constant motor losses

[speed_range, torque_range] = meshgrid(speed_range, torque_range); % To create a 3D array
Output_power = (speed_range.*torque_range); % Power equation

C_l = (torque_range.^2)*Kc;% Copper losses equation
I_l = speed_range*Ki;     % Iron losses equation
W_l = (speed_range.^3)*Kw;% Windage losses equation

Input_power = Output_power + C_l + I_l + W_l + ConL;
efficiency_values = Output_power./Input_power; % Efficiency

V = [0.7,0.8,0.85,0.9,0.91,0.92,0.925,0.93]; % Mapping the contours of the

% Find the maximum efficiency value
max_efficiency = max(efficiency_values(:));
% Find the indices of the maximum efficiency value
[row, col] = find(efficiency_values == max_efficiency);

% Get the corresponding motor speed and torque values
max_speed = speed_range(col);
max_torque = torque_range(row);

% Create the contour plot
figure;
contourf(speed_range, torque_range, efficiency_values,V);
xlabel('Motor Speed (RPM)');
ylabel('Motor Torque (Nm)');
colorbar;

% Overlay a marker on the plot to indicate the maximum efficiency
hold on;
plot(max_speed, max_torque, 'r*', 'MarkerSize', 15);
hold off;
speed_range that contains a range of motor speeds in RPM, using the linspace function. The range goes from 1 to 1000 RPM.
torque_range that contains a range of motor torques in Nm, using the linspace function. The range goes from 1 to 250 Nm.
Kc: The constant for the copper losses.Ki: The constant for the iron losses.Kw: The constant for the windage losses.
[speed_range, torque_range] = meshgrid(speed_range, torque_range); % To create a 3D array Output_power = (speed_range.*torque_range); % Power equation.provided creates a 3D array called Output_power by taking the element-wise product of the 2D arrays speed_range and torque_range. The meshgrid function is used to create the 2D arrays speed_range and torque_range from the 1D arrays of the same name.
- C_l : Copper losses equation
- I_l : Iron losses equation
- W_l : Windage losses equation
the input power of the system is calculated as the sum of the output power, the constant losses C_l, the idle losses I_l, the windage losses W_l, and the contact losses ConL. The efficiency of the system is then calculated as the element-wise ratio of the output power to the input power, resulting in a 2D array efficiency_values with the same size as the input arrays Output_power and Input_power.
The V array specifies the contour levels to be plotted on the contour plot. The contourf function generates the contour plot, with the x-axis representing the motor speed, the y-axis representing the motor torque, and the contour levels representing the efficiency. The xlabel and ylabel functions add labels to the x-axis and y-axis, respectively. The colorbar function adds a colorbar to the plot, which shows the range of values represented by the colors in the contour plot.
The find function is used to find the indices of the maximum efficiency value in the efficiency_values array. The max function is used to find the maximum efficiency value, and the find function is used to find the indices of the element in the efficiency_values array that has the maximum value.
The corresponding motor speed and torque values at the maximum efficiency point are then obtained by using the indices returned by the find function to index into the speed_range and torque_range arrays.
Finally, a marker is plotted on the contour plot using the plot function to indicate the point corresponding to the maximum efficiency. The hold on and hold off functions are used to overlay the marker on the existing plot.