Week-11 Challenge: Braking
- For a defined driving cycle, calculate the energy required for braking.
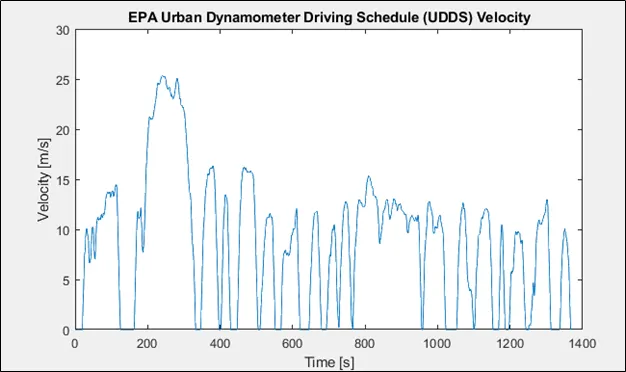
consider UDDS for calculation of breaking energy
| Vehicle Braking Calculation | |
| Input Parameters | |
| Kerb Weight (kg) | 800 |
| Pay Load (kg) | 100 |
| Braking Energy Calculation | |
| Initial Velocity(Km/hr) | 80 |
| Initial Velocity(m/sec) | 40 |
| Final Velocity(Km/hr) | 0 |
| Final Velocity(m/sec) | 0 |
| Time(s) | 20 |
| Energy(J) | 720000 |
| Deceleration (m/s^2) | -20 |
| Deceleration Force (N / Kg m/s^2) | -176580 |
| Deceleration Power (KW) | 42 |
| Braking Power (KWh) | 0.011666667 |
kinetic energy of vehicle while moving is converted into breaking enegy hence
Breaking energy =0.5*m*v^2
calculations are done in excel sheet with apropriate formulae.
2. Why electric motor can’t develop braking torque at high speed similar to starting? How electric and mechanical brakes are coordinated?
Electric Motor Braking :
Eectric motor can’t develop braking torque at high speed similar to starting,Electric motor can't develop braking torque at high speed similar to starting, because Braking Torque of an EV Motor is not as high as the Acceleration Torque. Therefore Regenerative braking is cannot happen so effectively that we can get all the power back to the battery.
Braking is the process of controlling the velocity of an object by inhibiting its motion. An object in motion possesses kinetic energy and to bring the object to a stop this kinetic energy must be removed. Removing the kinetic energy can be accomplished by dissipating the energy to the atmosphere through friction or by converting it into another form of energy. The most common type of braking is a mechanical brake which inhibits motion through friction brake pads. A mechanical brake applies a friction force to convert the kinetic energy of the vehicle into thermal energy which then dissipates into the atmosphere. Braking systems which don't use friction are referred to as Regenerative Braking System (RBS). In RBS, the kinetic energy is converted into other forms of useful energy, which can be stored for later use, increasing fuel efficiency.
As with any system, the process of braking must follow the principal of conservation of energy. Energy cannot be created or destroyed but only converted from one form to another,
Einput=Eoutput
The energy present in an object in motion is given by the following equation:
KE=1/2m*v^2
where,
m- mass of the object in Kilogram(Kg),
v - velocity of the object in meters per second(m/s),
From this above equation, and assuming the mass of the object is constant, it is clear the in order to remove the kinetic energy from the system, the velocity must be brought to zero. which is difficult with electrical breaking .
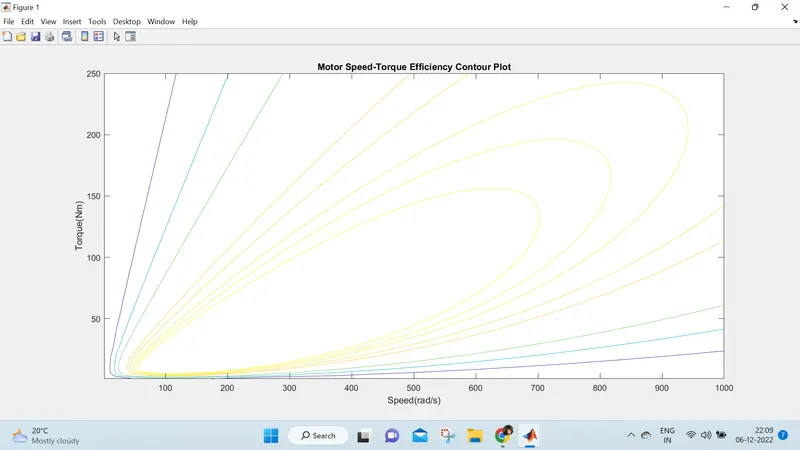
Contour : contour(Z) creates a contour plot containing the isolines of matrix Z, where Z contains height values on the x-y plane. MATLAB automatically selects the contour lines to display. The column and row indices of Z are the x and y coordinates in the plane, respectively. `
'contour(X,Y,Z)' specifies the x and y coordinates for the values in Z.
Step-1 : Assign Input of Speed and Torque in an array using 'linspace' Command and allocate Constant Values for four losses(Copper Loss, Iron Loss, Windage Loss and Constant Motor Loss)
Step-2 : Mesh the Speed and Torque values using 'meshgrid' command.
Step-3 : Calculate the Output Power by multiplying Speed and Torque values.
Step-4 : Calculate Copper Loss, Iron Loss, Windage Loss using those formulas.
Step-5 : Calculating Inputpower by adding Output Power and Four Losses(Copper Loss, Iron Loss, Windage Loss and Constant Motor Loss).
Step-6 : The ratio of Output Power and Input Power we can get the Efficiency.
Step-7 : Now Set the Efficiencies for which a contour will be plotted. The range of contour efficiency is to plot from 70% to 93% efficiency. V is the Mapping of those efficiency points.
Step-8 : Plot the Contour Efficiency using 'contour' command and plot Speed,Torque,Efficiency and V.
Step-9 : Now plot a contour of Power Output. Plotting contour of 8kw and 10kw of a Motor.
Step-10 : Run the Program and get the Motor Speed-Torque Efficiency Contour Plot.