Week-11 Challenge: Braking
EV Live Batch 21.
1 Aim: For a defined driving cycle, calculate the energy required for braking.
Ans Here we have to create the driving cycle in work space of energy required of braking energy.
Excel Sheet:
=> Here we want to create drive cycle our own create a two coloum that is Time(s) and Speed (km/hr)
this is how a excel sheet look:
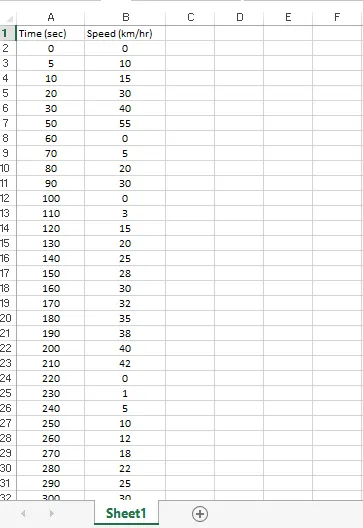
=> We need to import this excel data to workspace by using import data option so this data is imported using the name as speed.
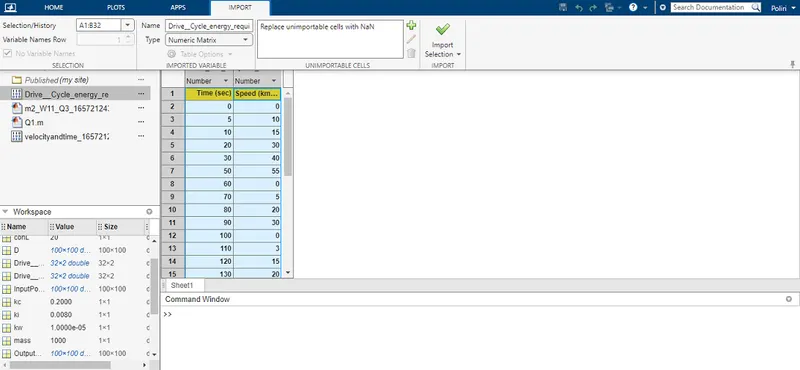
=> Here we given work space as time and speed then after import the data.
Result:
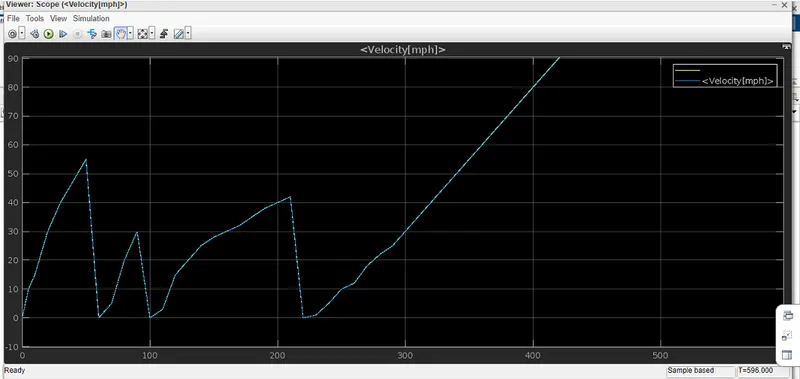
=> When we run the model in work space then we got a scope of the energy required for braking point.
2 Aim:
Why electric motor can’t develop braking torque at high speed similar to starting? How electric and mechanical brakes are coordinated?
Ans:
Object Of Braking Torque:
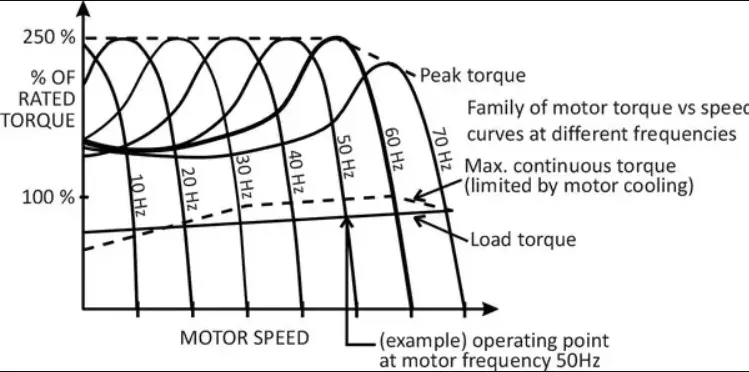
=> The Peak Acceleration Torque and Peak Deceleration torque are not equal for Electric Vehicle Motor. So the Peak Torque during acceleration and the Peak torque during deceleration or braking are not equal.
=> Acceleration is usually higher, at low speed we get higher Torque but high speed the value of the torque gets lower. So we cannot say that the motor which is producing 7Nm Torque for Acceleration can also produce -7Nm of Braking Torque.
=> So beacuse we Operating the Motor in Field Weakening region or we are operating the Motor above base speed we must know that the torque is compromised or the torque value is lower.
=> So Electric motor can't develop braking torque at high speed similar to starting, because Braking Torque of an EV Motor is not as high as the Acceleration Torque.
=> Therefore Regenerative braking is cannot happen so effectively that we can get all the power back to the battery.
How electric and mechanical brakes are coordinated:
=> The Regenerative braking power requirement is more than the charging limit of the battery or more than regenerative capacity of the machine we must apply Mechanical brakes as well. In practically some cases the combination of these two is applied.
=> So usually it is combined response of Mechanical brake and Regenerative brake. The reason for how these brake force are combined, that particular phenomena is called Brake Control Strategies.
There are two Brake Control Strategies, which are:
1. Series Braking
2. Parallal Braking
1. Series Braking:
In case of Series we apply Mechanical brake and Regenerative electric brake one after another. We can apply only one brake strategy at a time either apply Regenerative or apply Mechanical brake.
2. Parallal Braking:
In case of Parallel we apply both brakes simultaneously. This Particular Parallel braking is going to happen both at a time.
Electric Driven Intelligent Brake (EDIB):
=> Electric Driven Intelligent Brake (EDIB) is a combination of Hydraulic brake or Mechanical brake along with a Regenerative brake. It is a Parallel braking technique. The Control criteria such that at low speed use regenerative braking higher and at high speed or during initial braking period we actually combine the both.
3 Aim:
Make a MATLAB program which plots contour of given motor speed, torque and efficiency values. Attach the code as a .m file attach a screenshot of all the plots.
Ans:
MATLAB Code:
=> When we create the matlab code in script file then we the run the file we got a output plot
Output Plot:
=> Here From this plot we can see that the highest level of efficiency arises in the inner most contour plot and this efficiency decreases as the contours increase in size from the inner most contour.
=> From the torque particular speed and torque the efficiency is at maximum 95%.
=> And speed is decreasesing the efficiencies of the motor will be reduced.